JOE re-testing ATLJOE has recently re-tested the all-time-low @ $0.13.
ATH was $5.00 in November 2021
Uplift to ATH from current position = 2,800%.
R:R ratio @ 123:1
Breaks above the downtrend could propel JOE to the ATH.
Estimated flight time = 8 months (assuming symmetry with BTC halving cycle "top")
Key stats
About Trader Joe
Related coins

CHEAP DEX's are a proven crypto technology...are straightforward to grasp and this sector is likely to experience a rebound from these low points. Following a Memecoin downturn, they should attract greater investor interest and capital influx.
Kicking off with #JOE
Year Founded: Trader Joe emerged in 2021 and has swiftly established a solid st

JOE dirt ; the hillbilly's token. the farmer's champion.thesis; AVAX is finally doing its move (its always last btw)
JOE makes lots of fees; check it on defilama.
JOE makes lots of swaps.
avax go up; JOE go up even more.
thats it. thats the thesis.
now we farm the onions and potatoes and retire into the sunset
lfg

JOE looks bullishLooks like joe is in wave C of a diametric. Now it seems that wave C of this diametric itself is an abc, which is now at the end of wave b. Actually now we are in wave b of C of this diametric.
It is expected to reject upwards from the green range and the price will enter wave c of C.
Our target is

TRADE ALERT - LONG JOEYes, I know. The altcoin market is very nervous. And rightfully so. But Defi does especially well comparatively when regional banks are faltering. Right now, regional banks (KRE) are moving down and becoming weaker once again. Could we see more defaults? Probably. But this isn't about regional banks

JOE looks like a great setup here!Traders,
I'm a bit over-weighted in my public portfolio rn, but I really do like this setup in the DeFi coin JOE.
Bullish Indicators:
*Hidden Bullish Divergence on RSI
*Close to Bullish Triangle Exit
*Above the 200 Day MA
Bearish Indicators:
*Under the June 4th Crash Level
*Possible re-trace to

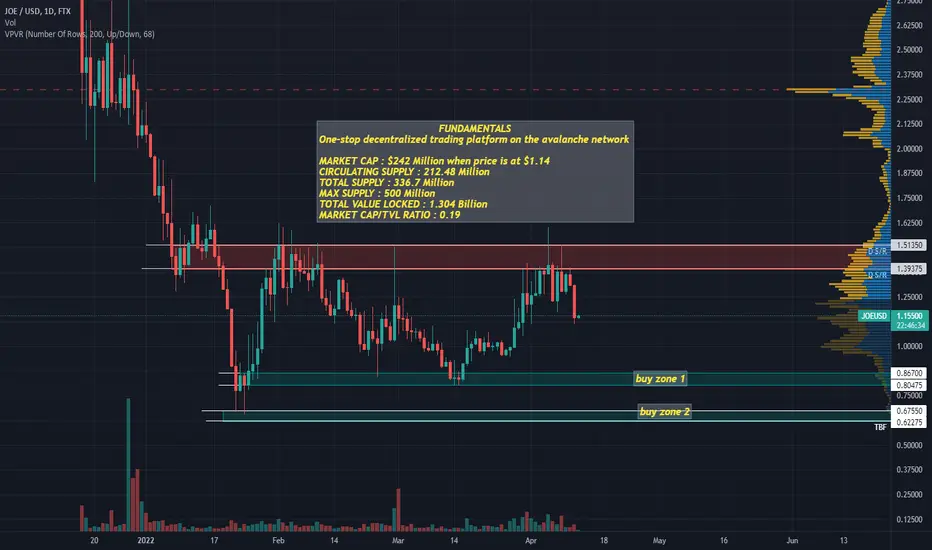
JOE buy/sell zonesJoe is a decentralized platform on AVAX ecosystem with Market cap of of only 242 million.
Its Market cap / total value locked ratio = 0.19 which is highly under valued compared to other platform like uniswap which has 0.54 ratio on ethereum network.
Technically people who believe in AVAX ecosyst
JOE TOKEN BREAKOUT Current 4hr indicators show bearishness. However, this is crypto, and the recent successful back test of a major downtrend breakout leaves ones palms itchy. DDD. NOT FINANCIAL ADVICE.

See all ideas
Summarizing what the indicators are suggesting.
Oscillators
Neutral
SellBuy
Strong sellStrong buy
Strong sellSellNeutralBuyStrong buy
Oscillators
Neutral
SellBuy
Strong sellStrong buy
Strong sellSellNeutralBuyStrong buy
Summary
Neutral
SellBuy
Strong sellStrong buy
Strong sellSellNeutralBuyStrong buy
Summary
Neutral
SellBuy
Strong sellStrong buy
Strong sellSellNeutralBuyStrong buy
Summary
Neutral
SellBuy
Strong sellStrong buy
Strong sellSellNeutralBuyStrong buy
Moving Averages
Neutral
SellBuy
Strong sellStrong buy
Strong sellSellNeutralBuyStrong buy
Moving Averages
Neutral
SellBuy
Strong sellStrong buy
Strong sellSellNeutralBuyStrong buy
Frequently Asked Questions
The current price of Trader Joe (JOE) is 0.1508 USD — it has fallen −3.83% in the past 24 hours. Try placing this info into the context by checking out what coins are also gaining and losing at the moment and seeing JOE price chart.
The current market capitalization of Trader Joe (JOE) is 60.04 M USD. To see this number in a context check out our list of crypto coins ranked by their market caps or see crypto market cap charts.
Trader Joe (JOE) trading volume in 24 hours is 7.73 M USD. See how often other coins are traded in this list.
Trader Joe price has fallen by −13.53% over the last week, its month performance shows a −0.66% decrease, and as for the last year, Trader Joe has increased by 0.53%. See more dynamics on JOE price chart.
Keep track of coins' changes with our Crypto Coins Heatmap.
Keep track of coins' changes with our Crypto Coins Heatmap.
Trader Joe (JOE) reached its highest price on May 12, 2025 — it amounted to 0.2312 USD. Find more insights on the JOE price chart.
See the list of crypto gainers and choose what best fits your strategy.
See the list of crypto gainers and choose what best fits your strategy.
Trader Joe (JOE) reached the lowest price of 0.1267 USD on Jun 22, 2025. View more Trader Joe dynamics on the price chart.
See the list of crypto losers to find unexpected opportunities.
See the list of crypto losers to find unexpected opportunities.
The current circulating supply of Trader Joe (JOE) is 464.57 M USD. To get a wider picture you can check out our list of coins with the highest circulating supply, as well as the ones with the lowest number of tokens in circulation.
Trader Joe has the limit of 500.00 M coins. No matter how the currency evolves, no new coins will be released after this number is reached.
The safest choice when buying JOE is to go to a well-known crypto exchange. Some of the popular names are Binance, Coinbase, Kraken. But you'll have to find a reliable broker and create an account first. You can trade JOE right from TradingView charts — just choose a broker and connect to your account.
Trader Joe (JOE) is just as reliable as any other crypto asset — this corner of the world market is highly volatile. Today, for instance, Trader Joe is estimated as 3.98% volatile. The only thing it means is that you must prepare and examine all available information before making a decision. And if you're not sure about Trader Joe, you can find more inspiration in our curated watchlists.
You can discuss Trader Joe (JOE) with other users in our public chats, Minds or in the comments to Ideas.