joe Intelligent AssetBullish scenario
Resistance at 0.68
A breakout could lead to an upper limit of the channel at 0.75
Bearish scenario
Break of the low pivot at 0.558
May lead support at 0.447 Consolidation of 50 ema with horizontal trend line
JOEUSDT trade ideas

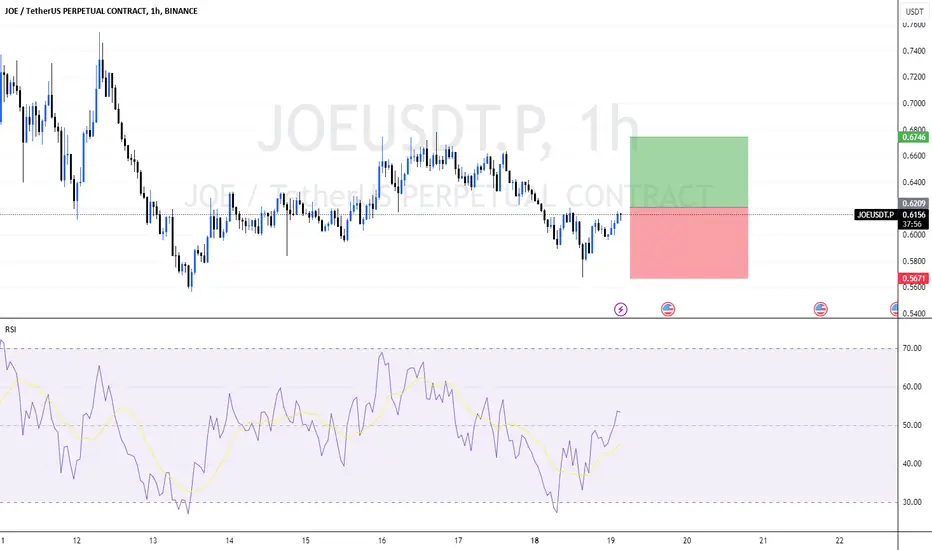
JOEUSDT - BULLISH OUTLOOKJOEUSDT is indicating a potential trading opportunity based on a bullish trend and a bullish divergence observed in the 1-hour timeframe. Here's a concise analysis and trade plan:
Entry: Consider entering a long position through a BUY STOP order, triggered at a price slightly above the current market price, around $0.6210.
Stop Loss (SL): Set the stop loss at $0.5670 to manage potential downside risk.
TP @ 1:1 = $0.6750.
This trade plan is designed to capitalize on the identified bullish trend and divergence in JOEUSDT, providing a potential opportunity for a continuation of the upward movement. Entering through a BUY STOP order allows for confirmation of the bullish momentum. As always, staying informed and adapting to market conditions is crucial for successful trading.
Joe breaking out of flag?Joe had a little fakeout recently and is looking to break out of the extended flag, I got in a while ago so am not super worried but expect it to pump soon as avax defies the market.

Joe Embrace the Power of Crypto: Invest Smart and Build Wealth**Joe Coin (JOE)**
**Fundamentals**
Joe Coin is the native token of the JoeDEX decentralized exchange (DEX) on the Binance Smart Chain (BSC). It serves several purposes within the JoeDEX ecosystem, including:
* **Staking rewards:** Joe Coin holders can stake their tokens to earn rewards in the form of both JOE and other cryptocurrencies.
* **Governance:** JOE holders have voting power on important decisions related to the JoeDEX platform, such as new listings and protocol upgrades.
* **Fee discounts:** Using JOE to pay for transaction fees on JoeDEX results in a significant discount compared to using other cryptocurrencies.
**Recent News**
* **JoeDEX Integrates Chainlink Oracles:** JoeDEX has integrated Chainlink oracles to provide real-time price feeds for supported cryptocurrencies. This will help to ensure the accuracy and reliability of trading on the platform.
* **JoeDEX Launches Staking Rewards Program:** JoeDEX has launched a new staking rewards program that rewards JOE holders with a variety of cryptocurrencies, including BNB, USDT, and ETH.
* **JoeDEX Partners with GoldMint:** JoeDEX has partnered with GoldMint to provide users with the ability to mint and trade synthetic gold (sXAU) on the platform. This is a significant step in the development of decentralized finance (DeFi) applications for gold.
**Disclaimer**
Please note that Joe Coin is a relatively new cryptocurrency project and is still under development. As such, it is important to do your own research before investing in JOE. The price of JOE Coin is subject to significant volatility and could potentially go down significantly in value. Additionally, there is no guarantee that JoeDEX will be successful in the long term.
Please do not consider this information as financial advice.

long JOENYSE:JOE bounced off the support level and the ascending trendline. Bullish trend is expected to continue and reach the resistance level at $0.75

Joe looking to flag to golden fibJoe, like avax is looking to flag to the golden fib. I have held this token from the depths of the lows and stake it to receive USDC while I let this run continue. I also use JOE to swap between arbitrum and avalanche ecosystems. My first target is 83 cents, then that golden .5 fib. The token is trying to test the current fib resistance this flag is forming on which makes me bullish, the candle wick is pretty short too which favors a breakout. I added a demand incase this thing falls apart, I will 100% add if it falls to demand.

joeThere is an important resistance here that you can see in the weekly. There is also a small support in the green box. If there is support there, let it rise again and then enter the trade according to the market conditions.
If the green box breaks, your next targets can be green lines

JOEUSDT Trend Line Breakout!JOEUSDT Technical Nalaysis Update
JOE/USDT is breaking its trend resistance line. The price is trading above the 100EMA and 200EMA. We are expecting a good up move.
Buy zone : Below $0.418
Stop loss : $0.355
Resistance 1 : $0.474
Resistance 2 : $0.564
Resistance 3 : $0.725
Regards
Hexa

🚀 JOE/USDT Monthly Double Bottom 📈 - Bullish ReversalHey TradingView fam! 👋 Exciting times for JOE/USDT as it forms a potential monthly double bottom pattern. 🔄 Let's dive into the chart for some juicy insights. 📊
Technical Analysis:
🔍 Pattern: Double Bottom
📅 Timeframe: Monthly
💹 Pair: JOE/USDT
Chart Overview:
✅ Confirmation: The double bottom pattern is in the process of confirming.
📈 Reversal Signal: Look for a breakout above the neckline for a strong bullish signal.
Key Levels:
🔝 Resistance: Watch for resistance at .
🔓 Breakout Target: Target the measured move from the double bottom pattern.
Indicators:
📉 RSI: Confirm the bullish momentum with RSI above 50.
📊 Volume: Look for increasing volume on the breakout for validation.
Trade Plan:
🎯 Entry: Long on a confirmed breakout above the neckline.
🛑 Stop-Loss: Set a stop-loss below the pattern's low for risk management.
📈 Target: Target the projected move based on the pattern's height.
Disclaimer: This is not financial advice. Always do your research and manage your risk.
🚨 Risk Warning: Cryptocurrency trading involves a high level of risk and may not be suitable for all investors.
Let's stay connected! 🌐 Drop your thoughts in the comments and share your analysis. 🤔📣 #JOEUSDT #Crypto #TechnicalAnalysis #DoubleBottom #Bullish #TradingView #ChartAnalysis 🚀📈

JOE/USDT - Trader Joe: BBand Breakout◳◱ On the $JOE/ CRYPTOCAP:USDT chart, the Bband Breakout pattern suggests an upcoming trend shift. Traders might observe resistance around 0.4666 | 0.5019 | 0.5907 and support near 0.3778 | 0.3243 | 0.2355. Entering trades at 0.5011 could be strategic, aiming for the next resistance level.
◰◲ General info :
▣ Name: Trader Joe
▣ Rank: 231
▣ Exchanges: Binance, Bybit, Huobipro, Gateio, Mexc, Hitbtc
▣ Category/Sector: N/A
▣ Overview: Trader Joe is a decentralized trading platform on the Avalanche network that combines DEX services with DeFi lending to offer leveraged Trading. The platform allows users to trade (AMM exchange), participate in yield farming, staking, and borrowing.
◰◲ Technical Metrics :
▣ Mrkt Price: 0.5011 ₮
▣ 24HVol: 6,593,539.140 ₮
▣ 24H Chng: 9.506%
▣ 7-Days Chng: 32.31%
▣ 1-Month Chng: 73.65%
▣ 3-Months Chng: 91.48%
◲◰ Pivot Points - Levels :
◥ Resistance: 0.4666 | 0.5019 | 0.5907
◢ Support: 0.3778 | 0.3243 | 0.2355
◱◳ Indicators recommendation :
▣ Oscillators: SELL
▣ Moving Averages: STRONG_BUY
◰◲ Technical Indicators Summary : BUY
◲◰ Sharpe Ratios :
▣ Last 30D: 5.32
▣ Last 90D: 3.02
▣ Last 1-Y: 1.20
▣ Last 3-Y: 0.29
◲◰ Volatility :
▣ Last 30D: 1.22
▣ Last 90D: 0.87
▣ Last 1-Y: 1.18
▣ Last 3-Y: 1.51
◳◰ Market Sentiment Index :
▣ News sentiment score is N/A
▣ Twitter sentiment score is N/A
▣ Reddit sentiment score is 0.41 - Bearish
▣ In-depth JOEUSDT technical analysis on Tradingview TA page
▣ What do you think of this analysis? Share your insights and let's discuss in the comments below. Your like, follow and support would be greatly appreciated!
◲ Disclaimer
Please note that the information and publications provided are for informational purposes only and should not be construed as financial, investment, trading, or any other type of advice or recommendation. We encourage you to conduct your own research and consult with a qualified professional before making any financial decisions. The use of the information provided is solely at your own risk.
▣ Welcome to the home of charting big: TradingView
Benefit from a ton of financial analysis features, instruments and data. Have a look around, and if you do choose to go with an upgraded plan, you'll get up to $30.
Discover it here - affiliate link -

JOE longNYSE:JOE broke through the resistance level on the daily chart. Bullish movement to resistance level at $0.68 is expected to happen.


JOEUSDT"As we enter the bullish season, the initial target to aim for is
target : 7.0 🎯.
This is based on a combination of technical analysis indicators and market trends.
However, it's important to approach trading with caution and adapt to changing market
conditions.
Keep an eye on key support and resistance levels, as well as any significant news or events that may impact the market.
Remember to use proper risk management techniques and consider setting profit targets along the way.
Happy trading!"

Keeping an eye on #JOE/USDT Diagonal Trendline in 4-Hour TF!Keeping an eye on #JOE/USDT Diagonal Trendline in 4-Hour TF!
I am expecting a scenario like this. Expecting PDL before a pump. Wait for BO to open a long position in $JOE.

#JoeusdtThe market is on the verge of a massive breakout, having formed a symmetrical triangle. In the event of a breakout, we anticipate a bullish wave ranging from 250% to 300% .

JOEUSDTJOEUSDT was trading in symmetrical triangle pattern. The price was reacting well the support and resistance of triangle.
Currently the price has given the breakout of triangle and now retesting the broken level where it is also forming a local support zone and seems like the price may go for another leg higher.
If the breakout sustain to upside the optimum target could be 0.40 followed by 0.50
What you guys think of this idea?

long JOENYSE:JOE bounced off the support level and the ascending trendline. Bullish movement to resistance level at 0.4410$ is expected to happen.

Joe turning a channel into supportive structure Joe is looking to attempt to turn the previous medium term channel into a new support level. The gold line is the .382 fib which is a key area looking to be tested again soon. Volume is still on an overall uptick and RSI is cooling off as it needs to before another rally. The demand box is a fall through zone is this doesnt play out. I think the token tests the golden line once or twice more before breaking.

Joe restested channel and breakoutJoe just retested this channel recently and broke out with the AVAX hype. The dashed green is my short-term price target for now which was just passed, so I think we see 50 cents soon. HV and RSI are rising sharply into this BTC rally.

#JOE#JOE
For the coin, bullish movement is a priority.
I expect to see the coin in the area of $0.35 with a breakout of this level to $0.42 (1.) soon, where a small rollback is possible.
To confirm further growth, it is important to see the coin above $0.429, where I expect the coin to consolidate between $0.429 - $0.47(2.), where there will either be further growth to $0.6(3.), or a pullback to the lower values (4. )
Of course, if a correction happens now, then consolidation in the area of 0.2968 - 0.2799 $ (5.) is normal, we can see further growth from these values.
Of course, consolidation below $0.2799 will mean a return to the lower boundaries (6.), you can see on the chart.

JOE Next Move: Grab the Bull by the Horns! 🚀 - A Strategic Buy Welcome to our crypto exploration hub! We're here to navigate the exciting world of digital assets, providing you with comprehensive insights into market dynamics and potential trading opportunities.Our mission is to decode the crypto market's mysteries and equip you with the knowledge you need to make informed investment choices. From the latest developments in Bitcoin to the hidden potential of various altcoins, we're your trusted source for daily technical analysis.While technical analysis is a valuable tool, it's important to remember that it's just one piece of the puzzle. We encourage you to take a well-rounded approach to your investments, considering factors like macroeconomic trends, news, and community sentiment.Join us for the freshest analyses, and don't hesitate to join the conversation in the comments below. Keep in mind that our content is purely for educational purposes and should not be construed as financial advice. Always integrate it into your broader investment strategy."

Joe in uptrend Joe remains in a clear uptrend towards golden support. A local demand is drawn incase the channel briefly breaks. The 20SMA continues to provide support, the RSI uptrend remains. Joe has been in the bottom half of the channel for more than 75% of the journey. The dashed green is another historical area of importance. If this trend continues we should see 30 cents within 2 weeks.

BULL RUN 2024-2025There is a similarity with ETC. all the thoughts described in the previous idea. Look. I write for myself and stories. Thoughts out loud
