AJ Possible Bullish C-D leg Looking to see how price reacts to supports and resistance levels. Waiting mostly to see what possible opportunities arrise.
JPYAUD trade ideas

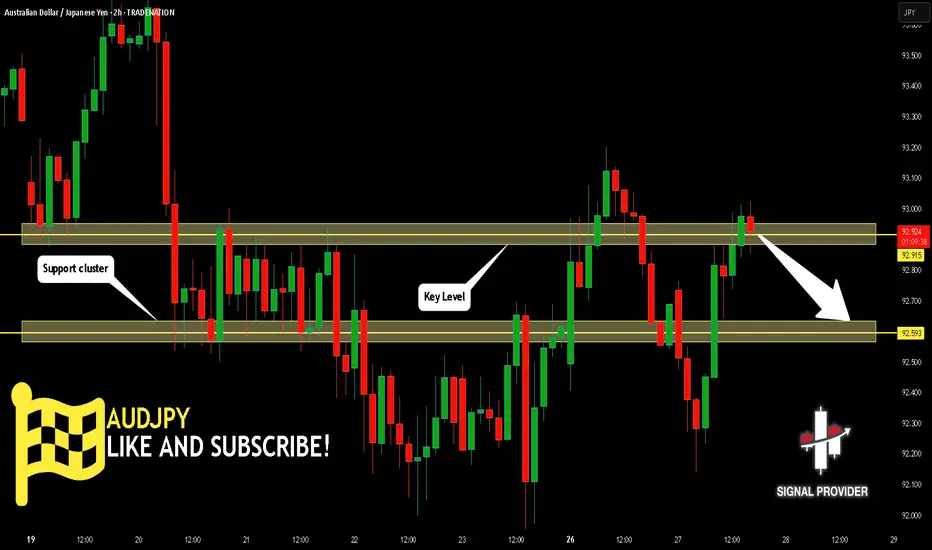
AUDJPY Will Go Lower From Resistance! Short!
Here is our detailed technical review for AUDJPY.
Time Frame: 2h
Current Trend: Bearish
Sentiment: Overbought (based on 7-period RSI)
Forecast: Bearish
The market is approaching a significant resistance area 92.915.
Due to the fact that we see a positive bearish reaction from the underlined area, I strongly believe that sellers will manage to push the price all the way down to 92.593 level.
P.S
Please, note that an oversold/overbought condition can last for a long time, and therefore being oversold/overbought doesn't mean a price rally will come soon, or at all.
Disclosure: I am part of Trade Nation's Influencer program and receive a monthly fee for using their TradingView charts in my analysis.
Like and subscribe and comment my ideas if you enjoy them!
AUDJPY: Bearish Continuation is Highly Probable! Here is Why:
The charts are full of distraction, disturbance and are a graveyard of fear and greed which shall not cloud our judgement on the current state of affairs in the AUDJPY pair price action which suggests a high likelihood of a coming move down.
Disclosure: I am part of Trade Nation's Influencer program and receive a monthly fee for using their TradingView charts in my analysis.
❤️ Please, support our work with like & comment! ❤️

AudJpy Trade IdeaWith AJ still ranging between 92.240 and 93.535 I've decided to execute longs with a 1:3rr target. Last week we had price respect 92.240 before flipping structures. With price still respecting 92.240 and flipping back to bullish on the smaller time frame longs should still be in play where 93.535 could potentially get tapped back into again with price showing a range continuation. We'll see what happens.

AUD/JPY BEARS ARE STRONG HERE|SHORT
Hello, Friends!
We are targeting the 92.544 level area with our short trade on AUD/JPY which is based on the fact that the pair is overbought on the BB band scale and is also approaching a resistance line above thus going us a good entry option.
Disclosure: I am part of Trade Nation's Influencer program and receive a monthly fee for using their TradingView charts in my analysis.
✅LIKE AND COMMENT MY IDEAS✅

Bearish drop off overlap resistance?AUD/JPY is rising towards the pivot, which acts as an overlap resistance and could reverse to the 1st support which is also an overlap support.
Pivot: 93.36
1st Support: 91.10
1st Resistance: 94.07
Risk Warning:
Trading Forex and CFDs carries a high level of risk to your capital and you should only trade with money you can afford to lose. Trading Forex and CFDs may not be suitable for all investors, so please ensure that you fully understand the risks involved and seek independent advice if necessary.
Disclaimer:
The above opinions given constitute general market commentary, and do not constitute the opinion or advice of IC Markets or any form of personal or investment advice.
Any opinions, news, research, analyses, prices, other information, or links to third-party sites contained on this website are provided on an "as-is" basis, are intended only to be informative, is not an advice nor a recommendation, nor research, or a record of our trading prices, or an offer of, or solicitation for a transaction in any financial instrument and thus should not be treated as such. The information provided does not involve any specific investment objectives, financial situation and needs of any specific person who may receive it. Please be aware, that past performance is not a reliable indicator of future performance and/or results. Past Performance or Forward-looking scenarios based upon the reasonable beliefs of the third-party provider are not a guarantee of future performance. Actual results may differ materially from those anticipated in forward-looking or past performance statements. IC Markets makes no representation or warranty and assumes no liability as to the accuracy or completeness of the information provided, nor any loss arising from any investment based on a recommendation, forecast or any information supplied by any third-party.

Continuation WedgeThe price broke a 4 hour trendline followed by a pullback as a wedge pattern on the 1 hour timeframe and now the price looks to make a bearish move
WE ONLY TRADE PULLBACKS

AUDJPY SHORT FORECAST Q2 W22 D26 Y25AUDJPY SHORT FORECAST Q2 W22 D26 Y25
Professional Risk Managers👋
Welcome back to another FRGNT chart update📈
Diving into some Forex setups using predominantly higher time frame order blocks alongside confirmation breaks of structure.
Let’s see what price action is telling us today! 👀
💡Here are some trade confluences📝
✅Weekly Order block rejection
✅4H Order block identification
✅15' Order block identification
✅4H 50EMA target
✅Daily 50 EMA target
🔑 Remember, to participate in trading comes always with a degree of risk, therefore as professional risk managers it remains vital that we stick to our risk management plan as well as our trading strategies.
📈The rest, we leave to the balance of probabilities.
💡Fail to plan. Plan to fail.
🏆It has always been that simple.
❤️Good luck with your trading journey, I shall see you at the very top.
🎯Trade consistent, FRGNT X

Market buy scenarioWill the market continue to break down or break up and retest the zones plotted for this week

AUD/JPY “Aussie vs. Yen” Skyrocketing Safari!🌈 G’day, Forex Adventurers & PIP Hunters! 🌏✨
Join our epic AUD/JPY Forex expedition! 🦘🚀 Our Stellar Navigator Strategy fuses pinpoint technicals with powerful fundamentals to chase profits in the Aussie-Yen jungle. Ready to soar to new heights and grab those pips? Let’s embark on this bullish quest! 🌍💰
🌟 The Stellar Navigator Plan
Entry Points 🛫:
🦅 Bullish Launch: Jump in after a breakout above the Sky High at 94.800—your cue for bullish gains!
🐾 Pullback Path: Place buy limit orders near the 15M/30M support (94.200) for a savvy entry.
Pro Tip: Set alerts to spot the breakout spark! 🔔
Stop Loss (SL) 🛡️:
Bullish Trade: Secure SL at the 2H support (93.600) for day trades.
Tailor SL to your risk, lot size, and order count. This is your safety net—keep it snug! ⚠️
Take Profit (TP) 🎯:
Bullish Explorers: Aim for the Star Peak at 96.500 or exit if the momentum dips.
Scalpers: Grab quick pips on the long side, but lock in gains with trailing stops! 🚨
🌏 Why AUD/JPY?
The Aussie’s soaring 📈 as of May 12, 2025, powered by:
Fundamentals: RBA’s 4.35% rate dwarfs BoJ’s 0.1%, boosting AUD.
Macroeconomics: Australia’s commodity boom (gold, iron ore) outpaces Japan’s slow recovery.
COT Data (May 9, 2025): Rising AUD net longs signal bullish sentiment (source: CFTC).
Intermarket: AUD/JPY tracks Nikkei 225’s risk-on rally.
Quantitative: RSI (14) at 59 and a break above the 50-day SMA (93.57) confirm upward momentum.
📊 Sentiment Snapshot (May 12, 2025, UTC+1)
Retail Traders:
🟢 Bullish: 53% 😊 (RBA strength, China trade optimism)
🔴 Bearish: 37% 😣 (Yen safe-haven demand on tariff risks)
⚪ Neutral: 10% 🤔
Institutional Traders:
🟢 Bullish: 46% 💼 (Commodity demand, risk-on flows)
🔴 Bearish: 39% ⚠️ (BoJ intervention fears, US yields)
⚪ Neutral: 15% 🧐
📰 Market Buzz (May 12, 2025)
- US-China trade progress lifts risk appetite, pushing AUD/JPY to 94.50.
- Easing tariff concerns weaken JPY safe-haven appeal.
- Japan’s soft consumer spending data pressures JPY.
📡 Risk Navigation ⚡
Markets can be wild—tread carefully:
- Avoid new trades during major news (RBA, BoJ, US CPI).
- Use trailing stops to protect profits and cap losses.
- Watch for BoJ moves if JPY weakens sharply! 🌪️
💸 Real-Time Market Data (May 12, 2025, UTC+1)
- Forex: AUD/JPY at 94.50, up 0.5% daily (source: Financial Juice).
- Commodities CFD: Gold (XAU/USD) at 2,650, up 0.2%; Iron Ore at 105.50, flat.
- Metals: Silver (XAG/USD) at 31.820, down 1.3%.
- Energies: WTI Crude Oil at 78.40, up 0.6%.
- Crypto: BTC/USD at 62,300, down 0.5%.
- Indices: Nikkei 225 at 39,200, up 0.7%; ASX 200 at 7,850, up 0.4%.
🚀 Join the Stellar Navigator Squad!
Smash the Boost Button to supercharge our Stellar Navigator Strategy and make this safari epic! 🌟 Every boost empowers our crew to dominate the markets. Let’s conquer AUD/JPY together! 🤝
Stay glued to your charts, keep alerts active, and vibe high. See you in the profits, adventurers! 🤑🎉
#StellarNavigator #AUDJPY #AussieYen #TradingView #ChaseThePips

AUD/JPY For Bullish as pull-backyou can go long now
or
wait for pull-back near by entry point and then go long
general trend is down trend
current phase is pull-back
have fun :)

HTF 50EMA POWER PLAY - AUDJPY SHORT FORECAST Q2 W21 D23 Y25AUDJPY SHORT FORECAST Q2 W21 D23 Y25
HTF 50EMA POWER PLAY
BE SMART- AWAIT A BREAK OF STRUCTURE FIRST!
Professional Risk Managers👋
Welcome back to another FRGNT chart update📈
Diving into some Forex setups using predominantly higher time frame order blocks alongside confirmation breaks of structure.
Let’s see what price action is telling us today!
💡Here are some trade confluences📝
✅4H Order Block
✅Tokyo ranges to be filled
✅15' order block identified
✅4H 50EMA
✅Daily 50 EMA
🔑 Remember, to participate in trading comes always with a degree of risk, therefore as professional risk managers it remains vital that we stick to our risk management plan as well as our trading strategies.
📈The rest, we leave to the balance of probabilities.
💡Fail to plan. Plan to fail.
🏆It has always been that simple.
❤️Good luck with your trading journey, I shall see you at the very top.
🎯Trade consistent, FRGNT X

AUDJPYAUD/JPY Bond Yield Differential and Carry Trade Analysis ,the current interest rate differential
Bond price will be watched as carry are looking for directional bias on a cautious note .
Australia 10-year bond yield: drops from 4.5 % to 4.391 a drop today
Japan 10-year bond yield: 1.53%
Interest rate differential: 3.00% (AUD yield − JPY yield)
Carry Trade Mechanics
The AUD/JPY carry trade involves borrowing low-yielding Japanese yen (JPY) to invest in higher-yielding Australian dollar (AUD) assets, profiting from the 3% yield spread. For example:
Borrow ¥15 million at 0.1% (JPY rate) and convert to AUD.
Invest in Australian bonds or deposits yielding 4.53%.
Annual profit: ~3% (minus transaction costs and currency fluctuations).
Key Drivers and Risks
Opportunities
Yield Advantage: The 3% differential offers steady returns in low-volatility conditions.
AUD Resilience: Improved global trade sentiment (e.g., US-China tariff reductions ) supports AUD demand.
BoJ Policy: Japan’s gradual monetary tightening (10-year JGB yield at 1.53%, up from 0.99% in 2024 ) has not yet erased the yield gap.
Risks
RBA Rate Cuts: The Reserve Bank of Australia recently cut rates to 3.85% , which could pressure AUD yields downward.
JPY Appreciation: BoJ’s hawkish tilt and safe-haven demand during market stress could strengthen JPY, eroding carry profits.
Currency Volatility: AUD/JPY has faced downward pressure, trading near 93.00 in May 2025 . A 5% JPY rally could wipe out the annual interest gain.
Strategic Considerations for Traders
Factor Impact on Carry Trade
Yield Spread 3% provides baseline return
AUD/JPY Stability Critical to preserving capital
Central Bank Policies Monitor RBA/BoJ for rate changes
Global Trade Dynamics US-China tensions affect AUD
Historical Performance and Outlook
In 2024, similar yield spreads generated 4–5% annual returns for AUD/JPY carry trades .
Forecasts suggest the spread may narrow slightly if the RBA continues easing, but remains attractive compared to other pairs like USD/JPY (4.25% vs. 0.1% ).
Conclusion
The AUD/JPY carry trade remains viable in May 2025, leveraging a 3% yield differential. However, traders must hedge against JPY strength and monitor RBA/BoJ policy shifts. While the strategy offers steady returns in stable markets, currency volatility and central bank actions pose significant risks.
#forex #audjpy

AUDJPY BULLISHTechnically:
AUDJPY is printing bullish divergene.
AUDJPY break bearish trendline and retest as support.
AUDJPY is 0.38 fib retracement on daily timeframe

AUD/JPYLiquidity Sweep could be in the making. Great area to buy after the longs stop losses have been triggered. Expect price to come back into range.

AUDJPY Retest Watch for 95AUDJPY has successfully broken out of a long-standing descending trendline on the daily timeframe, signaling a potential trend reversal after a prolonged bearish phase. This breakout was followed by a classic retest, where price pulled back to validate the previous resistance line now acting as new support.
Key Technical Observations:
The trendline, connecting multiple swing highs since late 2023, has been clearly violated to the upside.
A minor consolidation followed the breakout, which now appears to be testing the broken trendline.
The pair is forming higher lows, suggesting bullish intent and buyer interest on the retest.
Bullish Scenario:
Entry Zone: Around 92.00–92.50, during or after the retest confirmation.
Target 1: 95.00 (previous swing high)
Target 2: 96.68 (Fibonacci extension and prior horizontal resistance)
Target 3: 101.37 (major resistance from late 2023)
Stop Loss: Below 91.20 or under the retest low (safe zone: around 90.80).
Alternative (Bearish) Scenario:
If the price fails to hold above the broken trendline and closes below 91.00, the breakout could be a false move.
In that case, downside pressure may push the price back toward 88.14 support.
Technical Context:
This setup is based on trendline breakout and retest, where a break and successful retest of a long-term descending trendline often leads to a bullish continuation. In essence, the structure of the chart reflects a potential trend reversal.

AUDJPY Wave Analysis – 21 May 2025
- AUDJPY reversed from key resistance level 95.30
- Likely to fall to support level 92.00
AUDJPY currency pair recently reversed down from the key resistance level 95.30 (which has been reversing the price from the middle of March).
The downward reversal from the resistance level 95.30 started the active intermediate correction (B).
Given the strength of the resistance level 95.30 and clear daily downtrend, AUDJPY currency pair can be expected to fall to the next support level 92.00.

AUDJPY Massive Long! BUY!
My dear friends,
AUDJPY looks like it will make a good move, and here are the details:
The market is trading on 92.666 pivot level.
Bias - Bullish
Technical Indicators: Supper Trend generates a clear long signal while Pivot Point HL is currently determining the overall Bullish trend of the market.
Goal - 93.784
Recommended Stop Loss - 92.004
About Used Indicators:
Pivot points are a great way to identify areas of support and resistance, but they work best when combined with other kinds of technical analysis
Disclosure: I am part of Trade Nation's Influencer program and receive a monthly fee for using their TradingView charts in my analysis.
———————————
WISH YOU ALL LUCK

AUDJPY higher bearish for expect
OANDA:AUDJPY interesting structure, trend line is breaked and we can see bearish flag also is breaked.
Currently here expecting to see higher fall.
SUP zone: 93.600
RES zone: 91.500, 90.600

AUD/JPY Bearish setupHi Traders.
HnS Pattern
Breakout from chanel
Bearish continuation Pattern
Wait for the breakout from the bearish correction to confirm this setup

AUDJPY at Key Resistance Level: Will it Drop To 92.850?OANDA:AUDJPY is approaching a key resistance level that has previously acted as a strong barrier, triggering bearish momentum in the past. Given its historical significance, how price reacts here could set the tone for the next move.
If bearish signals emerge, such as rejection wicks, bearish candlestick patterns, or signs of weakening bullish pressure, I anticipate a move toward the 92.850 level. However, a clear breakout above this resistance could challenge the bearish outlook and open the door for further upside. It's a pivotal area where price action will likely provide clearer clues on the next direction.
Just my take on support and resistance zones, not financial advice. Always confirm your setups and trade with a proper risk management.
Best of luck!

AUDJPY Technical & Order Flow AnalysisOur analysis is based on multi-timeframe top-down analysis & fundamental analysis.
Based on our view the price will fall to the monthly level.
DISCLAIMER: This analysis can change anytime without notice and is only for assisting traders in making independent investment decisions. Please note that this is a prediction, and I have no reason to act on it, and neither should you.
Please support our analysis with a boost or comment!

Potential bearish drop?AUD/JPY has rejected off the resistance level which is a pullbac resistance and could drop from this level to our take profit.
Entry: 93.33
Why we like it:
There is a pullback resistance leel.
Stop loss: 94.70
Why we like it:
There is a pullback resistance level that i slightly above the 61.8% Fibonacci retracement.
Take profit: 91.04
Why we like it:
There is an overlap support level that lines up with the 50% Fibonacci retracement.
Enjoying your TradingView experience? Review us!
Please be advised that the information presented on TradingView is provided to Vantage (‘Vantage Global Limited’, ‘we’) by a third-party provider (‘Everest Fortune Group’). Please be reminded that you are solely responsible for the trading decisions on your account. There is a very high degree of risk involved in trading. Any information and/or content is intended entirely for research, educational and informational purposes only and does not constitute investment or consultation advice or investment strategy. The information is not tailored to the investment needs of any specific person and therefore does not involve a consideration of any of the investment objectives, financial situation or needs of any viewer that may receive it. Kindly also note that past performance is not a reliable indicator of future results. Actual results may differ materially from those anticipated in forward-looking or past performance statements. We assume no liability as to the accuracy or completeness of any of the information and/or content provided herein and the Company cannot be held responsible for any omission, mistake nor for any loss or damage including without limitation to any loss of profit which may arise from reliance on any information supplied by Everest Fortune Group.
