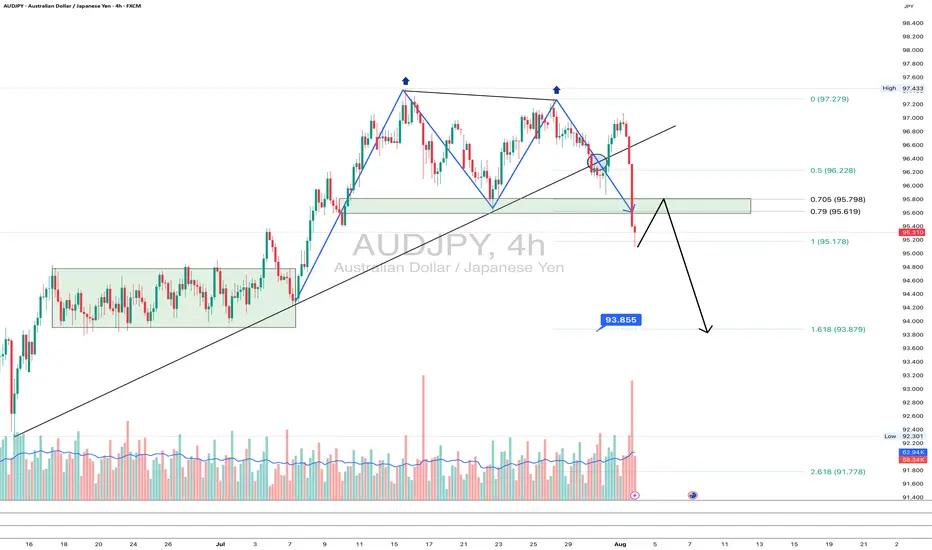
AUDJPY: goodbye uptrend?On the 4H chart, AUDJPY has printed a textbook double top pattern, breaking the rising trendline and diving below the 95.6–95.78 support zone - now acting as resistance. The pair is currently retesting this zone from below, which often provides a clean re-entry point for bears.
This area also aligns with the 0.705–0.79 Fibonacci retracement, reinforcing it as a key resistance. If the price rejects this zone, the next target is 93.85 (1.618 Fibo projection), followed by 93.25 and potentially 91.71 if momentum strengthens.
Fundamentally, the yen gains strength on risk-off flows and diverging rate expectations, while the Australian dollar is pressured by falling commodity prices and a likely pause from the RBA. This widens the rate differential and weakens AUD.
As long as price remains below 95.78, sellers are in control. Watch for a rejection from this retest zone.
JPYAUD trade ideas
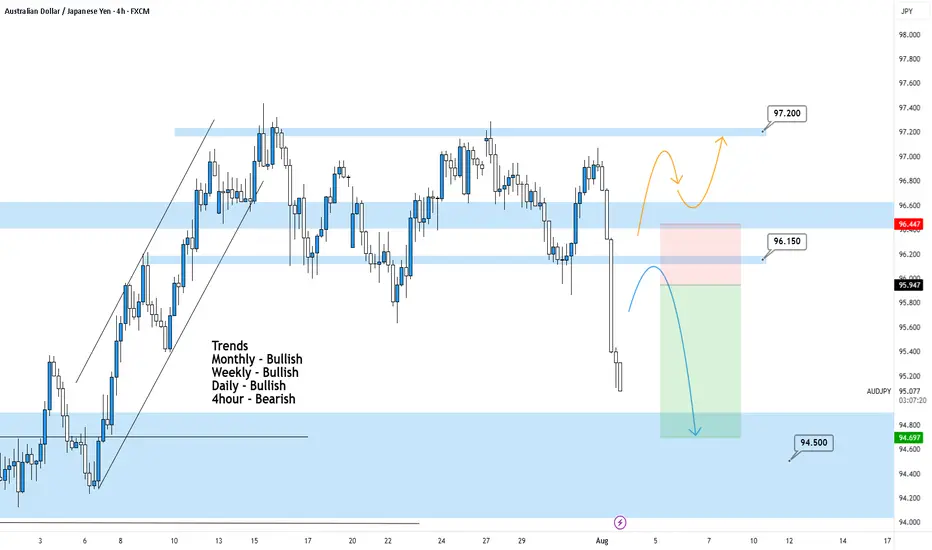
AUDJPY 4Hour TF - August 3rd,2025🟦 AUDJPY 4H Analysis Bearish Idea
📅 August 3rd, 2025
🔹 Top-Down Trend Bias:
• Monthly – Bullish
• Weekly – Bullish
• Daily – Bullish
• 4H – Bearish
AUDJPY has broken cleanly below prior structure around 96.15, signaling short term bearish momentum within a higher timeframe bullish environment. Price is currently approaching key decision zones.
🔍 Key Zone: 96.15 – 96.45
This former support zone may now act as a bearish retest area and new resistance. This offers a potential entry for continuation plays if structure holds below.
✅ Scenario A: Bearish Continuation (Blue Path)
1.If price retests and rejects from 96.15–96.45
2.Look for bearish confirmation (rejection wicks, engulfing, LTF structure shift)
Target: 94.50
This setup is trend aligned with current 4H momentum and offers a clean structure based downside.
⚠️ Scenario B: Bullish Reclaim (Orange Path)
1.If price breaks and holds above 96.45
2.Could signal a shift back toward higher timeframe bullish continuation
Target: 97.20 resistance zone
This is a counter-trend idea on the 4H and requires confirmation
🧠 Final Notes
• Short-term bearish bias while price remains below 96.45
• Let the retest confirm the direction
• Clean structure = clean setups
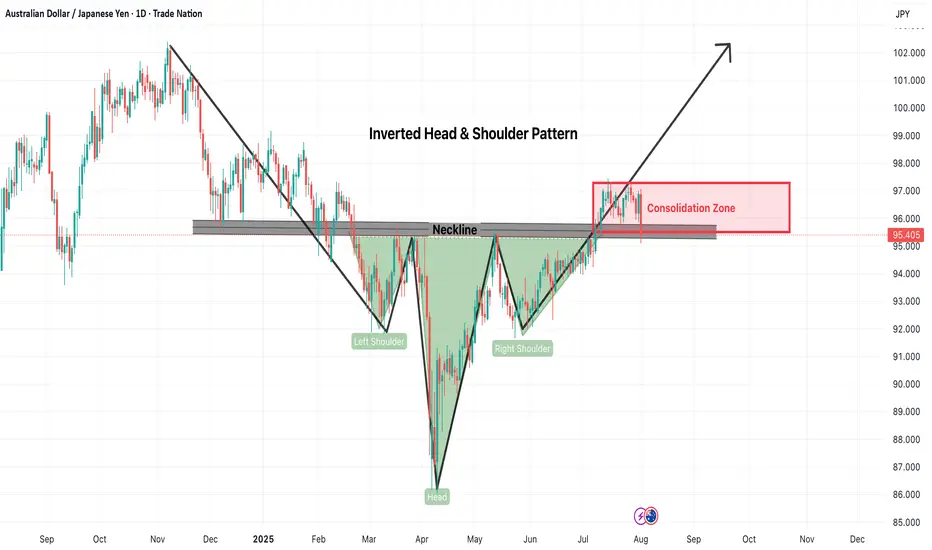
AUDJPY-Inverted Head & Shoulders Pattern at Reversal levelThe AUDJPY pair has formed a classic Inverted Head and Shoulders pattern, typically a strong bullish reversal signal. As seen on the daily chart, the left shoulder, head, and right shoulder have all developed with a clearly defined neckline near the 95.80–96.00 zone. Price action recently broke above this neckline but has since entered a consolidation phase between 95.00–97.00.
Bullish Scenario (Breakout Confirmation)
If AUDJPY decisively breaks above the 97.00 resistance with strong bullish momentum and volume, the inverted head and shoulders pattern will be fully confirmed. In this case, traders can expect an upward continuation toward:
Short-term Target: 99.00
Medium-term Target: 101.00
Measured Move Target: ~102.00 based on pattern height
Risk:
False breakout followed by quick pullback under neckline
Sudden JPY strength due to geopolitical or fundamental news
AUD weakness due to interest rate decisions or economic data
Sideways/Neutral Scenario (Extended Consolidation)
Another possibility is that AUDJPY continues to range between 95.00–97.00 for an extended period without a decisive breakout. This may happen if the market awaits more macroeconomic cues or central bank guidance.
Risk:
Whipsaws and fakeouts within the range
Frustration due to lack of clear direction
Risk Management Tips:
Wait for confirmation: Only trade post breakout or breakdown with candle close above 97.00 or below 95.00
Use tight stop-loss: Keep stops just below support or above resistance zones
Position sizing: Avoid overleveraging in rangebound conditions
Diversify exposure: Don’t put all capital into one trade setup
Conclusion:
AUDJPY is at a critical decision point. The inverted head and shoulders structure is bullish in nature, but the current consolidation adds uncertainty. Traders should stay alert for either a breakout for trend continuation or a breakdown invalidating the setup. Use proper risk management in all cases.
=================================================================
Disclosure: I am part of Trade Nation's Influencer program and receive a monthly fee for using their TradingView charts in my analysis.
=================================================================
AUD/JPY LONG AUD/JPY LONG " break of a resistance area and retest it + 38.2% fib retracement + 50 and 200 ema dynamic support + risk on environment "

AUDJPY; Heikin Ashi Trade Idea📈 Hey Traders!
Here’s a fresh outlook from my trading desk. If you’ve been following me for a while, you already know my approach:
🧩 I trade Supply & Demand zones using Heikin Ashi chart on the 4H timeframe.
🧠 I keep it mechanical and clean — no messy charts, no guessing games.
❌ No trendlines, no fixed sessions, no patterns, no indicator overload.
❌ No overanalyzing market structure or imbalances.
❌ No scalping, and no need to be glued to the screen.
✅ I trade exclusively with limit orders, so it’s more of a set-and-forget style.
✅ This means more freedom, less screen time, and a focus on quality setups.
✅ Just a simplified, structured plan and a calm mindset.
💬 Let’s Talk:
💡Do you trade supply & demand too ?
💡What’s your go-to timeframe ?
💡Ever tried Heikin Ashi ?
📩 Got questions about my strategy or setup? Drop them below — ask me anything, I’m here to share.
Let’s grow together and keep it simple. 👊

AUDJPY Bullish Continuation Key Support and Resistance Levels
Resistance Level 1: 97.527
Resistance Level 2: 98.091
Resistance Level 3: 99.00
Support Level 1: 96.00
Support Level 2: 95.574
Support Level 3: 95.060
This communication is for informational purposes only and should not be viewed as any form of recommendation as to a particular course of action or as investment advice. It is not intended as an offer or solicitation for the purchase or sale of any financial instrument or as an official confirmation of any transaction. Opinions, estimates and assumptions expressed herein are made as of the date of this communication and are subject to change without notice. This communication has been prepared based upon information, including market prices, data and other information, believed to be reliable; however, Trade Nation does not warrant its completeness or accuracy. All market prices and market data contained in or attached to this communication are indicative and subject to change without notice.

AUD/JPY POSSIBLE SETUPThis pair has made a clean 3-leg pullback into a solid resistance zone.
Price action is now near the 50 EMA — a key area we watch closely.
From here, we’re waiting for confirmation:
✅ Strong volume
✅ Aligned momentum
✅ A clear engulfing candle
If all of that lines up, we’ll drop to the 1-hour chart and look for a precise entry trigger using the VMS strategy.
Patience first. Execution second.
Let the setup come to you.

AUD/JPY bulls eye 99, 100The yen is broadly weaker, which is even allowing a weaker Australian dollar to rise. And with a decent bullish trend on the daily chart, I am now seeking dips within a recent consolidation range in anticipation of a move to 99 or even 100.
Matt Simpson, Market Analyst at City Index and Forex.com

AUDJPY Poised to Start a Distribution Phase to 98.70AUDJPY Poised to Start a Distribution Phase to 98.70
On the 60-minute chart, AUDJPY has completed the accumulation phase, and it appears that AUDJPY is preparing for a breakout phase.
This is happening on the 60-minute chart.
The price that has already formed a pattern has a lower form and chances are that it may fall further from this area.
If this happens, AUDJPY may start another impulsive downward move.
In the overall picture, AUDJPY faced a strong resistance near 97.30 and is indicating a downward move to 95.70.
You may find more details in the chart!
Thank you and Good Luck!
PS: Please support with a like or comment if you find this analysis useful for your trading day
Disclosure: I am part of Trade Nation's Influencer program and receive a monthly fee for using their TradingView charts in my analysis.

Trendline BreakThe price has broken out of a bullish trendline, followed by a pullback and now the price looks to make a lower low and go short
WE ONLY TRADE PULLBACKS


AUD/JPY Approaches Monthly HighAUD/JPY climbs to a fresh weekly high (96.84) as it carves a series of higher highs and lows, and a breach above the monthly high (97.07) may lead to a test of the July high (97.43).
Need a move/close above the 97.90 (23.6% Fibonacci extension) to 98.30 (38.2% Fibonacci retracement) zone to bring the January high (99.17) on the radar, with the next area of interest coming in around 100.90 (38.2% Fibonacci extension).
However, AUD/JPY may give back the rebound from the monthly low (94.91) should it snap the bullish price series, with a close below the 95.10 (38.2% Fibonacci extension) to 95.20 (23.6% Fibonacci extension) region bringing the July low (93.97) on the radar.
--- Written by David Song, Senior Strategist at FOREX.com

Bullish bounce off pullback support?AUD/JPY has bounced off the support level which is a pullback support and could bounce from this level to our take profit.
Entry: 96.14
Why we like it:
There is a pullback support.
Stop loss: 95.04
Why we like it:
There is a swing low support.
Take profit: 97.22
Why we like it:
There is a multi swing high resistance.
Enjoying your TradingView experience? Review us!
Please be advised that the information presented on TradingView is provided to Vantage (‘Vantage Global Limited’, ‘we’) by a third-party provider (‘Everest Fortune Group’). Please be reminded that you are solely responsible for the trading decisions on your account. There is a very high degree of risk involved in trading. Any information and/or content is intended entirely for research, educational and informational purposes only and does not constitute investment or consultation advice or investment strategy. The information is not tailored to the investment needs of any specific person and therefore does not involve a consideration of any of the investment objectives, financial situation or needs of any viewer that may receive it. Kindly also note that past performance is not a reliable indicator of future results. Actual results may differ materially from those anticipated in forward-looking or past performance statements. We assume no liability as to the accuracy or completeness of any of the information and/or content provided herein and the Company cannot be held responsible for any omission, mistake nor for any loss or damage including without limitation to any loss of profit which may arise from reliance on any information supplied by Everest Fortune Group.

AUD/JPY Breakout Loading – Bullish Flag Signals Next Big Move!Pair: AUD/JPY – TF: 1H
Trend: Bullish
Divergence: NIL
Pattern: Bullish Flag
Harmonics: NIL
BIAS: Bullish
Strategy: Buy STOP Entry at Breakout of HH
Entry: Buy Stop @ 96.56
Stop Loss (SL): 95.95
Take Profit (TP1): 97.17
Lot Size: 0.23
Risk:Reward: 1:1
Risk: $100 | Reward: $100
🔹 Technical Outlook:
The bullish flag pattern is forming after a strong upward impulse.
Alligator indicator shows a wide-open mouth—indicating strong momentum.
Higher timeframe (4H) also confirms bullish bias.
Breakout of the recent Higher High (HH) expected to trigger further upside.
🔹 Fundamental Snapshot:
Australia’s retail sales rose 1.2% in June, beating forecasts, signaling consumer demand strength and adding support to the AUD.
Bank of Japan maintained its interest rate at 0.40%–0.50%, keeping monetary policy loose.
Rising Japanese Government Bond (JGB) yields to 1.6% (highest since 2008) may offer some Yen support, but technicals still favor AUD/JPY upside in the short term.
💬 Plan: Execute Buy Stop above HH for continuation of bullish move, aligned with both technical patterns and supportive macro backdrop.
📌 Note: Always manage your risk according to your capital and strategy.
#AUDJPY #Forex #PriceAction #TechnicalAnalysis #BullishFlag #AlligatorIndicator #BreakoutTrading #SwingTrading #DayTrading #FXMarket #JPY #AUD #TraderLife #ForexSignals #TradeSetup #ChartAnalysis #H1Timeframe #TradingView

AUD/JPY SENDS CLEAR BEARISH SIGNALS|SHORT
Hello, Friends!
AUD/JPY pair is in the uptrend because previous week’s candle is green, while the price is clearly rising on the 4H timeframe. And after the retest of the resistance line above I believe we will see a move down towards the target below at 96.380 because the pair overbought due to its proximity to the upper BB band and a bearish correction is likely.
Disclosure: I am part of Trade Nation's Influencer program and receive a monthly fee for using their TradingView charts in my analysis.
✅LIKE AND COMMENT MY IDEAS✅

AUD/JPY LONG FROM SUPPORT
Hello, Friends!
The BB lower band is nearby so AUD-JPY is in the oversold territory. Thus, despite the downtrend on the 1W timeframe I think that we will see a bullish reaction from the support line below and a move up towards the target at around 96.130.
Disclosure: I am part of Trade Nation's Influencer program and receive a monthly fee for using their TradingView charts in my analysis.
✅LIKE AND COMMENT MY IDEAS✅


AUDJPY 4Hour TF - August 10th,2025🟦 AUDJPY 4H Analysis
📅 August 10, 2025
Top-Down Trend Bias:
• Monthly – Bullish
• Weekly – Bullish
• Daily – Bullish
• 4H – Bearish
AUDJPY pushed above 96.15 resistance zone after a short term bullish correction. Higher timeframes remain bullish, but the 4H could still show signs of further bearish movement.
🔍 Key Zone: 96.15
This zone has acted as support and resistance in the past and will be the deciding area for the next directional move.
✅ Scenario A: Bullish Breakout (Blue Path)
1.If price holds above 96.150 area
2.Look for continuation into 97.20 support
This would align with the higher timeframe bullish bias
⚠️ Scenario B: Bearish Rejection (Orange Path)
1.If price breaks and holds below 96.150
2.Watch for bearish confirmation (engulfing, LTF BOS, rejection wicks)
Target: 94.50 support zone
This would maintain the current 4H bearish structure despite the bullish HTF backdrop.
🧠 Final Notes
• 96.15 is the short term decision point for both buyers and sellers
• HTFs favor longs, but sellers may control the 4H
• Confirmation at the zone is key before taking either direction

Long ideaBeautiful setup with such nice price action but News next week RBA Rate statement!
50 day moving average, bounce on round 95,000 level nice 45 ° trendline .
That is 3 confluences in my book.

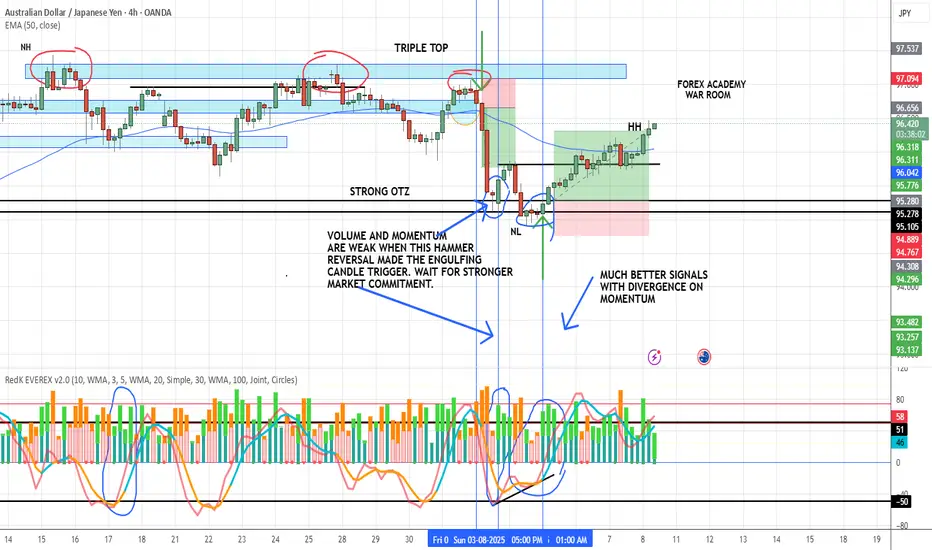
Why the VMS Strategy Works – A Live Example using AUDJPY 4HHere’s a perfect example of why following the rules matters.
The first setup was a strong hammer reversal right after an impulsive move to the downside (which we also traded). We got a clean engulfing candle and volume was decent…
But — both momentum lines must be hooking in our favor for confirmation. In this case, one was and one was not.
Daily chart was also in a downtrend but hitting support
So not bad, but not great
✅ Discipline says: Pass.
The very next day, we got a better setup:
All VMS rules met (Volume, Momentum, Structure)
Bonus: Momentum divergence in our favor
That’s the power of combining volume and momentum with structure — it filters out the “almost” trades and keeps us focused on the high-probability setups.
Disclaimer: This is for educational purposes only — not financial advice. Always do your own research, practice extensively, and use proper risk management before trading live.
AUDJPY SELLAUDJPY SELL
trend Line is brake.
lower lower is accepted.
I think this is good for today may be it will be profitable for next week.
have a good weeked.

AUDJPY SELL SETUP SHOOOOOOOOOOOOOORTTHE Price now on resistance level
and it shaped head and shoulder on time frame 2H and take inducement so i expect shoort

AUDJPY Key tarding level retest at 96.00Key Support and Resistance Levels
Resistance Level 1: 97.527
Resistance Level 2: 98.091
Resistance Level 3: 99.00
Support Level 1: 96.00
Support Level 2: 95.574
Support Level 3: 95.060
This communication is for informational purposes only and should not be viewed as any form of recommendation as to a particular course of action or as investment advice. It is not intended as an offer or solicitation for the purchase or sale of any financial instrument or as an official confirmation of any transaction. Opinions, estimates and assumptions expressed herein are made as of the date of this communication and are subject to change without notice. This communication has been prepared based upon information, including market prices, data and other information, believed to be reliable; however, Trade Nation does not warrant its completeness or accuracy. All market prices and market data contained in or attached to this communication are indicative and subject to change without notice.
