JPYAUD trade ideas

Sell AUDJPYAUDJPY buy will quickly turn around and start shorting in the next few hours. Price will test the support at 94,342 soon. Price was already on a downtrend, yesterday we saw a bullish retracement to trigger sell orders.

AUD/JPY – 4H Technical & Fundamental AnalysisAUD/JPY – 4H Technical & Fundamental Analysis
AUD/JPY is currently hovering around the 95.00 psychological level. A decisive break below this level could open further downside potential. The Japanese Yen is gaining traction amid a global risk-off sentiment, acting as a safe-haven currency. Meanwhile, the Australian Dollar is under pressure as speculation grows about potential rate cuts by the Reserve Bank of Australia (RBA).
In addition, AUD is highly correlated with commodities. The recent decline in commodity prices is dampening investor appetite for the Aussie.
From a technical perspective, the pair recently formed a double top near the 97.300 resistance zone, signaling a potential trend reversal. Price then broke below a major support level at 95.500, followed by a period of accumulation, indicating sellers entering the market.
However, we are still waiting for clear signs of liquidity to form. Our plan is to wait for a liquidity grab near the zone, then execute a Sell Stop strategy once confirmation is present.
🔽 Sell Setup Plan:
Entry (Sell Stop): 95.380
Stop Loss: 96.120
Take Profit: 93.890
We remain cautious but biased toward bearish continuation upon confirmation of liquidity and key level rejection.
📌 Disclaimer:
This is not financial advice. Always wait for proper confirmation before executing trades. Manage risk wisely and trade what you see—not what you feel.

AUDJPY Love Story: One Last Red Candle and I’m GoneWe had a beautiful connection between 97.06 and 95.10 —
our special place, our Sell Range of memories. 💑
But then came a small pullback… from 95.10 to 95.81.
Just when I thought we were falling together, AUDJPY pulled away (retracement) — classic mixed signals. 😢
Now, I’m patiently watching...
If AUDJPY sends me a clear sign — a bearish candle closing below 50EMA —
I’ll know it's real.
No more mind games, no more confusion. I’m in. 💔➡️📉
If it's a strong Marubozu, I’ll give it my full trust — SL just above it.
TP? Back to where it all began… 95.10.
That’s where I’ll let go — and close the chapter. 📘
WHAT IF IT WONT CROSS?
This is day trading setup. While watching 15m candle to bear below 50EMA also I glance 1hr chart. This setup will be valid as long as 1hr chart is still in bearing range.
Wish me luck… and a big bearish Marubozu kiss! 😈📉

AUD/JPY WINAUD/JPY – Triple Top ✅
We posted this potential triple top setup on Thursday, July 31st, and the trigger came during the Friday morning session (August 1st) with a clean engulfing candle.
As soon as we entered, the market dropped hard — a textbook move, and one we don’t see play out this cleanly very often. That’s the power of the VMS strategy when all elements align.
This one hit our 2:1 risk-reward target smoothly and with precision.
Add it to the win column, stay patient, and get ready for the next aligned setup.
“Prepare for the setup. Wait for alignment. Let the market do the rest.”
— War Room Discipline

AUDJPY Will Go Lower! Sell!
Take a look at our analysis for AUDJPY.
Time Frame: 9h
Current Trend: Bearish
Sentiment: Overbought (based on 7-period RSI)
Forecast: Bearish
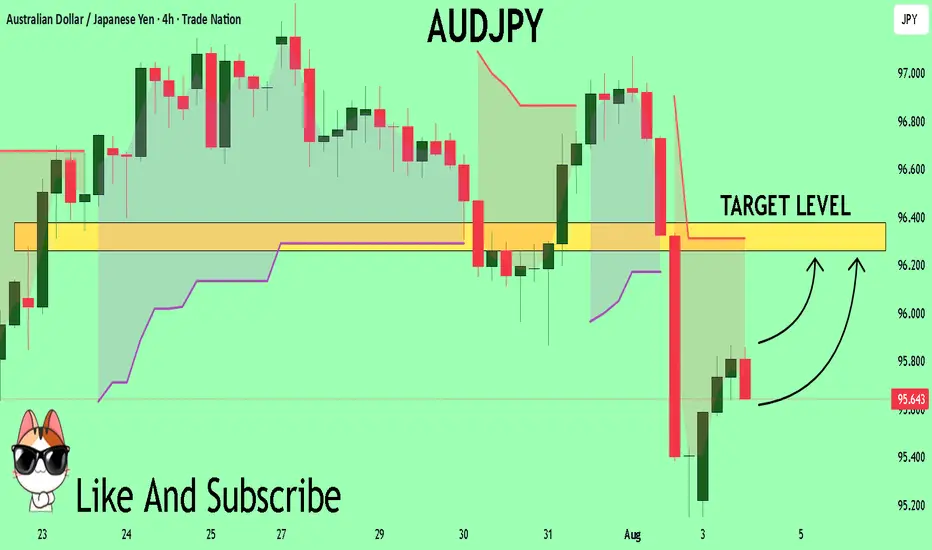
The price is testing a key resistance 96.734.
Taking into consideration the current market trend & overbought RSI, chances will be high to see a bearish movement to the downside at least to 96.102 level.
P.S
Overbought describes a period of time where there has been a significant and consistent upward move in price over a period of time without much pullback.
Disclosure: I am part of Trade Nation's Influencer program and receive a monthly fee for using their TradingView charts in my analysis.
Like and subscribe and comment my ideas if you enjoy them!

AUDJPY Set To Grow! BUY!
My dear subscribers,
AUDJPY looks like it will make a good move, and here are the details:
The market is trading on 95.649 pivot level.
Bias - Bullish
Technical Indicators: Both Super Trend & Pivot HL indicate a highly probable Bullish continuation.
Target - 96.260
About Used Indicators:
The average true range (ATR) plays an important role in 'Supertrend' as the indicator uses ATR to calculate its value. The ATR indicator signals the degree of price volatility.
Disclosure: I am part of Trade Nation's Influencer program and receive a monthly fee for using their TradingView charts in my analysis.
———————————
WISH YOU ALL LUCK
AUDJPY ShortAUDJPY is now net short on the regression break.
I am considering all JPY pairs as it appears a market correction may build.

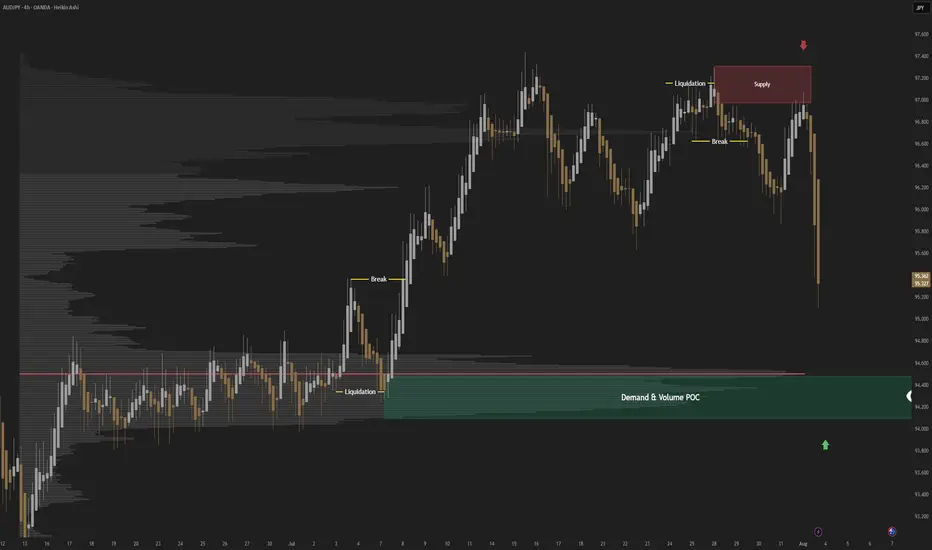
AUDJPY; Heikin Ashi Trade IdeaIn this post, I’ll be sharing my analysis of AUDJPY with my unique Heikin Ashi strategy.Picture tells more than 1000 words, no BS. I highlight key areas where I’m anticipating potential opportunities.
I’m always happy to receive any feedback.
Like, share and comment! ❤️
AUDJPY Technical & Order Flow AnalysisOur analysis is based on a multi-timeframe top-down approach and fundamental analysis.
Based on our assessment, the price is expected to return to the monthly level.
DISCLAIMER: This analysis may change at any time without notice and is solely intended to assist traders in making independent investment decisions. Please note that this is a prediction, and I have no obligation to act on it, nor should you.
Please support our analysis with a boost or comment!
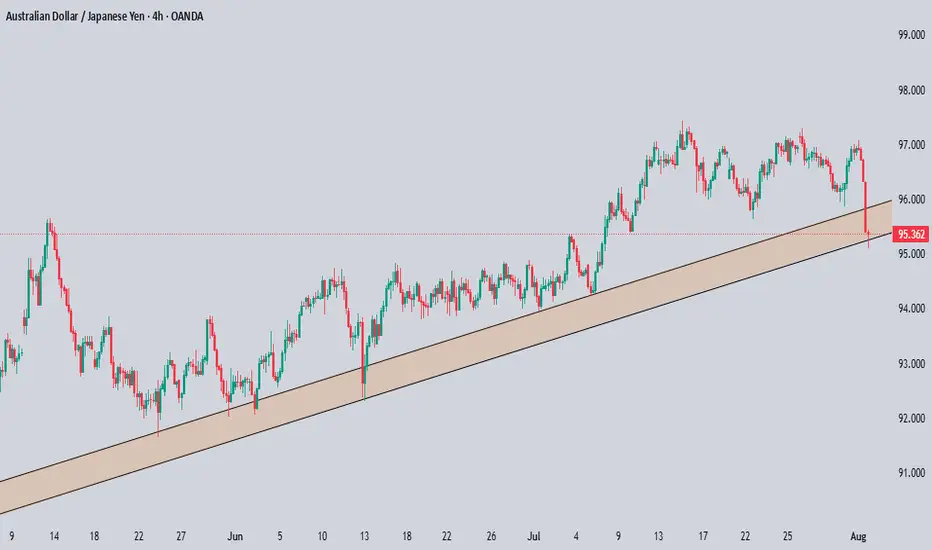

AUD-JPY Bearish Breakout! Sell!
Hello,Traders!
AUD-JPY made a bearish
Breakout of the rising support
Line and we are bearish biased
So we will be expecting a
Further bearish move down
Sell!
Comment and subscribe to help us grow!
Check out other forecasts below too!
Disclosure: I am part of Trade Nation's Influencer program and receive a monthly fee for using their TradingView charts in my analysis.

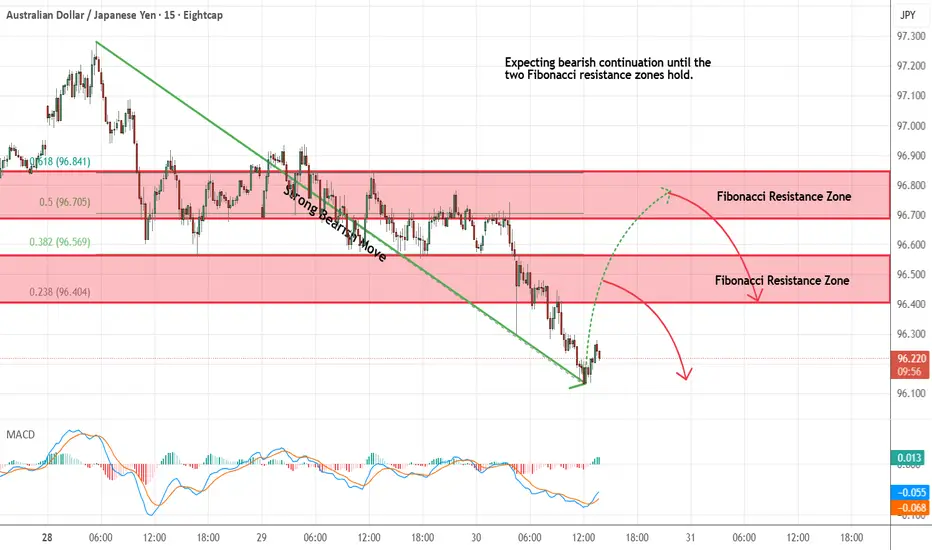
AUDJPY - Looking To Sell Pullbacks In The Short TermM15 - Strong bearish move.
No opposite signs.
Currently it looks like a pullback is happening.
Expecting bearish continuation until the two Fibonacci resistance zones hold.
If you enjoy this idea, don’t forget to LIKE 👍, FOLLOW ✅, SHARE 🙌, and COMMENT ✍! Drop your thoughts and charts below to keep the discussion going. Your support helps keep this content free and reach more people! 🚀
--------------------------------------------------------------------------------------------------------------------
AUDJPY – DAILY FORECAST Q3 | W31 | D30 | Y25
📊 AUDJPY – DAILY FORECAST
Q3 | W31 | D30 | Y25
Daily Forecast 🔍📅
Here’s a short diagnosis of the current chart setup 🧠📈
Higher time frame order blocks have been identified — these are our patient points of interest 🎯🧭.
It’s crucial to wait for a confirmed break of structure 🧱✅ before forming a directional bias.
This keeps us disciplined and aligned with what price action is truly telling us.
📈 Risk Management Protocols
🔑 Core principles:
Max 1% risk per trade
Only execute at pre-identified levels
Use alerts, not emotion
Stick to your RR plan — minimum 1:2
🧠 You’re not paid for how many trades you take, you’re paid for how well you manage risk.
🧠 Weekly FRGNT Insight
"Trade what the market gives, not what your ego wants."
Stay mechanical. Stay focused. Let the probabilities work.
FX:AUDJPY

AUDJPY 24.07.2025+~ RBA is relatively hawkish
+~ Political uncertainty around JPY
+~ Positive trade deals anticipation
*Swing trade; giving a room for a reasonable pullback; will potentially look to scale in at the resolve of a newly-formed structure.
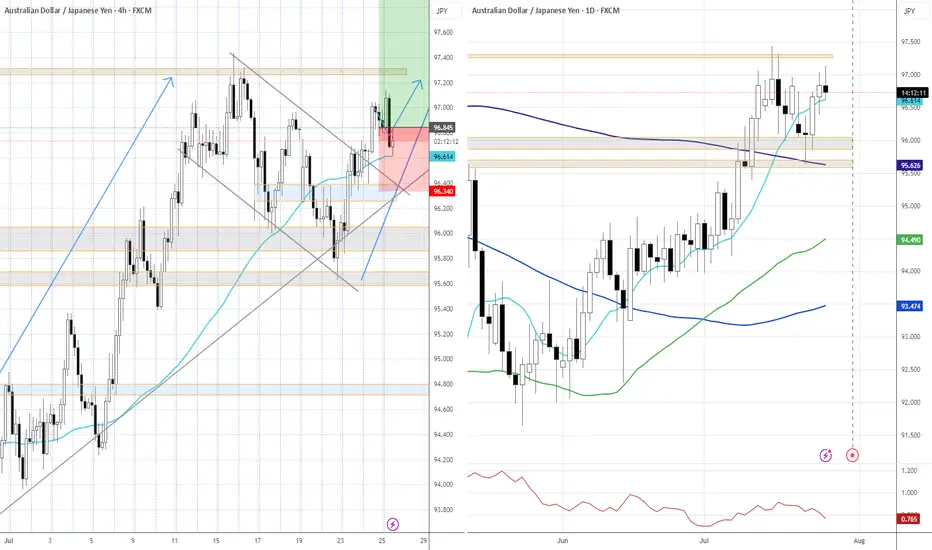
AUD/JPY Poised for Breakout After Liquidity Trap? 🔍 Key Observations:
🔻 Trendline resistance holding strong, forming lower highs.
📉 Sell-side liquidity resting just below horizontal support (marked zone).
💧 Price dipped into liquidity grab zone twice — sign of stop hunt.
🔁 Classic accumulation schematic forming — repeated sweeps before potential breakout.
📊 Volume divergence: Selling pressure weakening while liquidity is swept.
📉 RSI shows bullish divergence (price making lower lows, RSI making higher lows).
🔁 Rejection at RSI 40-level could indicate a bounce.
📈 Expectation:
One more fake breakdown below 96.500 could trigger aggressive buying — setting up a potential parabolic move toward 97.200+ if breakout occurs.

AUDJPY TRADE IDEA UPDATE AUDJPY also made a pullback to our Fibonacci level and has made a move to the upside.

AUDJPY Long TradeOANDA:AUDJPY Long Trade.
Entry price is already tapped in, I checked chart late, TP is intact, you can take little risk if you can afford.
Note: Manage your risk yourself, its risky trade, see how much your can risk yourself on this trade.
Don't be greedy.
Use proper risk management
Looks like good trade.
Lets monitor.
Use proper risk management.
Disclaimer: only idea, not advice

AUDJPY Retest H4 resistance The AUD/JPY currency pair appears poised to potentially extend its current bearish trajectory, particularly as the price action has recently reacted to an unmitigated order block situated around the 97.00 level. This specific price zone could act as a significant area of supply, triggering renewed selling pressure that may drive the pair lower. Should bearish momentum persist, it’s plausible that the price could descend toward the 96.00 region as an initial target. Furthermore, if sellers maintain control and market sentiment remains risk-averse, the downward movement could intensify, possibly resulting in a break below the key support area near 95.500—effectively sweeping liquidity beneath that level and opening the door for even deeper retracements.

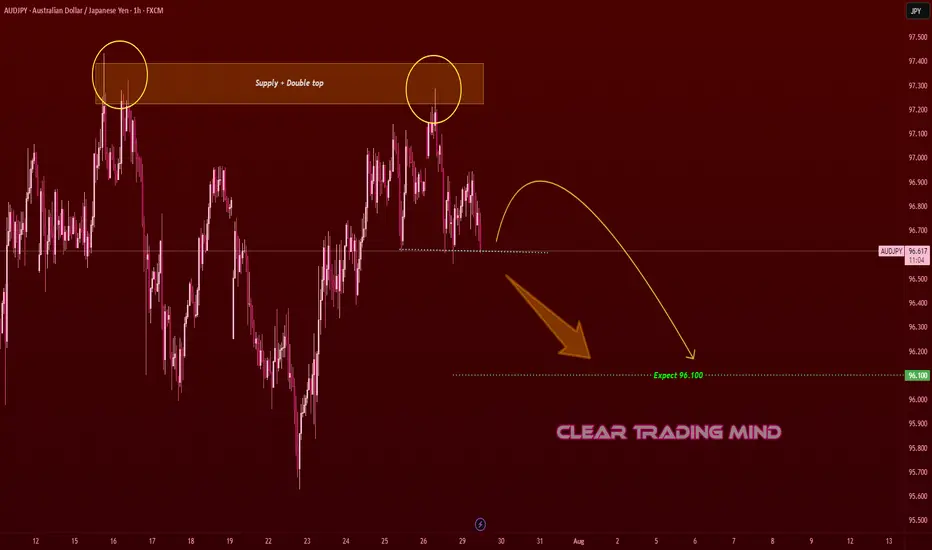
AUDJPY Double Top at Supply Zone – Bearish Move to 96.10?AUDJPY – Bearish Bias
- Pattern: Double Top + Supply Zone Rejection
- Current Price: Around 96.65
- Expected Target: 96.10
- The chart shows a double top pattern near the supply zone, signaling potential weakness.
- Price failed to break above the supply area twice, creating bearish sentiment.
- A pullback towards resistance followed by rejection could trigger a move down to 96.10.
AUD/JPY: Fading the Rally at a Major Resistance ZoneWhile AUD/JPY has been in a clear uptrend, the rally is now approaching a significant technical ceiling where sellers have previously stepped in. We see a compelling opportunity for a counter-trend short, betting that this resistance level will hold and that the current bullish momentum is showing signs of exhaustion.
This trade is for those watching for a market turn, offering a well-defined risk-to-reward setup for a swing position.
🤔 The "Why" Behind the Short Setup
📰 The Fundamental Risk
The Australian Dollar is a "risk-on" currency, meaning it performs well when global markets are optimistic. The Japanese Yen, however, is a classic "safe-haven" asset that strengthens during times of uncertainty. With the upcoming high-impact Australian CPI data, any sign of economic weakness could disappoint the market, increase pressure on the RBA, and trigger a "risk-off" move that would benefit the Yen and send AUD/JPY lower.
📊 The Technical Ceiling
The chart tells a clear story. The price is currently testing a major resistance zone. Attempting to short near a strong ceiling like this provides a strategic entry to capture a potential trend reversal. We are essentially betting that the trend's multi-week momentum will stall and reverse from this key technical juncture.
✅ The High-Clarity SHORT Trade Setup
📉 Pair: AUD/JPY
👉 Direction: Short
⛔️ Entry: 96.716
🎯 Take Profit: 92.080
🛑 Stop Loss: 98.907
Rationale: This setup plays for a significant swing move. The wide stop loss is designed to withstand volatility from news events, while the deep take profit targets a full reversal back to major support levels seen earlier in the year.

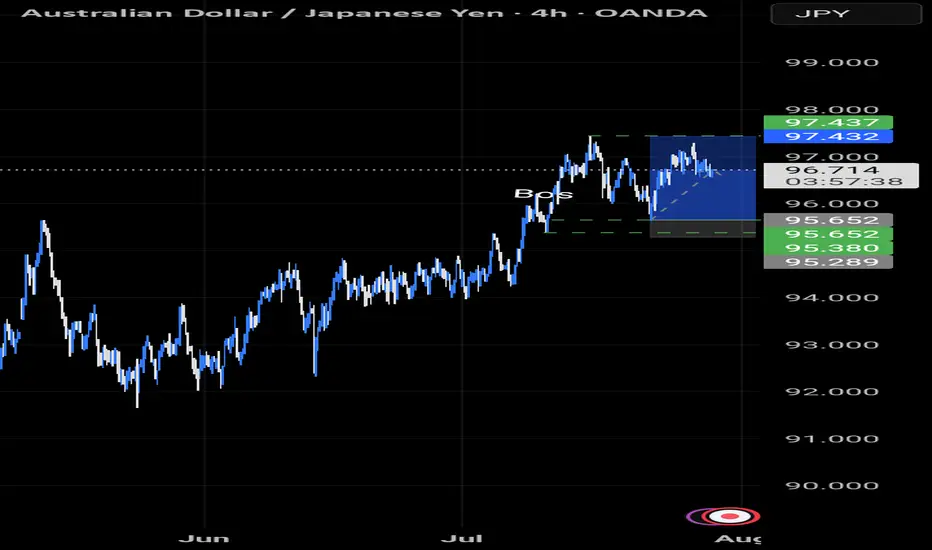
AUDJPY RETEST SUPPORT AUDJPY sweeps liquidity and retests support hopefully it continues the uptrend towards 97.430
