AUD/JPY BEST PLACE TO SELL FROM|SHORT
Hello, Friends!
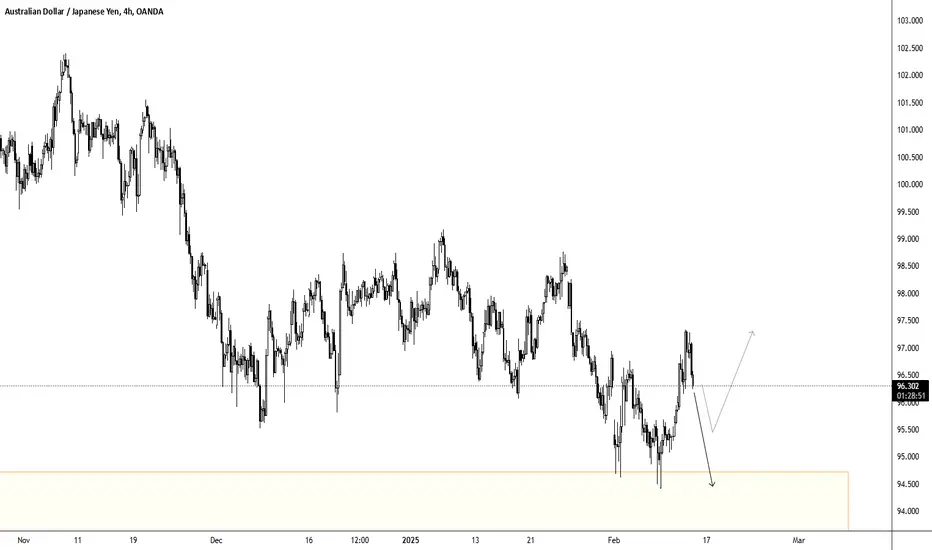
AUD/JPY is trending down which is clear from the red colour of the previous weekly candle. However, the price has locally surged into the overbought territory. Which can be told from its proximity to the BB upper band. Which presents a beautiful trend following opportunity for a short trade from the resistance line above towards the demand level of 94.234.
✅LIKE AND COMMENT MY IDEAS✅
JPYAUD trade ideas


AUDJPY The Week Ahead 17th Feb 25The AUDJPY currency pair price action sentiment appears bearish, supported by the longer-term prevailing downtrend. The recent oversold bounce back is retesting major resistance at 97.30.
The key trading level is at 97.30, which is the current swing high, 50 Day Moving Average and previous support now newly formed resistance. An oversold rally from the current levels and a bearish rejection from the 97.30 level could target the downside support at 94.90 followed by 93.40 and 91.40 levels over the longer timeframe.
Alternatively, a confirmed breakout above 97.30 resistance and a daily close above that level would negate the bearish outlook opening the way for further rallies higher and a retest of 98.50 resistance followed by 100.00 levels.
This communication is for informational purposes only and should not be viewed as any form of recommendation as to a particular course of action or as investment advice. It is not intended as an offer or solicitation for the purchase or sale of any financial instrument or as an official confirmation of any transaction. Opinions, estimates and assumptions expressed herein are made as of the date of this communication and are subject to change without notice. This communication has been prepared based upon information, including market prices, data and other information, believed to be reliable; however, Trade Nation does not warrant its completeness or accuracy. All market prices and market data contained in or attached to this communication are indicative and subject to change without notice.

AUDJPYTHE coming week have line up of economic data print and how it might affect the AUD/JPY trade directional bias .
Upcoming Economic Data:
AUD Cash Rate: Forecast 4.10%, Previous 4.35%
RBA (Reserve Bank of Australia) Monetary Policy Statement
RBA Rate Statement
Analysis:
Cash Rate Cut: The forecast indicates a cut in the AUD cash rate from 4.35% to 4.10%.
A rate cut typically weakens the currency as Lower interest rates makes the currency less attractive to foreign investors seeking higher returns.
RBA Monetary Policy Statement and Rate Statement: These statements provide insights into the RBA's outlook on the economy and future monetary policy decisions.
Hawkish Tone: If the RBA statements suggest that the rate cut is a one-off event and that the central bank remains vigilant about inflation, it could mitigate the negative impact of the rate cut on the AUD.
Dovish Tone: If the RBA statements indicate further rate cuts are likely or express concerns about economic growth, it would likely reinforce the bearish sentiment for the AUD.
Bearish Scenario: If the RBA cuts rates and issues a dovish statement, AUD/JPY is likely to decline. Several technical analyses suggest a bearish outlook for AUD/JPY14. A break of a trendline could signal further bearish moment
Bearish Bias: Given the likelihood of a rate cut and the potential for a dovish RBA statement, the initial bias for AUD/JPY next week is bearish. Look for opportunities to sell AUD/JPY, especially if technical indicators confirm the downtrend.
Monitor RBA Statements: Pay close attention to the RBA's monetary policy statement and rate statement. Any hawkish signals could provide a temporary boost to the AUD, but the overall trend is likely to remain bearish if the rate cut is confirmed.
TRADE WITH CAUTION

AUDJPY retest of previous support at 97.30The AUDJPY currency pair price action sentiment appears bearish, supported by the longer-term prevailing downtrend. The recent oversold bounce back is retesting major resistance at 97.30.
The key trading level is at 97.30, which is the current swing high, 50 Day Moving Average and previous support now newly formed resistance. An oversold rally from the current levels and a bearish rejection from the 97.30 level could target the downside support at 94.90 followed by 93.40 and 91.40 levels over the longer timeframe.
Alternatively, a confirmed breakout above 97.30 resistance and a daily close above that level would negate the bearish outlook opening the way for further rallies higher and a retest of 98.50 resistance followed by 100.00 levels.
This communication is for informational purposes only and should not be viewed as any form of recommendation as to a particular course of action or as investment advice. It is not intended as an offer or solicitation for the purchase or sale of any financial instrument or as an official confirmation of any transaction. Opinions, estimates and assumptions expressed herein are made as of the date of this communication and are subject to change without notice. This communication has been prepared based upon information, including market prices, data and other information, believed to be reliable; however, Trade Nation does not warrant its completeness or accuracy. All market prices and market data contained in or attached to this communication are indicative and subject to change without notice.

AUDJPY The Target Is DOWN! SELL!
My dear friends,
Please, find my technical outlook for AUDJPY below:
The price is coiling around a solid key level - 96.823
Bias - Bearish
Technical Indicators: Pivot Points High anticipates a potential price reversal.
Super trend shows a clear sell, giving a perfect indicators' convergence.
Goal - 96.490
About Used Indicators:
The pivot point itself is simply the average of the high, low and closing prices from the previous trading day.
———————————
WISH YOU ALL LUCK

SELL AUDJPYI will be selling AUDJPY here. I have been waiting for price to retest the resistance once more. Price seems to be rejecting here 96,800. I am targeting 95,900

AUDJPY – Bearish Setup in Play AUDJPY – Bearish Setup in Play
🔴 Short Bias | 🎯 Target: 96.46936 | ⏳ Deadline: Feb 16
Watching for price to push lower towards the 96.46936 target. Price action remains in line with expectations so far.
💡 All trades can be replayed on TradingView for confirmation.
#Forex #AUDJPY #MarketAnalysis #TradingView

Bearish drop?AUD/JPY is rising towards the pivot which acts as a pullback resistance and could drop to the 50% Fibonacci support.
Pivot: 96.53
1st Support: 95.68
1st Resistance: 97.86
Risk Warning:
Trading Forex and CFDs carries a high level of risk to your capital and you should only trade with money you can afford to lose. Trading Forex and CFDs may not be suitable for all investors, so please ensure that you fully understand the risks involved and seek independent advice if necessary.
Disclaimer:
The above opinions given constitute general market commentary, and do not constitute the opinion or advice of IC Markets or any form of personal or investment advice.
Any opinions, news, research, analyses, prices, other information, or links to third-party sites contained on this website are provided on an "as-is" basis, are intended only to be informative, is not an advice nor a recommendation, nor research, or a record of our trading prices, or an offer of, or solicitation for a transaction in any financial instrument and thus should not be treated as such. The information provided does not involve any specific investment objectives, financial situation and needs of any specific person who may receive it. Please be aware, that past performance is not a reliable indicator of future performance and/or results. Past Performance or Forward-looking scenarios based upon the reasonable beliefs of the third-party provider are not a guarantee of future performance. Actual results may differ materially from those anticipated in forward-looking or past performance statements. IC Markets makes no representation or warranty and assumes no liability as to the accuracy or completeness of the information provided, nor any loss arising from any investment based on a recommendation, forecast or any information supplied by any third-party.

Sell ActivatedGod First
Minimum Risk Maximum Reward
Action Backed Believe
# faith, strategy, and execution all in one #

AUDJPY My Opinion! SELL!
My dear followers,
This is my opinion on the AUDJPY next move:
The asset is approaching an important pivot point 96.402
Bias - Bearish
Technical Indicators: Supper Trend generates a clear short signal while Pivot Point HL is currently determining the overall Bearish trend of the market.
Goal - 95.587
About Used Indicators:
For more efficient signals, super-trend is used in combination with other indicators like Pivot Points.
———————————
WISH YOU ALL LUCK

AUDJPY - Deeper pullback or retesting strong support?These are the 2 scenarios that I see for AUDJPY on the 4h timeframe.
Scenario 1 - Deeper Pullback and Continuation:
In this scenario, the price could initially drop further from current levels around 96.24, potentially reaching the 95.50 area, forming a deeper pullback. This move would shake out some weak longs and create a stronger base for the next move up. After this deeper correction, the pair could find strong buying interest and initiate a significant bounce, potentially targeting the recent highs around 98.50-99.00. This scenario would align with the overall consolidation pattern we've seen in recent months.
Scenario 2 - Orange Box Retest:
The alternative scenario shows price moving down to retest the orange box support zone around 94.00. This would represent a more bearish development, as it would mean breaking below the recent swing lows. The orange box appears to be a significant support area, and reaching this level could trigger one of two responses: either a strong bounce from this major support zone, or if the support breaks, it could lead to a more substantial decline. The reaction at this zone would be crucial for determining the pair's medium-term direction.
Both scenarios suggest some downside in the near term, with the key difference being the depth of the pullback and the subsequent reaction at these lower levels.
AUDJPY Short Term Buy IdeaH1 - Bullish trend pattern
Currently it looks like a pullback is happening
Until the strong support zone holds I expect the price to move higher further after pullbacks.

AUDJPY longWe join the market at the current rate. we are in a good fib zone. hoping to buy till the end of the fib

AUDJPY: Confirmed CHoCH & Bullish OutlookI have observed a confirmed Change of Character on 📈AUDJPY on a 4-hour chart.
Despite the overall bearish trend in the market, the price has managed to break through a minor bearish trend and a key horizontal resistance level.
This suggests that the market is likely to continue moving upwards.
The next resistance level to watch for is at 97.77.

Bullish bounce?AUD/JPY is falling towards the pivot and could bounce to the 1st resistance.
Pivot: 96.54
1st Support: 95.68
1st Resistance: 97.86
Risk Warning:
Trading Forex and CFDs carries a high level of risk to your capital and you should only trade with money you can afford to lose. Trading Forex and CFDs may not be suitable for all investors, so please ensure that you fully understand the risks involved and seek independent advice if necessary.
Disclaimer:
The above opinions given constitute general market commentary, and do not constitute the opinion or advice of IC Markets or any form of personal or investment advice.
Any opinions, news, research, analyses, prices, other information, or links to third-party sites contained on this website are provided on an "as-is" basis, are intended only to be informative, is not an advice nor a recommendation, nor research, or a record of our trading prices, or an offer of, or solicitation for a transaction in any financial instrument and thus should not be treated as such. The information provided does not involve any specific investment objectives, financial situation and needs of any specific person who may receive it. Please be aware, that past performance is not a reliable indicator of future performance and/or results. Past Performance or Forward-looking scenarios based upon the reasonable beliefs of the third-party provider are not a guarantee of future performance. Actual results may differ materially from those anticipated in forward-looking or past performance statements. IC Markets makes no representation or warranty and assumes no liability as to the accuracy or completeness of the information provided, nor any loss arising from any investment based on a recommendation, forecast or any information supplied by any third-party.

Another Shot at Breaking the Downtrend—Will This One Stick?AUD/JPY is making another attempt to break downtrend resistance dating back to the highs struck in July last year. With momentum indicators such as RSI (14) and MACD turning bullish, this attempt may prove more successful than January’s failed breakout.
The intersection of the downtrend with minor horizontal support at 96.80 looms as a key level in assessing near-term setups.
Longs could be established above it with a stop-loss order beneath, should the break hold. Targets include 97.78 and 99.10. If the breakout fails, shorts could be considered beneath, with a stop-loss placed above for protection. 95.00—where buyers have been lurking—is one potential target.
From a fundamental perspective, keep an eye on movements in US 10-year Treasury yields which have been a key driver not just for USD/JPY but also AUD/JPY recently.
Good luck!
DS


IDEA AUDJPY LONG POSTION Hi Traders
Pair: AUDJPY
📈 Position: LONG (BUY )
✅ Entry: 96.800
🔺 SL: 96.500 (-30 pips )
🎯 Take Profits:
• TP 1: 97.100
• TP 2: 97.400
• TP 3: 97.700 (Trailing SL)

12-2 AUDJPY :12-2 AUDJPY : we have a buy step at 97.360 where we see a trend change supported by Manufacturing PMI 2. The TP is around 98.8. We are keeping an eye on the long term trend, which is short.

AUDJPY Is Recovering After The Wedge PatternAUDJPY pair is sharply and impulsively recovering after we spotted the wedge pattern, so it’s now rising in minimum three waves A/1-B/2-C/3 that can retrace the price back to the starting point of the wedge pattern and back to 99-100 area, especially if we consider an unfilled GAP at 98.35 level. Currently we can see it making a five-wave impulse into wave A/1, so after corrective pullback in wave B/2, be aware of a bigger rally within wave C or maybe even wave 3 if goes decisively above 100 area.
The ending diagonal (wedge) pattern is a special type of wave that occurs in wave 5 of an impulse or wave C of a correction. An ending diagonal pattern is a type of pattern that can occur at the completion of a strong move. It reflects a “calming” of the market sentiment such that price still moves generally in the direction of the larger move, but not strongly enough to produce an impulsive wave. Ending diagonals consist of five waves, labeled 1-2-3-4-5, where each wave subdivides into three legs. Waves 1 and 4 overlap in price, while wave 3 can not be the shortest amongst waves 1, 3 and 5.
The reason why they are so interesting is because they are indicating a reversal, usually a strong one, which can retrace the price back to the starting point of the pattern.

Short Buddy!!!Short buddy!
My 3 confluences have been met.
1. High premium area touching
2. Macd divergence
3. Internal liquidity being taken
94.25-94.00 is my target area that I anticipate to be hit by the this weeks market close.
Trade safely my friends

Buy Setup Retrospective: Missed Entry but good setupI missed the entry for this trade, but I like the analysis and setup. This trade aligns perfectly with my strategy—buying or selling from pivot lines (preferably monthly) with a 20-30 pip risk and an RR > 2.
Even though I didn’t take this trade, I’m sharing it as an example of what to look for in the markets.
