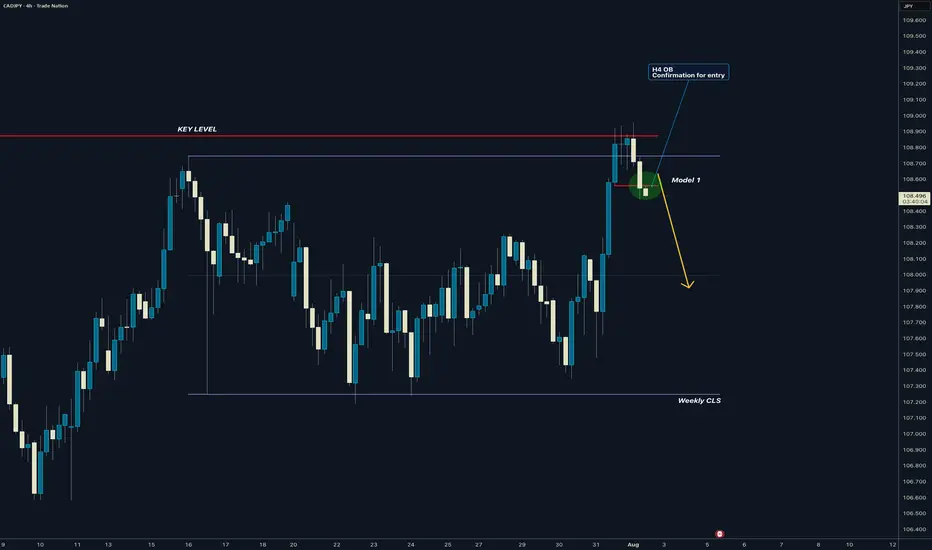
CADJPY I Weekly CLS Range I Model 1 I H4 entry ConfirmedYo Market Warriors ⚔️
Fresh outlook drop — if you’ve been riding with me, you already know:
🎯My system is 100% mechanical. No emotions. No trend lines. No subjective guessing. Just precision, structure, and sniper entries.
🧠 What’s CLS?
It’s the real smart money. The invisible hand behind $7T/d
Related currencies
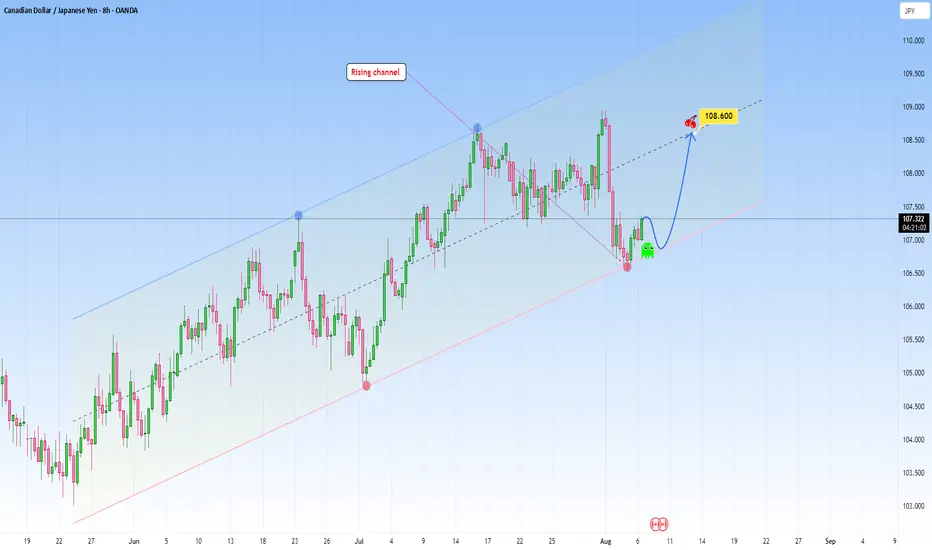
CADJPY: Moving in a clear rising channelCADJPY is currently respecting a well-defined rising channel structure, with price reacting cleanly to both the upper and lower bounds of the channel.
After a sharp correction, price has once again tapped the lower trendline support, a level that has triggered bullish reversals, and is now showing
CADJPY: Bullish Continuation is Expected! Here is Why:
Balance of buyers and sellers on the CADJPY pair, that is best felt when all the timeframes are analyzed properly is shifting in favor of the buyers, therefore is it only natural that we go long on the pair.
Disclosure: I am part of Trade Nation's Influencer program and receive a monthly fee for

Cadjpy sellCad jpy looks rdy for a pullback, I will sell at 108.810 and take profits at 108.432 happy trading be good humans. 🙏

CAD_JPY STRONG UPTREND|LONG|
✅CAD_JPY is trading in an uptrend
Along the rising support line
Which makes me bullish biased
And the pair is already making
A bullish rebound from the support
So a further move up is expected
With the target of retesting the
Level above at 107.705
LONG🚀
✅Like and subscribe to never miss a ne

CADJPY: Bullish Move Confirmed?! 🇨🇦🇯🇵
CADJPY is going to bounce from a key daily support.
With a high probability, 107.28 level will be reached soon.
❤️Please, support my work with like, thank you!❤️

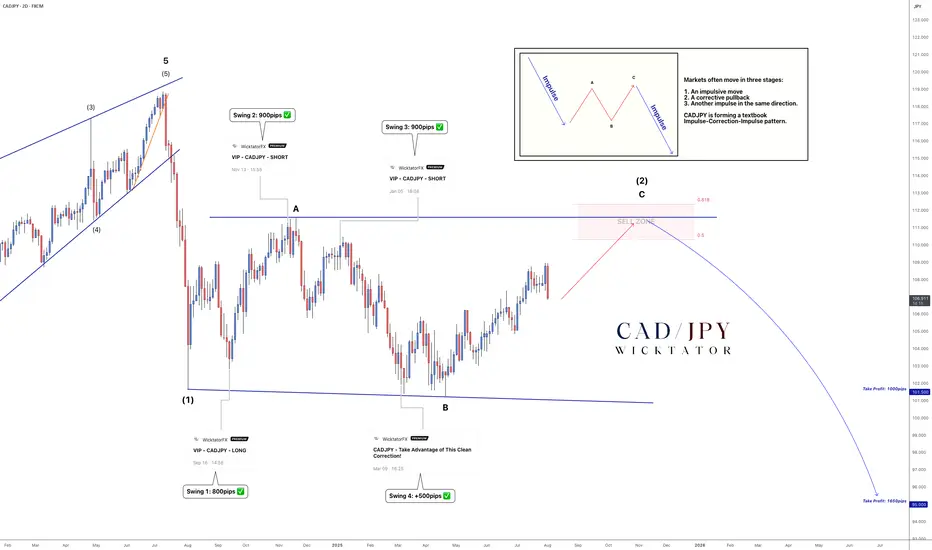
CADJPY - Wave C Near Completion: Big Drop Coming!We’ve been tracking CADJPY for years, and price has followed Elliott Wave structure almost perfectly.
In mid‑2024, an ending diagonal signalled the top and kicked off a major bearish impulse. That drop formed wave A of the current ABC correction. Wave B completed in late 2024, and price is now in w
CADJPY: Bearish Move From Resistance 🇨🇦🇯🇵
There is a high chance that CADJPY will drop
from a key daily resistance cluster.
As a confirmation, I see a triple top pattern
on an hourly time frame and a violation of its neckline.
Goal - 106.9
❤️Please, support my work with like, thank you!❤️
I am part of Trade Nation's Influencer pro

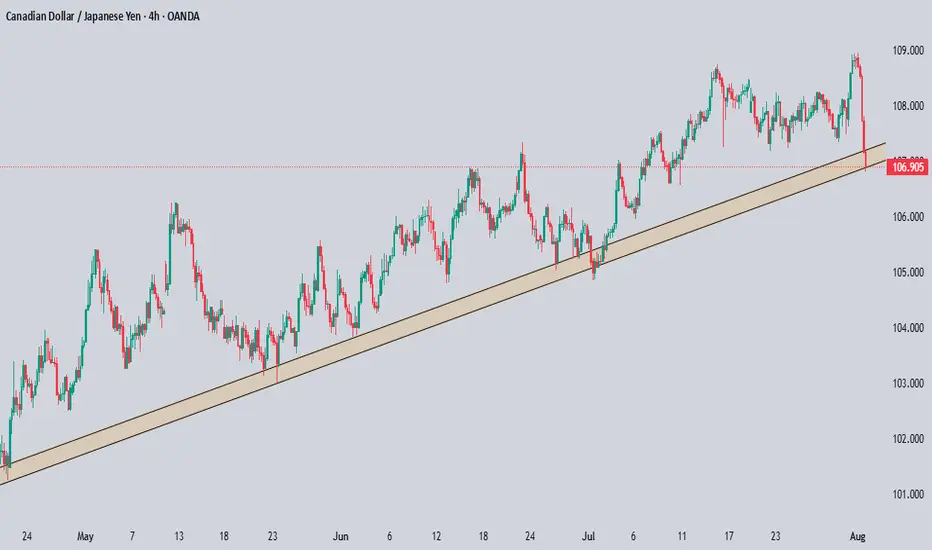
CADJPY - Downside to continueSellers has taken control with a massive push down, wait for bearish continuation to form to confirm another sell opportunity.
Good Luck

CADJPY Technical & Order Flow AnalysisOur analysis is based on a multi-timeframe top-down approach and fundamental analysis.
Based on our assessment, the price is expected to return to the monthly level.
DISCLAIMER: This analysis may change at any time without notice and is solely intended to assist traders in making independent inve
See all ideas
Summarizing what the indicators are suggesting.
Oscillators
Neutral
SellBuy
Strong sellStrong buy
Strong sellSellNeutralBuyStrong buy
Oscillators
Neutral
SellBuy
Strong sellStrong buy
Strong sellSellNeutralBuyStrong buy
Summary
Neutral
SellBuy
Strong sellStrong buy
Strong sellSellNeutralBuyStrong buy
Summary
Neutral
SellBuy
Strong sellStrong buy
Strong sellSellNeutralBuyStrong buy
Summary
Neutral
SellBuy
Strong sellStrong buy
Strong sellSellNeutralBuyStrong buy
Moving Averages
Neutral
SellBuy
Strong sellStrong buy
Strong sellSellNeutralBuyStrong buy
Moving Averages
Neutral
SellBuy
Strong sellStrong buy
Strong sellSellNeutralBuyStrong buy
Displays a symbol's price movements over previous years to identify recurring trends.
Frequently Asked Questions
The current rate of JPYCAD is 0.009346 CAD — it has decreased by −0.14% in the past 24 hours. See more of JPYCAD rate dynamics on the detailed chart.
The value of the JPYCAD pair is quoted as 1 JPY per x CAD. For example, if the pair is trading at 1.50, it means it takes 1.5 CAD to buy 1 JPY.
The term volatility describes the risk related to the changes in an asset's value. JPYCAD has the volatility rating of 0.43%. Track all currencies' changes with our live Forex Heatmap and prepare for markets volatility.
The JPYCAD showed a 0.47% rise over the past week, the month change is a −1.00% fall, and over the last year it has decreased by −1.95%. Track live rate changes on the JPYCAD chart.
Learn how you can make money on rate changes in numerous trading ideas created by our community.
Learn how you can make money on rate changes in numerous trading ideas created by our community.
JPYCAD is a minor currency pair, i.e. a popular pair that is not associated with USD. Such pairs are also called cross currency pairs.
Currencies are usually traded through forex brokers — choose the one that suits your needs and go ahead. You can trade JPYCAD right from TradingView charts — just log in to you broker account. Check out the list of our integrated brokers and find the best one for your needs and strategy.
When deciding to buy or sell currency one should keep in mind many factors including current geopolitical situation, interest rates, and other. But before plunging into a deep research, you can start with JPYCAD technical analysis. The technical rating for the pair is neutral today, but don't forget that markets can be very unstable, so don't stop here. According to our 1 week rating the JPYCAD shows the sell signal, and 1 month rating is sell. See more of JPYCAD technicals for a more comprehensive analysis.