CADJPY: Bullish Continuation Confirmed 🇨🇦🇯🇵
Look how strongly CADJPY reacted to a recently broken
resistance that turned into a support after a breakout.
A bullish violation of a resistance line of a falling wedge on an hourly time frame
with a bullish imbalance confirms a highly probable growth.
The price will go up at least to 105.09
❤️Please, support my work with like, thank you!❤️
I am part of Trade Nation's Influencer program and receive a monthly fee for using their TradingView charts in my analysis.
JPYCAD trade ideas

CAD/JPY For Bearish as pull-backyou can go short now
general trend is up trend
current phase is pull-back
have fun :)

CADJPY REVIVALCurrently Team bullish is dominating, here on these post i shared my buy analysis on $FX:CADJPY.

CAD/JPY H4 AnalysisThe downtrend which started earlier this month came to an end last week after a low at 103.008
Since then, we have seen higher highs and higher lows as the buyers come into the market.
Look for pullbacks and buy setups that meet your strategy rules if you agree with this analysis.

UsdcadUsdcad I posted this trade few hours ago and we are hitting back to back tp and is not yet Friday we had a red week last week 2 trade 2 sl this week has been good so far 4 trade called out 3 trade hit tp already

CAD/JPY BEST PLACE TO SELL FROM|SHORT
Hello, Friends!
CAD/JPY pair is trading in a local downtrend which know by looking at the previous 1W candle which is red. On the 1H timeframe the pair is going up. The pair is overbought because the price is close to the upper band of the BB indicator. So we are looking to sell the pair with the upper BB line acting as resistance. The next target is 103.758 area.
Disclosure: I am part of Trade Nation's Influencer program and receive a monthly fee for using their TradingView charts in my analysis.
✅LIKE AND COMMENT MY IDEAS✅

EUR/NZD Short and CAD/JPY ShortEUR/NZD Short
Minimum entry requirements:
• If tight non-structured 5 min continuation forms, reduced risk entry on the break of it.
• If tight structured 5 min continuation forms, reduced risk entry on the break of it or 5 min risk entry within it.
• If tight non-structured 15 min continuation forms, 5 min risk entry within it if the continuation is structured on the 5 min chart or reduced risk entry on the break of it.
• If tight structured 15 min continuation forms, reduced risk entry on the break of it or 15 min risk entry within it.
CAD/JPY Short
Minimum entry requirements:
• Tap into area of value.
• 1H impulse down below area of value.
• If tight non-structured 5 min continuation follows, reduced risk entry on the break of it.
• If tight structured 5 min continuation follows, reduced risk entry on the break of it or 5 min risk entry within it.
• If tight non-structured 15 min continuation follows, 5 min risk entry within it if the continuation is structured on the 5 min chart or reduced risk entry on the break of it.
• If tight structured 15 min continuation follows, reduced risk entry on the break of it or 15 min risk entry within it.

How to use advanced candlestick anatomy in trading: CADJPYEvery candlestick on the chart is made up of different or multiple candles on the lower timeframe. For example, a weekly candle is made up of seven daily candles. While a 4 hours candle is made up of four 1 hour candles. Understanding how these candles contribute to the formation of a single or more candlesticks will go a long way in improving our performance.
Candlestick anatomy has to do with the formation of candlestick on the chart and the implication of such candlestick. Conventionally, common candlesticks are engulfing candlestick, doji, evening star, hammer, pin bar and the rest. Some signify continuation while others are meant for reversal. The formation of these candlesticks at key levels provide an helpful insights into understanding the next market move. Hence, they can serve as confluence and confirmation for our trading decision.
Taking this further a bit, by examining these candlesticks, one can get to understand better a precise point for entry and exit. This may be new to a retail trader who trades just the candlestick while it will provide more insights for anyone looking for ways to optimize his performance.
As a case study, I had a sell setup on CADJPY and it gave a bearish engulfing candlestick on 1 hour timeframe as a confirmation for selling. Instead of entering the trade after the bearish candle closed, I changed to 5 minutes timeframe to examine the anatomy of the candlestick. Then, I discovered that there was sweep and change of character. Based on the price narrative on 5 minutes timeframe, then trading decision was made using the 5 minutes timeframe, targeting 3 RR. If 1 hour timeframe had been used for taking the trade, one is likely to have lost the profit by now.
Candlestick anatomy will help you to optimize your performance and returns.
I hope you've learnt something helpful from this post.
Thanks.
Fatai Kareem, Kof T Fx.

Bullish on Cadjpystructure, followed by price actions is king.
structure was broken around 104.070 area, we wait for price to come back to demands zone for buy entry. our target area will be the previous highs.
target# 1 105.105
target #2 105.950

CADJPY Will Go Higher! Long!
Take a look at our analysis for CADJPY.
Time Frame: 1D
Current Trend: Bullish
Sentiment: Oversold (based on 7-period RSI)
Forecast: Bullish
The market is testing a major horizontal structure 103.810.
Taking into consideration the structure & trend analysis, I believe that the market will reach 105.723 level soon.
P.S
We determine oversold/overbought condition with RSI indicator.
When it drops below 30 - the market is considered to be oversold.
When it bounces above 70 - the market is considered to be overbought.
Disclosure: I am part of Trade Nation's Influencer program and receive a monthly fee for using their TradingView charts in my analysis.
Like and subscribe and comment my ideas if you enjoy them!

LONG ON CAD/JPYCADJPY is rising off a major demand zone.
Us tariffs shaking up the JPY in a negative way.
I will be buying this pair looking to catch over 100 pips to the next fvg/supply area.

Double Top continuation patternThe price broke a daily and 4 hour bullish trendline, and made a pullback as a sideways consolidation, forming a double top on the 1 hour timeframe, now if the price makes a lower low we will see a bearish impulse
WE ONLY TRADE PULLBACKS

CAD-JPY Will Go UP! Buy!
Hello,Traders!
CAD-JPY made a retest
Of the horizontal support
Of 103,431 and we are
Already seeing a bullish
Rebound so we will be
Expecting a further
Local bullish rebound
Buy!
Comment and subscribe to help us grow!
Check out other forecasts below too!
Disclosure: I am part of Trade Nation's Influencer program and receive a monthly fee for using their TradingView charts in my analysis.

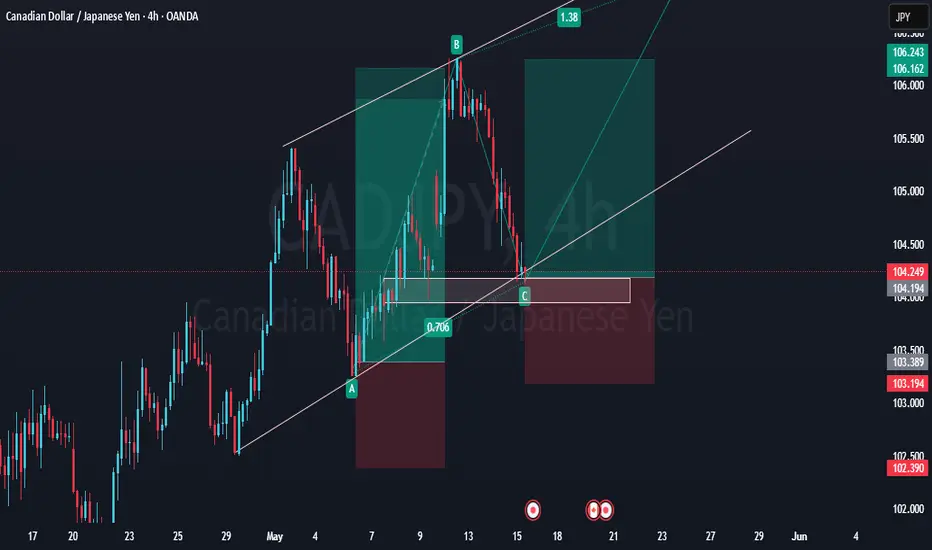
CJ BEARISH PATTERN C-D LEGLooking to see if price makes a move on bears. Wait to see clear move before entering positions on this trade.
CADJPY: Long Trade with Entry/SL/TP
CADJPY
- Classic bullish formation
- Our team expects growth
SUGGESTED TRADE:
Swing Trade
Buy CADJPY
Entry Level - 103.60
Sl - 103.05
Tp - 104.64
Our Risk - 1%
Start protection of your profits from lower levels
Disclosure: I am part of Trade Nation's Influencer program and receive a monthly fee for using their TradingView charts in my analysis.
❤️ Please, support our work with like & comment! ❤️

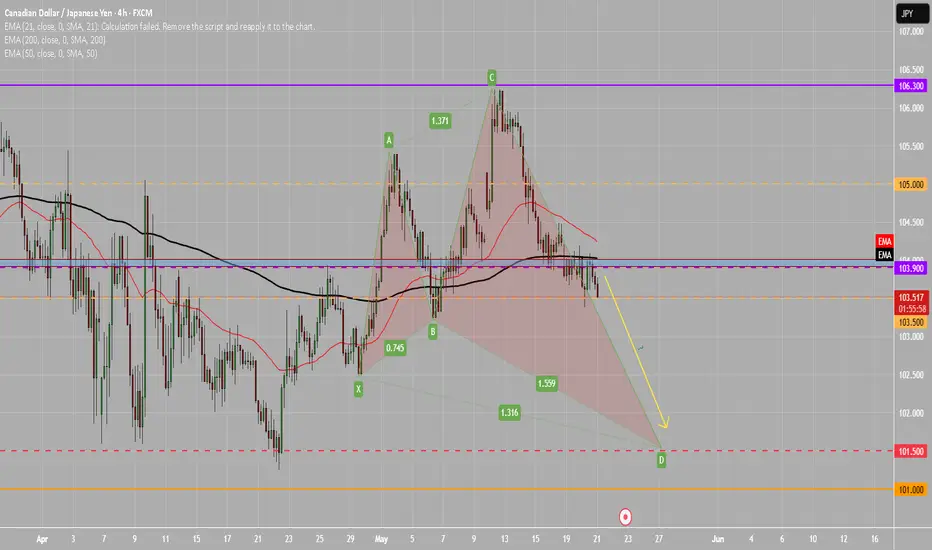
CADJPY - Bearish Rising WedgeHello Traders !
The CADJPY price formed a rising wedge pattern.
The price broke the support line.
So, I expect a bearish move📉
_______________
TARGET: 103.655🎯

CADJPY I Long Opportunity to Middle of the ChannelWelcome back! Let me know your thoughts in the comments!
** CADJPY Analysis - Listen to video!
We recommend that you keep this pair on your watchlist and enter when the entry criteria of your strategy is met.
Please support this idea with a LIKE and COMMENT if you find it useful and Click "Follow" on our profile if you'd like these trade ideas delivered straight to your email in the future.
Thanks for your continued support!Welcome back! Let me know your thoughts in the comments!

CADJPY – Risk at the Zone, Reward in the BouncePrice tapped into this key demand zone after extended downside pressure. If bulls hold this level, we could see a sharp reaction back toward 104.30+. Tight stop, clean setup. Let’s see if the level holds. ✅

GBP/JPY Short and CAD/JPY ShortGBP/JPY Short
Minimum entry requirements:
• Corrective tap into area of value.
• 4H risk entry or 1H risk entry after 2 x 1H rejection candles.
Minimum entry requirements:
• Tap into area of value.
• 1H impulse down below area of value.
• If tight non-structured 5 min continuation follows, reduced risk entry on the break of it.
• If tight structured 5 min continuation follows, reduced risk entry on the break of it or 5 min risk entry within it.
• If tight non-structured 15 min continuation follows, 5 min risk entry within it if the continuation is structured on the 5 min chart or reduced risk entry on the break of it.
• If tight structured 15 min continuation follows, reduced risk entry on the break of it or 15 min risk entry within it.
CAD/JPY Short
Minimum entry requirements:
• Corrective tap into area of value.
• 4H risk entry or 1H risk entry after 2 x 1H rejection candles.
Minimum entry requirements:
• Tap into area of value.
• 1H impulse down below area of value.
• If tight non-structured 5 min continuation follows, reduced risk entry on the break of it.
• If tight structured 5 min continuation follows, reduced risk entry on the break of it or 5 min risk entry within it.
• If tight non-structured 15 min continuation follows, 5 min risk entry within it if the continuation is structured on the 5 min chart or reduced risk entry on the break of it.
• If tight structured 15 min continuation follows, reduced risk entry on the break of it or 15 min risk entry within it.

CAD/JPY BEARS ARE STRONG HERE|SHORT
Hello, Friends!
We are going short on the CAD/JPY with the target of 101.132 level, because the pair is overbought and will soon hit the resistance line above. We deduced the overbought condition from the price being near to the upper BB band. However, we should use low risk here because the 1W TF is green and gives us a counter-signal.
Disclosure: I am part of Trade Nation's Influencer program and receive a monthly fee for using their TradingView charts in my analysis.
✅LIKE AND COMMENT MY IDEAS✅

CADJPY bullishThis is a swing bullish deal.
Trouble bottom pattern and on a daily it Bullish Bat/Crab pattern.
You can enter from the current price and stop loss 103.75 and target 110.413

CADJPY: Expecting Bullish Continuation! Here is Why:
Balance of buyers and sellers on the CADJPY pair, that is best felt when all the timeframes are analyzed properly is shifting in favor of the buyers, therefore is it only natural that we go long on the pair.
Disclosure: I am part of Trade Nation's Influencer program and receive a monthly fee for using their TradingView charts in my analysis.
❤️ Please, support our work with like & comment! ❤️

CADJPY BULLISHCADJPY bullish in H4
printing HH &HL
at current price 0.61% fib level
complete its retracement for further bullish move
follow ab=cd pattern
now on c point