BUY CADJPYI see a bullish flag on CADJPY. I am calmly waiting for a breakout of this elongated channel before placing buy orders. The JPY index looks short
JPYCAD trade ideas

CADJPY BUY/LONGBy utilizing Fibonacci retracement levels, historical patterns, , we can formulate a hypothesis that the market might follow a similar trajectory if bullish sentiment prevails.

CAD/JPY – Trendline Breakout and Retest (Daily Timeframe)CAD/JPY has successfully broken above a long-standing descending trendline, signaling a potential shift from bearish to bullish structure. The pair is now showing signs of pullback or retest of this trendline, which could act as a launchpad for a fresh bullish wave.
The major support zone near 101.50–102.00 continues to hold strong, and the breakout aligns with bullish market sentiment. If the retest confirms, price could rally toward the 106.50–107.00 region.
🔼 Bullish Setup Highlights:
Breakout confirmed above descending trendline.
Strong demand zone still valid below.
Retest in progress – eyes on bullish engulfing or confirmation candle.
📈 Watch for bullish continuation if price holds above the trendline and support zone.

CAD JPY Entry Setup 1 hour Timeframe CAD JPY Entry Setup 1 hour Timeframe
Entry Setup: Bullish break and retest
Additional confluence: 0.618 - 0.50 Fib Retracement Level.
Candlestick confirmation: No confirmation yet so we wait.

CAD/JPY "Loonie-Yen" Forex Bank Heist Plan (Scalping/Day)🌟Hi! Hola! Ola! Bonjour! Hallo! Marhaba!🌟
Dear Money Makers & Robbers, 🤑💰✈️
Based on 🔥Thief Trading style technical and fundamental analysis🔥, here is our master plan to heist the CAD/JPY "Loonie-Yen" Forex Market. Please adhere to the strategy I've outlined in the chart, which emphasizes short entry. Our aim is the high-risk Green MA Zone. Risky level, oversold market, consolidation, trend reversal, trap at the level where traders and bullish robbers are stronger. 🏆💸"Take profit and treat yourself, traders. You deserve it!💪🏆🎉
Entry 📈 : "The heist is on! Wait for the Major Support breakout then make your move at (101.000) - Bearish profits await!"
however I advise to Place sell stop orders above the Moving average (or) after the Support level Place sell limit orders within a 15 or 30 minute timeframe most NEAREST (or) SWING low or high level for Pullback entries.
📌I strongly advise you to set an "alert (Alarm)" on your chart so you can see when the breakout entry occurs.
Stop Loss 🛑: "🔊 Yo, listen up! 🗣️ If you're lookin' to get in on a sell stop order, don't even think about settin' that stop loss till after the breakout 🚀. You feel me? Now, if you're smart, you'll place that stop loss where I told you to 📍, but if you're a rebel, you can put it wherever you like 🤪 - just don't say I didn't warn you ⚠️. You're playin' with fire 🔥, and it's your risk, not mine 👊."
📌Thief SL placed at the nearest/swing High or Low level Using the 4H timeframe (104.000) Day/Scalping trade basis.
📌SL is based on your risk of the trade, lot size and how many multiple orders you have to take.
Target 🎯: 98.500 (or) Escape Before the Target
💰💵💸CAD/JPY "Loonie-Yen" Forex Market Heist Plan (Scalping/Day Trade) is currently experiencing a Bearish trend.., driven by several key factors.👇👇👇
📰🗞️Get & Read the Fundamental, Macro, COT Report, Quantitative Analysis, Sentimental Outlook, Intermarket Analysis, Future trend targets... go ahead to check 👉👉👉🔗🔗
⚠️Trading Alert : News Releases and Position Management 📰 🗞️ 🚫🚏
As a reminder, news releases can have a significant impact on market prices and volatility. To minimize potential losses and protect your running positions,
we recommend the following:
Avoid taking new trades during news releases
Use trailing stop-loss orders to protect your running positions and lock in profits
💖Supporting our robbery plan 💥Hit the Boost Button💥 will enable us to effortlessly make and steal money 💰💵. Boost the strength of our robbery team. Every day in this market make money with ease by using the Thief Trading Style.🏆💪🤝❤️🎉🚀
I'll see you soon with another heist plan, so stay tuned 🤑🐱👤🤗🤩

CADJPY BUY!Main push on the one hour and is now sitting at 103.942 which is a great support area. 3 levels of support just below this area at 103.786, 103.643, 103.550
Stop loss 103.500
You cant go wrong with this trade. Will update once TP HIT!
I believe proce will push beyond 105.000 by the end of the week.

Bullish bounce off pullback support?CAD/JPY is falling towards the pivot which has been identified as a pullback support and could bounce to the 1st resistance which is a pullback resistance.
Pivot: 103.77
1st Support: 103.11
1st Resistance: 105.60
Risk Warning:
Trading Forex and CFDs carries a high level of risk to your capital and you should only trade with money you can afford to lose. Trading Forex and CFDs may not be suitable for all investors, so please ensure that you fully understand the risks involved and seek independent advice if necessary.
Disclaimer:
The above opinions given constitute general market commentary, and do not constitute the opinion or advice of IC Markets or any form of personal or investment advice.
Any opinions, news, research, analyses, prices, other information, or links to third-party sites contained on this website are provided on an "as-is" basis, are intended only to be informative, is not an advice nor a recommendation, nor research, or a record of our trading prices, or an offer of, or solicitation for a transaction in any financial instrument and thus should not be treated as such. The information provided does not involve any specific investment objectives, financial situation and needs of any specific person who may receive it. Please be aware, that past performance is not a reliable indicator of future performance and/or results. Past Performance or Forward-looking scenarios based upon the reasonable beliefs of the third-party provider are not a guarantee of future performance. Actual results may differ materially from those anticipated in forward-looking or past performance statements. IC Markets makes no representation or warranty and assumes no liability as to the accuracy or completeness of the information provided, nor any loss arising from any investment based on a recommendation, forecast or any information supplied by any third-party.

CADJPY LongBullish market structure. Daily Inverted Head and Shoulders. Waiting on the retracement into the area of interest and confirmation at that area to go long.

CAD_JPY BULLISH REBOUND|LONG|
✅CAD_JPY is going down now
But a strong support level is ahead at 103.888
Thus I am expecting a rebound
And a move up towards the target of 104.400
LONG🚀
✅Like and subscribe to never miss a new idea!✅
Disclosure: I am part of Trade Nation's Influencer program and receive a monthly fee for using their TradingView charts in my analysis.

CAD/JPY For Bearish as pull-backwait for pull-back near by entry point and then go short
general trend is up trend
current phase is pull-back
have fun :)

SELL OPPORTUNITY ALERT IN CADJPY!!Price present us with a possible sell opportunity as we saw a decline back to a trend line. If we’d get a break of the trendline and that of a pullback support of 103.138 we’re going to short the pair and our target profit will be at 101.000

CAD/JPY at Key Decision Zone: Breakout or Rejection?🕵️♂️ Chart Overview:
Instrument: CAD/JPY
Chart Type: Candlestick
Time Frame: Appears to be intraday (possibly 1H or 4H)
EMAs Used:
50 EMA (Red): 102.814
200 EMA (Blue): 102.710
📊 Key Zones Identified:
1. Immediate Zone (103.30 - 103.50)
Marked as: “Resistance + Support”
This is a key decision zone. Price has tested this region multiple times, showing it holds dual roles — a flip zone.
Price is currently testing this zone again. A break and retest above could confirm bullish momentum.
2. Upper Resistance Zone (104.80 - 105.50)
A broader supply area where previous strong selling pressure occurred.
This is the next logical target if price breaks and holds above 103.50.
3. Lower Support (101.29)
Strong horizontal support, clearly defined from previous lows.
If the price fails to break above the current zone, a rejection could lead to a move back down toward this support.
📈 Bullish Scenario:
Break above 103.50, with a successful retest confirming new support.
Momentum could carry price toward the 105.00–105.50 resistance.
Supported by 50 EMA crossing above 200 EMA (early sign of bullish crossover — Golden Cross).
📉 Bearish Scenario:
Rejection from the 103.30–103.50 zone could signal continuation of range-bound or bearish pressure.
Break below 102.00, followed by momentum towards 101.29 key support.
Would invalidate short-term bullish structure.
📌 Additional Technical Notes:
The chart shows consolidation between 102.00 and 103.50 — likely accumulation or re-accumulation phase.
EMAs are tightening, indicating a potential volatility expansion move is near.
Volume is not visible but would be useful to confirm breakout strength.
📍Conclusion:
CAD/JPY is currently at a critical decision zone. The next few candles will be key. Monitor:
Breakout direction
Retest confirmations
Momentum and volume indicators (if available)

CAD JPY Entry Setup 1 hour timeframe CAD JPY Entry Setup
Bearish break and retest
Candlestick confirmation: Doji and clow below
Risk to Reward: 1:3

Cadjpy Look at this set-up on the cadjpy once price fails to break above the intermediate high we'd be expecting a Bearish sentiment to be able to take a short decision on the price down to the discounted area...

CAD_JPY SHORT SIGNAL|
✅CAD_JPY is set to retest a
Strong resistance level above around 105.800
After trading in a local uptrend for some time
Which makes a bearish pullback a likely scenario
So we can enter a short trade with the
TP of 104.729 and the SL of 105.921
SHORT🔥
✅Like and subscribe to never miss a new idea!✅
Disclosure: I am part of Trade Nation's Influencer program and receive a monthly fee for using their TradingView charts in my analysis.

CAD/JPY: Price at Decision Point – Key Support in PlayWelcome back! Let me know your thoughts in the comments!
** CADJPY Analysis !
We recommend that you keep this pair on your watchlist and enter when the entry criteria of your strategy is met.
Please support this idea with a LIKE and COMMENT if you find it useful and Click "Follow" on our profile if you'd like these trade ideas delivered straight to your email in the future.
Thanks for your continued support! Welcome back! Let me know your thoughts in the comments!

CADJPY RALLIED IN THE WAKE OF STEADY RATE BY BOJEarlier today, May 1st, The Bank of Japan (BoJ) maintained its interest rates at 0.5%, with a dovish outlook, including trimmed growth and inflation forecasts.
This stance suggests a lower likelihood of near-term rate hikes, this priced in a weaker Yen and hence the Yen lagged across board.
The Canadian Dollar on the other hand being strengthened by the recent rebounds in oil prices took advantage of that, hence the surge in CADJPY.
TECHNICAL VIEW
From technical perspective, prices were supported at 104.35 after it broke out of a major psychological barrier level of 104. Price rallied to the strong supply zone of 105 and currently hovering around 105.06.
From technical lenses, the oscillators: RSI and Stochastic are over stretched hinting signs of possible pullback as they have gone above over bought levels and created bearish divergence: price is forming Higher High and both indicators are possibly forming Lower High simultaneously.
Other things being equal, analysts likely predict price to drop with potential target around 104.35 and if that is taken out, the next potential targets would be 104 and 103. On the other hand, if the bullish momentum is sustained, a break above 105.39 would usher in 106 psychological level. Breakouts of these levels are not ruled out as per analysts.

CADJPY Wave Analysis – 1 May 2025- CADJPY broke the resistance zone
- Likely to rise to resistance level 106.00
CADJPY currency pair recently broke the resistance zone between the resistance level 104.00 and the resistance trendline of the Descending Triangle from February.
The breakout of this resistance zone continues the earlier sharp upward correction from the major long-term support level 102.00, which has been reversing the price from August.
CADJPY can be expected to rise to the next resistance level 106.00 (top of the previous minor correction 2 from March).

CADJPY-SELL strategy 3 Hourly chart GANNThis pair is starting to look overbought, and topping at GANN resistance 104.82 area, provides a reasonable chance to see lower again. Likely we will see 103.15 support area being attracted.
Strategy SELL @ 104.65-104.95 and take profit near 103.37 for now.

CADJPY Technical & Order Flow Analysis (Swing Trading)Our analysis is based on multi-timeframe top-down analysis & fundamental analysis.
Based on our view, the price will rise to the monthly level.
DISCLAIMER: This analysis can change anytime without notice and is only for assisting traders in making independent investment decisions. Please note that this is a prediction, and I have no reason to act on it, and neither should you.
Please support our analysis with a like or comment!

CAD/JPY Rally Could Fade Near Resistance – Watch for ShortsThe CAD/JPY pair is currently trading within a well-defined descending trendline. Multiple rejections are visible around the 108.300, 105.864, 105.434, and 105.044 levels, confirming strong bearish control over the medium term.
Price has recently bounced from a critical horizontal support near 101.246, forming a short-term bullish move toward the descending trendline. We are now approaching a confluence zone near the 103.800–104.000 area, where the downtrend line intersects. This zone is a potential supply area and could act as a strong resistance.
Trade Idea: Sell Setup Near Trendline (103.800–104.000)
Target: 102.532, 101.250
Invalidation: Break and close above 104.200

CAD/JPY 4-Hour Short – Fibonacci RetracementWe’re fading the recent CAD/JPY rally with a sell-limit at the 38.2% retracement (≈103.60), anticipating a continuation of the larger down-impulse.
• Entry: 103.597 (Sell Limit at 38.2% fib)
• Stop Loss: 103.982 (just above 23.6% fib) → 37.5 pips / 0.36% risk → $2.70 at 0.01 lots
• Take Profit: 102.514 (78.6% extension) → 109.3 pips / 1.05% reward → $7.58 at 0.01 lots
• Risk-Reward: ≈1:2.9
The custom RSI (with its configurable moving average) is turning lower below 60, aligning momentum with a bearish bias. Position sizing is handled by the “Sniper Lot Size Calculator” to cap risk at 1% per trade. This clean, macro-to-micro approach keeps us surgical—waiting for the pullback, then striking with precision.

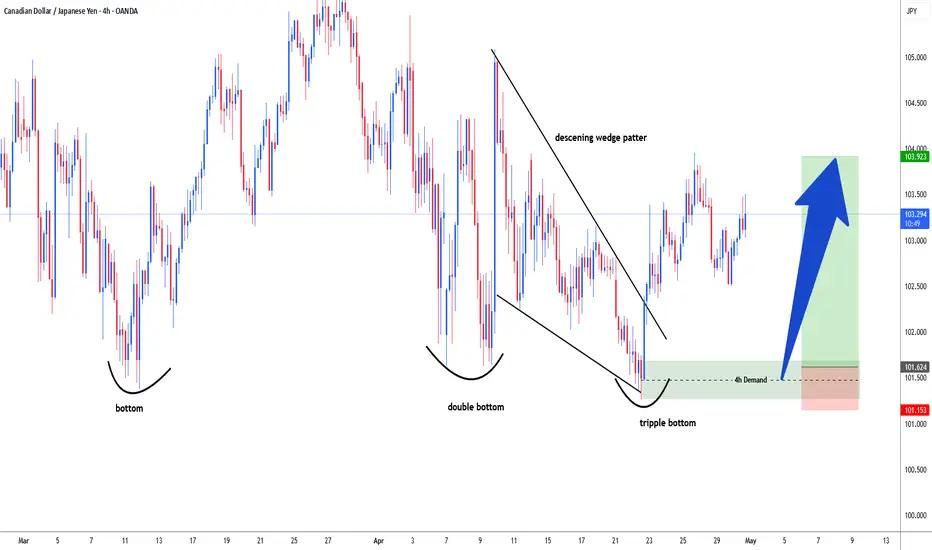
CADJPY possible long 103.60 #cadjpy forming tripple bottom in 4h time frame, large speculators covering huge short positions. 62k shorts position in cad has been reduce which giving impact on cad strength. demand zone for long is 101.60, Sl 101.10, target 103.30 & 103.90.