#CADJPY 4HCADJPY 4-Hour Analysis
The CADJPY pair has broken out above a key trendline resistance on the 4-hour chart, indicating a potential shift in momentum to the upside. Additionally, the presence of a buy engulfing candlestick in the breakout area reinforces the bullish sentiment, providing a strong buy opportunity.
Technical Outlook:
Pattern: Breakout Trendline Resistance and Buy Engulfing Area
Forecast: Bullish (Buy Opportunity)
Entry Strategy: Enter a buy position following the breakout, confirming with bullish price action signals such as sustained trading above the breakout level or further bullish candlesticks.
Traders should monitor indicators like RSI and MACD for confirmation of continued upward momentum. Risk management is crucial, with stop-loss orders placed below the breakout level and profit targets set at the next resistance zones or key price levels.
JPYCAD trade ideas

CADJPY next possible move"It’s not the time you have, but what you do with it that matters." – Bruce Lee.
In the world of trading and investing, this quote carries profound meaning. Every minute you spend learning, analyzing, and planning your strategies adds another brick to the foundation of your success. Don’t be discouraged by the passage of time or past failures. What truly matters is the quality of the effort you invest.
Make every moment an opportunity to grow, refine your skills, and move closer to your goals. Results will come to those who use their time with purpose and determination.
Remember, the market rewards those who act with perseverance, not those waiting for a miracle solution. 🚀📈

CADJPYFirst thing first check out the trend how its going! clearly wat happened here the structure kept creating too much liquidity finally swept the structure which i had a confidence to jump onto my thought or my trade idea here, i see a clear bullish trend everything is set well. will see how it will respect our analysis
#SMC & ICT!

CADJPY: Ready to Climb Higher**CADJPY Update**
After consolidating within a horizontal range for over a week, a major news release yesterday triggered a bullish shift in the pair.
On the 4-hour chart, the price has broken above the range's resistance level, signaling potential upward momentum.
The next resistance to watch is at 108.49.

CAD_JPY WILL GROW|LONG|
✅CAD_JPY is trading in an
Uptrend and the pair made
A retest of the support
Of 107.400 and made a
Rebound so we will be
Expecting a further move up
LONG🚀
✅Like and subscribe to never miss a new idea!✅

CADJPY: Time to Grow HigherCADJPY was consolidating within a horizontal range for more than a week before a significant news release yesterday caused the pair to become more bullish.
The price successfully broke above a resistance level on the range on 4-hour timeframe.
It is likely that we will see an bullish movement next, with the next resistance level to watch for at 108.49.

Bearish reversal?CAD/JPY is rising towards the pivot which acts as a pullback resistance and could reverse to the 1st support which has been identified as an overlap support.
Pivot: 108.44
1st Support: 107.05
1st Resistance: 109.38
Risk Warning:
Trading Forex and CFDs carries a high level of risk to your capital and you should only trade with money you can afford to lose. Trading Forex and CFDs may not be suitable for all investors, so please ensure that you fully understand the risks involved and seek independent advice if necessary.
Disclaimer:
The above opinions given constitute general market commentary, and do not constitute the opinion or advice of IC Markets or any form of personal or investment advice.
Any opinions, news, research, analyses, prices, other information, or links to third-party sites contained on this website are provided on an "as-is" basis, are intended only to be informative, is not an advice nor a recommendation, nor research, or a record of our trading prices, or an offer of, or solicitation for a transaction in any financial instrument and thus should not be treated as such. The information provided does not involve any specific investment objectives, financial situation and needs of any specific person who may receive it. Please be aware, that past performance is not a reliable indicator of future performance and/or results. Past Performance or Forward-looking scenarios based upon the reasonable beliefs of the third-party provider are not a guarantee of future performance. Actual results may differ materially from those anticipated in forward-looking or past performance statements. IC Markets makes no representation or warranty and assumes no liability as to the accuracy or completeness of the information provided, nor any loss arising from any investment based on a recommendation, forecast or any information supplied by any third-party.

CADJPY MARKET ANALYSIS AND PRICE PREDICTIONCADJPY, has finished consolidating at institutional renegotiation zone, decision has been taken in favor of the Bulls, price has already broken a structure and order is flowing. Entry is now. Take profit 1 is at the FVG, And Take profit 2 is at the Renegotiation resistance to clear of the Buyside Liquidity.
Take profit 1&2 , entry and stop loss are clearly stated on the chats/
GOOD LUCK GUYS!

CADJPY 2H LongBullish breakout above the Ichimoku cloud with Tenkan-Sen/Kijun-Sen alignment and strong Chikou Span support. Entry at 107.580, stop at 107.014, and target at 108.209, aiming for a continuation of bullish momentum.

CAD/JPYhello traders, in today's market I am building a buy position because it has broken through a very strong retracement zone on H1 and H4 timeframes and has given us a retest and from here I want to hold a buy position until the next orderblock and until the new HH

CADJPY (15m/4H) Bearish SetupHere's an analysis showing my bearish scenarios with two targets for the upcoming correction.
Both my bullish and bearish setup are pointing me with a selling opportunity, and by using Elliott Waves and identifying RSI divergences I can confidently say that these Bearish Divergences are increasing and the strength of the upside movement is slowly losing its momentum.
tradingview.com/
tradingview.com/
tradingview.com/

USDCAD and CADJPY Analysis Ahead of BoC Interest Rate DecisionWith the Bank of Canada (BoC) interest rate decision approaching, we analyse USDCAD and CADJPY using the Daily and H1 timeframes to uncover potential trading opportunities.
Market Outlook:
CADJPY:
The overall market structure appears bearish following a completed wave pattern and a corrective wave. We anticipate further downside movement, signalling potential short-selling opportunities.
USDCAD:
The pair remains strongly bullish, with expectations for the current uptrend to continue. However, a potential wave-structure pullback on the Daily chart could provide a favourable buying opportunity.
Stay blessed and happy trading!


CADJPY Will Fall! Sell!
Here is our detailed technical review for CADJPY.
Time Frame: 3h
Current Trend: Bearish
Sentiment: Overbought (based on 7-period RSI)
Forecast: Bearish
The price is testing a key resistance 107.583.
Taking into consideration the current market trend & overbought RSI, chances will be high to see a bearish movement to the downside at least to 106.848 level.
P.S
We determine oversold/overbought condition with RSI indicator.
When it drops below 30 - the market is considered to be oversold.
When it bounces above 70 - the market is considered to be overbought.
Like and subscribe and comment my ideas if you enjoy them!

4H Chart . Double Bottom . Breakout Will look for the confirmation of the breakout to develop upwards first
If price were to re-trace to S/R level with bullish candle bouncing off this level LONG position could be taken
still needs time for this set-up to develop and be confirmed over the next 24-48 hours
on my watch-list

CADJPY - Bullish ReversalCADJPY has formed a bullish divergence and double bottom. Currently it is breaking out above its neckline.

11.12.24 Morning ForecastPairs on Watch -
FX:CADJPY
FX:GBPAUD
A short overview of the instruments I am looking at for today, multi-timeframe analysis down to what I will be looking at for an entry. Enjoy!

Bullish bounce?CAD/JPY is falling towards the pivot which acts as a pullback support and could bounce to the 1st resistance.
Pivot: 105.77
1st Support: 104.88
1st Resistance: 108.47
Risk Warning:
Trading Forex and CFDs carries a high level of risk to your capital and you should only trade with money you can afford to lose. Trading Forex and CFDs may not be suitable for all investors, so please ensure that you fully understand the risks involved and seek independent advice if necessary.
Disclaimer:
The above opinions given constitute general market commentary, and do not constitute the opinion or advice of IC Markets or any form of personal or investment advice.
Any opinions, news, research, analyses, prices, other information, or links to third-party sites contained on this website are provided on an "as-is" basis, are intended only to be informative, is not an advice nor a recommendation, nor research, or a record of our trading prices, or an offer of, or solicitation for a transaction in any financial instrument and thus should not be treated as such. The information provided does not involve any specific investment objectives, financial situation and needs of any specific person who may receive it. Please be aware, that past performance is not a reliable indicator of future performance and/or results. Past Performance or Forward-looking scenarios based upon the reasonable beliefs of the third-party provider are not a guarantee of future performance. Actual results may differ materially from those anticipated in forward-looking or past performance statements. IC Markets makes no representation or warranty and assumes no liability as to the accuracy or completeness of the information provided, nor any loss arising from any investment based on a recommendation, forecast or any information supplied by any third-party.

Tariffs/oil/and interest rates? Bank of Canada is set to meet on dec 11 and Bank of Japan on Dec 19. eyeing both events for further direction. one of the incoming US administrations first order of business of course is releasing the energy. OPEC has just announced it is going to gradually unwind 2.2 million barrels per day through 2026 and the US flooding the market with oil can have a negative effect on Cananda. The cherry on top of course is the fear of incoming 25% tariffs in Canada. lower lows and lower highs below the golden zone would be an ideal entry area.

CAD-JPY Resistance Ahead! Sell!
Hello,Traders!
CAD-JPY went up sharply
But the pair will soon
Hit a horizontal resistance
Of 107.716 and after the
Retest we will be expecting
A local bearish move down
Sell!
Comment and subscribe to help us grow!
Check out other forecasts below too!

CAD JPY Entry Setup 30 mins timeframe.30 mins Supply Zone
Lets wait for price to pull into the 30 mins supply zone, we will enter based off candlesticks confirmations.

#002 NEW DCA CADJPY SHORT RangeThis is a setup I revisited now, now that price has come back to the resistance level of the range.
I spotted this setup yesterday and have placed a sell limit order for it but price didn't take it before moving downwards. I have since then removed the sell limit.
Even though I have another position that buys JPY, but the price movement seems different.
I do not want to think much about it. I am talking more just for the sake of filling up the word count. I think that the more one talks the more they think and the complexity of shet increases, and when the boiling point of drawdown reaches the moon, we blow the account.
So, I will try to talk less.
More pictures. Less talk.
0040SGT 11122024

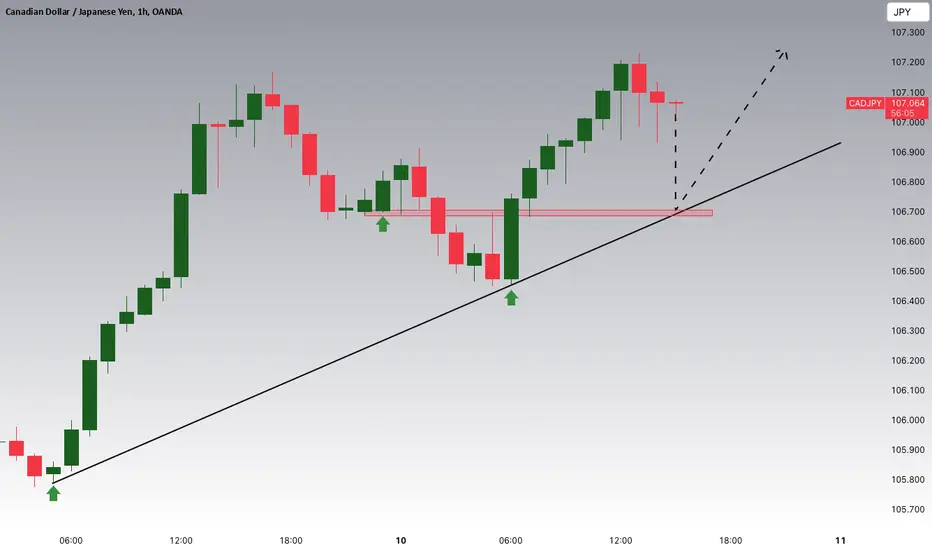
CADJPY Potential UpsidesHey Traders, in today's trading session we are monitoring CADJPY for a buying opportunity around 106.700 zone, CADJPY is trading in an uptrend and currently is in a correction phase in which it is approaching the trend at 106.700 support and resistance area.
Trade safe, Joe.