JPYCAD trade ideas

CAD/JPY Bank Heist: Bullish Breakout (or) Bearish Trap?🌟 Hi! Hola! Ola! Bonjour! Hallo! Marhaba! 🌟
Dear Money Makers & Market Robbers, 🤑💰💸✈️
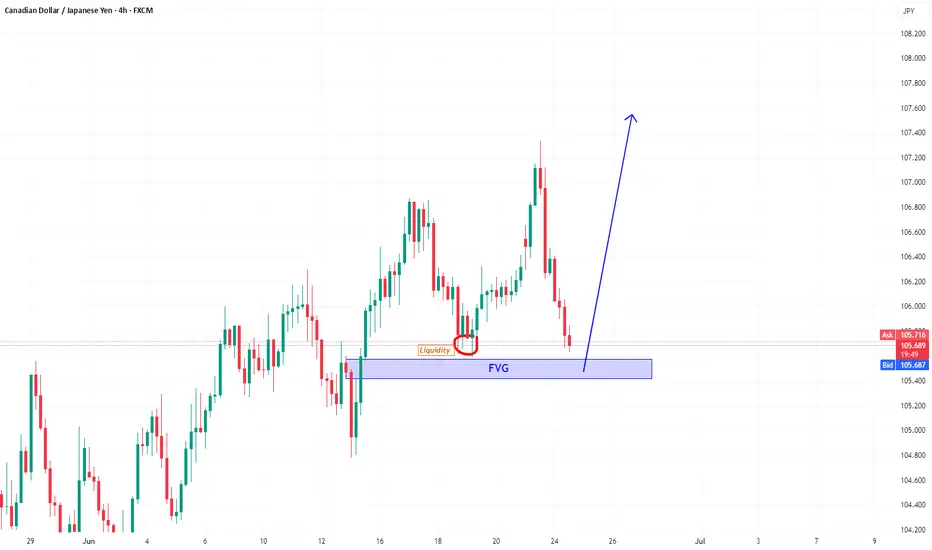
Based on the 🔥Thief Trading Style🔥, here’s our master plan to loot the CAD/JPY "Loonie-Yen" Forex Bank Heist! Follow the strategy on the chart—Long Entry is the play. Our escape? Near the high-risk Danger Resistance Zone. It’s a risky level—overbought, consolidating, potential reversal—where bearish robbers lurk. 🏆💸 Take profits fast, traders! You earned it! 💪🎉
📈 Entry: The Heist Begins!
Wait for the breakout above 105.700—then strike! Bullish profits await.
Buy Stop Orders above Moving Average OR
Buy Limit Orders (15-30min timeframe) near swing lows/highs for pullback entries.
📌 Set an ALERT! Don’t miss the breakout.
🛑 Stop Loss: Protect Your Loot!
🔊 Yo, listen up! 🗣️
Buy Stop Orders? Don’t set SL until after breakout.
Place SL at nearest/swing low (4H timeframe)—adjust based on your risk & lot size.
Rebels, set SL wherever… but don’t cry later! 🔥⚡
🎯 Target: 107.300
Scalpers: Only go LONG. Use trailing SL to lock in gains.
Swing Traders: Ride the wave or join late—robbery is teamwork! 🤝
💥 Why CAD/JPY? Bullish Momentum!
Fundamentals, COT Reports, Sentiment, Intermarket Trends—checkk our bio for full analysis. 🔗🔗🔗
⚠️ Trading Alert: News = Danger!
Avoid new trades during news.
Use trailing stops to protect profits.
💖 Support the Heist! Hit the BOOST Button!
More boosts = More robberies = More profits! 💰🚀
Stay tuned—next heist coming soon! �🤗🎉

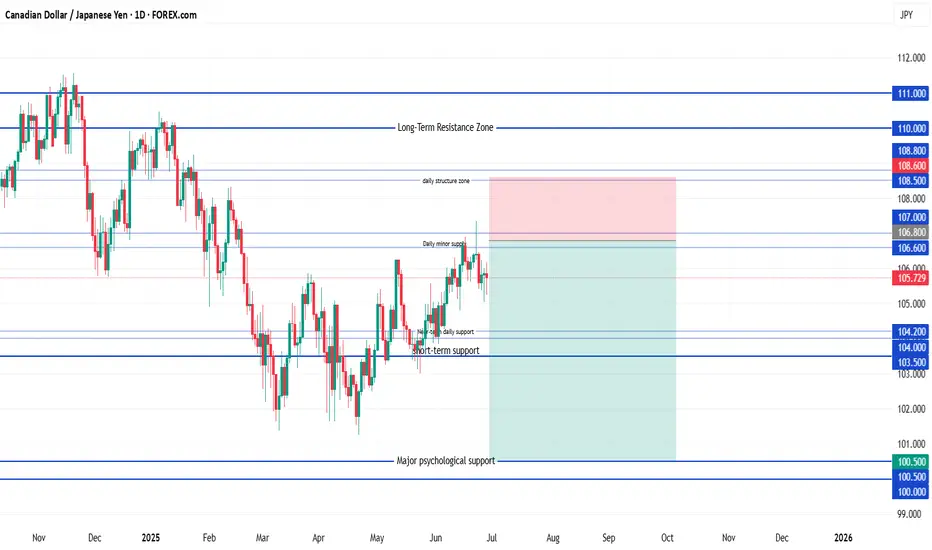
CAD/JPY ShortSell Limit Entry: 106.80
(Just under the resistance trap zone: 106.60–107.00)
Stop Loss: 108.60
Target 1: 104.20
(First minor support zone)
Target 2: 103.00
(Deeper support + recent structure base)
Target 3 (Optional hold): 100.50
(Long-term structural support zone)
CADJPYdepending on how the upcoming price action work out, I am expecting to see another drop around the box

CADJPY SELLBy utilizing levels, historical patterns, , we can formulate a hypothesis that the market might follow a similar trajectory if bearish sentiment prevails.

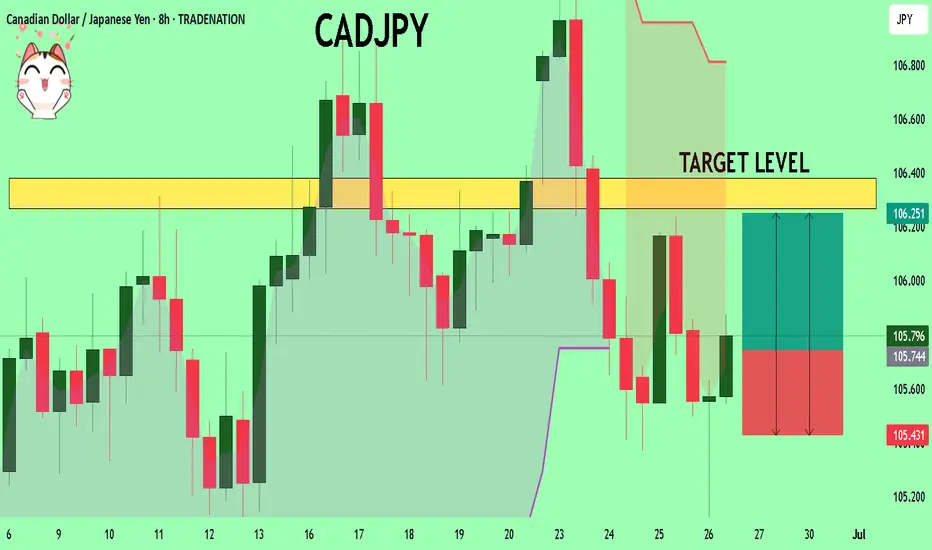
CADJPY What Next? BUY!
My dear friends,
Please, find my technical outlook for CADJPY below:
The instrument tests an important psychological level 105.74
Bias - Bullish
Technical Indicators: Supper Trend gives a precise Bullish signal, while Pivot Point HL predicts price changes and potential reversals in the market.
Target - 106.26
Recommended Stop Loss - 105.43
About Used Indicators:
Super-trend indicator is more useful in trending markets where there are clear uptrends and downtrends in price.
Disclosure: I am part of Trade Nation's Influencer program and receive a monthly fee for using their TradingView charts in my analysis.
———————————
WISH YOU ALL LUCK
Long CJ upon retracementCJ has rejected in reversal price signal in a lower equidistant channel. I am expecting price retrace it, perform a buy buy buy at fibo 38.2, 50, and 61.8%, projected to the highest supply.

CADJPY - Looking To Sell Pullbacks In The Short TermM15 - Strong bearish move.
No opposite signs.
Currently it looks like a pullback is happening.
Expecting bearish continuation until the two Fibonacci resistance zones hold.
If you enjoy this idea, don’t forget to LIKE 👍, FOLLOW ✅, SHARE 🙌, and COMMENT ✍! Drop your thoughts and charts below to keep the discussion going. Your support helps keep this content free and reach more people! 🚀
--------------------------------------------------------------------------------------------------------------------

CADJPY Bearish Breakout!
HI,Traders !
#CADJPY made a bearish
Breakout of the rising support
Which is a resistance now and
The breakout is confirmed
So we are bearish biased
And we will be expecting
A further bearish move down !
Comment and subscribe to help us grow !

CADJPY - BEARISH MOVEHello Traders !
The CADJPY failed to create a new higher high!
The higher low is broken (change o character).
So, I expect a bearish move📉
______________
TARGET: 104.450🎯

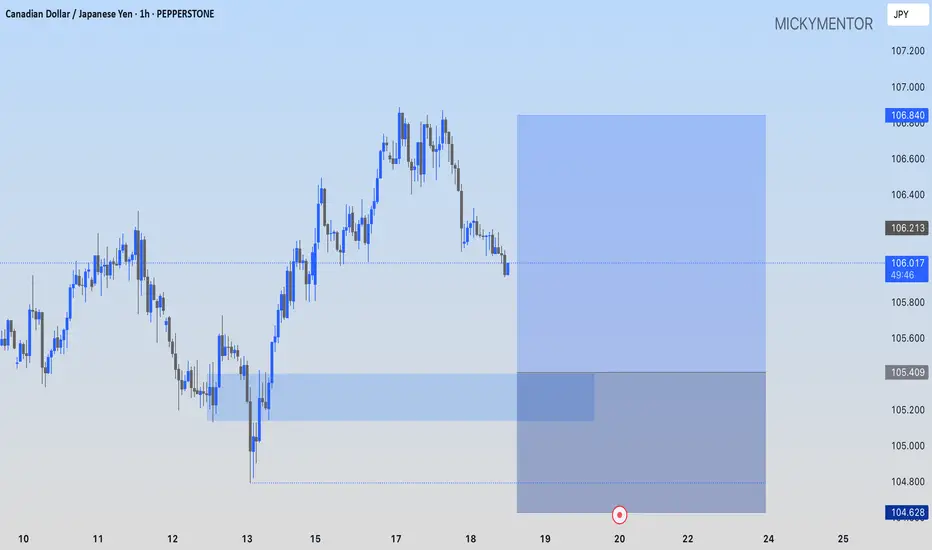
CADJPY: LOADING UP SOME BUYS AT 105.409PEPPERSTONE:CADJPY I'm going long at 105.409, targeting 106.840
Bullish idea on CADJPYWe see price coming our bullish poi. Bullish engulfing candle stick on the 4hr & the 1hr time frame. Now we wait for our ctl that we draw on the 5-15 min to continue scaling in 🤝🏽

CADJPY at Support Enter once support breaks and retests The pair is moving within a well-formed ascending channel (A–F structure). Recent price action from point F to G shows a sharp rejection from the channel top, and price is now testing the lower trendline support.


CADJPY long movePrice is currently moving towards our demand zone, any bullish reaction at this level cloud leads to upwards movement.
CADJPY Wave Analysis – 24 June 2025- CADJPY reversed from the resistance area
- Likely to fall to support level 104.75
CADJPY currency pair recently reversed down from the resistance area between the resistance level 106.85, the upper daily Bollinger Band and the 50% Fibonacci correction of the extended downward impulse from November.
The downward reversal from this resistance area created the daily Japanese candlesticks reversal pattern Shooting Star, which stopped the previous minor impulse wave 3.
Given the strength of the resistance level 106.85, CADJPY currency pair can be expected to fall to the next support level 104.75 (which reversed the pair earlier this month).

CADJPYHaigh Bullish opportunity.
Price will rebound from FVG area which never touch before ,Also will sweep the previous liquidity which not taken before
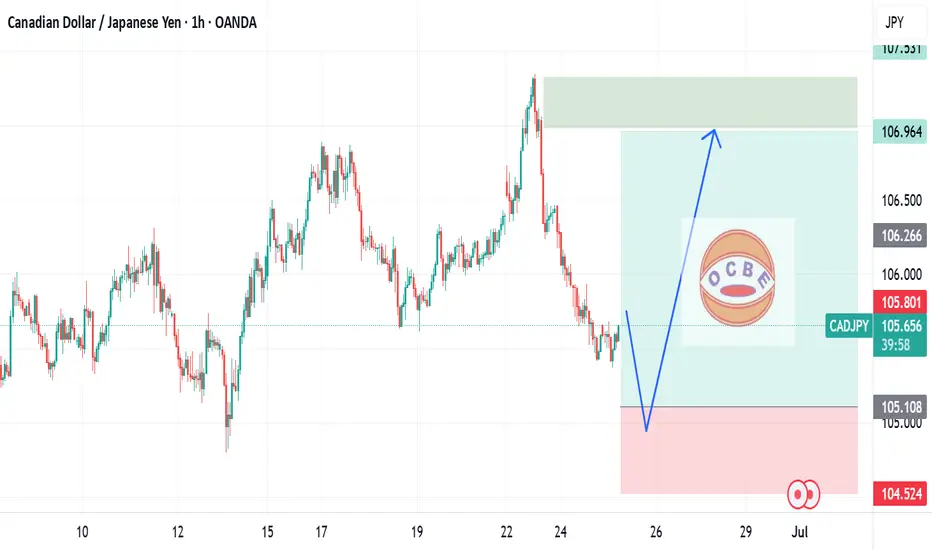
CADJPY..BUY📈 On the daily timeframe, CADJPY is in a clear uptrend.
🔁 After a healthy correction, price has reached our key support level, and I’m ready to enter a long position here.
⚠️ As always, if this level breaks and the market moves against us,
I’ll open a risky short trade until we reach the next buy zone.
📉 The market does whatever it wants—nothing is guaranteed.
✅ We’re here to use smart risk management and make profit in every possible scenario.
For detailed entry points, trade management, and high-probability setups, follow the channel:
ForexCSP

CAD/JPY Holds Trendline Support with Bullish Bias IntactFenzoFx—CAD/JPY dipped from 107.34, finding support at a bullish FVG while staying above the ascending trendline.
The Stochastic Oscillator signals oversold, suggesting a potential reversal. The outlook remains bullish above 105.61, targeting a retest of 107.35. A break below 105.61 would invalidate the bullish scenario.

Trade Idea: Sell CADJPY (Short-Term Risk-Off Play) **📉 Trade Idea: Sell CADJPY (Short-Term Risk-Off Play)**
**Bias:** 🔻 Bearish (Short-Term) | ⚖️ Medium-Term Neutral
**Idea:** Yen getting a safety bid, CAD softening — charts hint a cool-off is coming
---
### **💡 Why Sell?**
**🇯🇵 JPY Getting Support:**
* Risk-off tone is helping the yen hold ground 🛡️
* Inflation still above 3.5% = not as soft as BoJ sounds 🧯
* Yen tends to perk up in uncertainty — and we’re not short of that globally 🌍
* Traders cautious = safe-haven flows quietly leaning JPY’s way 🕊️
**🇨🇦 CAD Facing Pressure:**
* Oil pulling back = bad for CAD 🛢️📉
* BoC leaning dovish → interest rate edge fading 🎈
* Global risk jitters + soft data could dent CAD short-term 🧊
---
### **📊 Technical Feel (Objective & Intuitive):**
* **Price looks overextended:** Big moves lately — but candles are losing momentum 🛑
* **Stalling near recent highs:** Feels like buyers ran out of fuel just short of a breakout ⛽
* **RSI cooling off:** Not screaming reversal, but clearly backing off the highs 📉
* **MACD histogram shrinking:** Momentum tapering — not collapsing, just softening 🔻
* **Lower highs forming on intraday charts:** Nothing aggressive — just cracks showing 📉
* **Bearish rejection wicks starting to stack:** Subtle signs of hesitation at the top 🕯️
---
### **⚠️ Invalidation Clue:**
> If price snaps higher with strength and breaks structure — bulls still in control 🔼
> Until then, short-term correction looks likely
---
### **🎯 Summary:**
CADJPY looks due for a breather. Yen is quietly gaining on risk-off, and CAD’s not convincing right now.
Momentum’s fading — and sellers may get a **short-term edge** before trend resumes or stalls.

CadJpy Trade IdeaWith CJ failing to create bullish structures above the previous high and above a level of resistance we could potentially look for price to pullback and retest the level of resistance. We have a clean break of structure on smaller time frames indicating a possible range continuation. Looking for a 1:3rr if all goes well. We'll see what happens.

#CADJPY:1700+ PIPS Swing Concept On The Way,Three Profit TargetsJPY initiated a bearish trend and anticipates a rapid reversal in all JPY pairs, such as CADJPY. We expect a significant swing move, potentially reaching 2000+ pips in the long term. Additionally, we have set three targets based on our analysis, which can aid in identifying potential trade opportunities. Good luck and trade safely.
Good luck and trade safely.
Thanks for your support! 😊
If you want to help us out, here are a few things you can do:
- Like our ideas
- Comment on our ideas
- Share our ideas
Team Setupsfx_
❤️🚀

CADJPY - Important Breakout !Hello Traders !
The CADJPY broke the resistance level (106.312 - 106.032).
This key level becomes new support!
So, I expect a bullish move🚀
______________
TARGET: 107.620🎯
