CADJPY 4H Short Setup📘 Educational Caption for Your Trading Chat
🟥 CADJPY 4H Short Setup (Smart Money Strategy)
I'm currently short on CADJPY from 105.039 after price tapped into a refined supply zone and rejected aggressively, aligning with Smart Money Concepts (SMC) structure.
📉 Entry: 105.039
🎯 Target: 103.258
🛡️ Stop Loss: 105.642
⚖️ Risk-Reward: ~1:2.9 — decent asymmetric opportunity
This trade follows a recent Break of Structure (BOS) and a return to a premium supply area. The market showed signs of distribution before entry, increasing the probability of continuation downward.
🔔 Note: Smart entries rely on refined zones, not impulsive moves. Wait for confirmation, and let the market come to you.
⚠️ Disclaimer: Shared for educational purposes only. Always perform your own analysis and manage risk appropriately.
JPYCAD trade ideas

CAD/JPY ANALYSIS ANOTHER ENTRY This is cad/jpy analysis from four hours time frame, as we can see after price break previous high now price is heading toward demand level a good area for buyers to push the market up again were liquidity is located. Wait for change in character to happen in small times like 30 min before start looking for buying opportunities. Trade safe

CADJPY UpdateAs anticipated, price has rejected the horizontal level and is now pulling back into a key demand zone on the H1–H4 timeframe.
I’m watching this area closely for bullish confirmation to take a long position toward the upper target zone. If bullish price action does not appear and bearish momentum continues, we could see an extended move down toward the weekly 100.00 level.
That said, I currently favor the upside scenario, with the expectation that the highlighted upper zone will be met — but only if the market confirms.
This setup is still theoretical. Patience is key — we trade based on confirmation, not assumption. Stay tuned for updates.

CADJPY SHORTmonthly break of structure and retest break of trend line look for short in lower time frames..

CadjpyI posted this signal few days ago and we have price on our poi so am on a sell on cadjpy I think this isn1 of the trade I posted with my entry so let's ride with it together

CADJPY LongPrice recently broke structure to the upside (BoS), confirming a bullish shift in momentum after forming a double bottom around the 101.50–102.00 region.
Currently, price is consolidating beneath the 104.90–105.00 resistance area, with a clear lower timeframe supply zone just above. If bulls sustain pressure, we could see a short-term rally toward the 106.00 zone, where the next supply awaits.
However, the key level to watch is 107.600, aligning with a major Daily Timeframe Supply Zone. This zone may act as a strong reversal point or profit-taking area for swing traders.

CADJPY SIGNALS BULLISH STRENGTH CADJPY just formed a cup & handle chart pattern which shows there could be a possible buy opportunity from the current market price. A buy opportunity is envisaged. Also, we expect price to trade higher as we begin to see stronger CAD

Good trade On cad/jpy CAD/JPY idea !!!!
Head Shoulder Pattern on cad/jpy
entry 103.978
Tp:103.178
SL:104.378

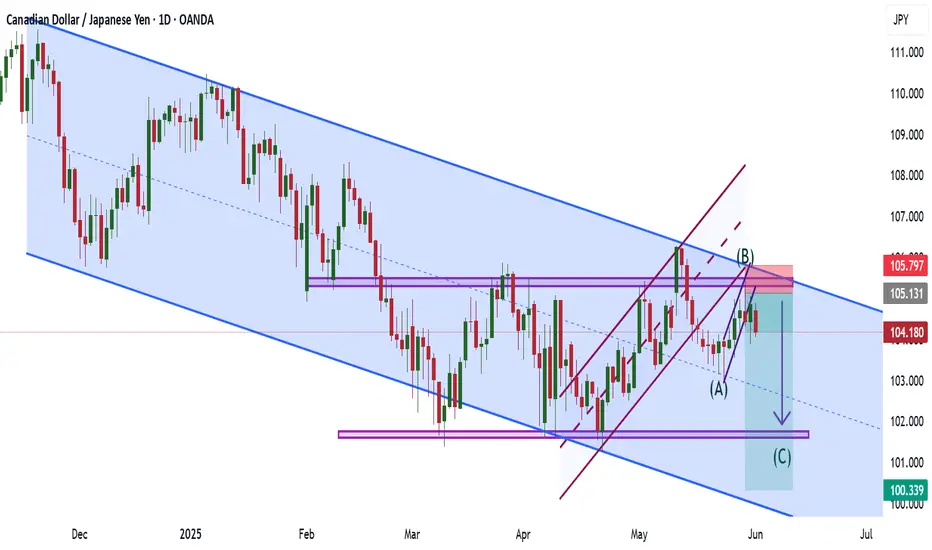
CADJPYJust keep the chart simple. Price is currently on a descending channel, internally, we've seen a breakout from my trendline, a retest on it which holds and I expect price to continue falling, nonetheless, don't forget that price respects the little things that matters within the channel like support and resistance areas.
Cheers!
CJ C-D HARMONIC PATTERN Just an updated look on price action for this pair. Waiting on price to close below support to start looking for shorts. If this does not happen we will begin looking for longs. Lets see how this plays out.
CadJpy Trade Idea UpdateI published a CJ short set up and stated my reasons for looking to go short on the pair. I just personally went short with price sweeping liquidity and retesting an area I was interested in. We even had the 1hr pullback before price gave the bearish engulf for confirmation. If all goes well we should see price dump until it eventually taps back into the weekly low at 103.250. We'll see how price plays out.
CadJpy Trade IdeaCJ at one point broke bullish structures before trying to go back bullish. Once price tried to push back above the HL it crashed back down telling us we could potentially still see the original break of structure play out. I waited for price to retest the break below the HL in order to confirm our overall direction back to the downside. I'll be waiting for price to retest a level of support turning it into resistance while sweeping the liquidity just below the level of retest. We'll see what happens.

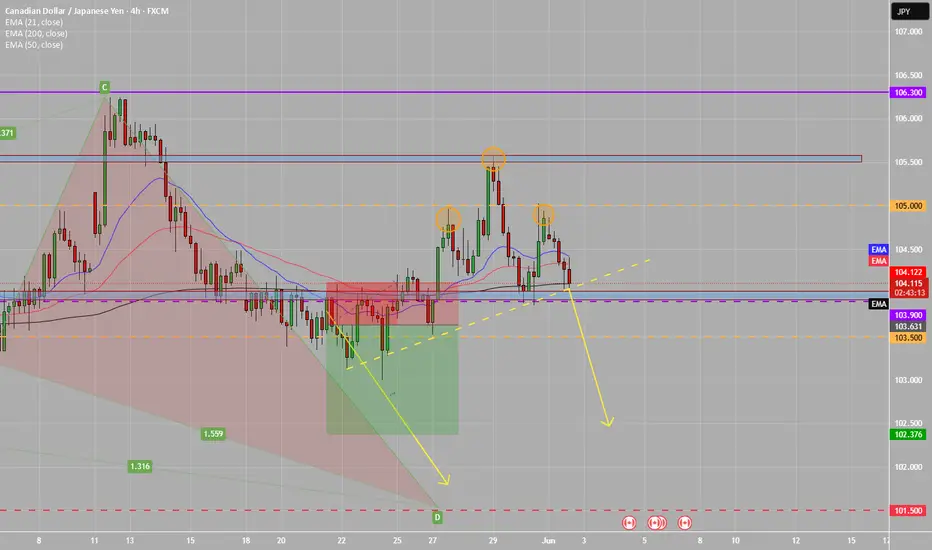
Scenario Cadjpy 02/06/2025English : According to our analysis, we anticipate a bearish scenario.
Morocan Darija : kanchofo d'apres l'analyse dyalna antsanaw hboot
ATENTION : I only share my ideas, not signals

CADJPY My Opinion! BUY!
My dear friends,
Please, find my technical outlook for CADJPY below:
The price is coiling around a solid key level - 104.32
Bias - Bullish
Technical Indicators: Pivot Points High anticipates a potential price reversal.
Super trend shows a clear buy, giving a perfect indicators' convergence.
Goal - 104.57
About Used Indicators:
The pivot point itself is simply the average of the high, low and closing prices from the previous trading day.
Disclosure: I am part of Trade Nation's Influencer program and receive a monthly fee for using their TradingView charts in my analysis.
———————————
WISH YOU ALL LUCK

CAD/JPY BEARISH BIAS RIGHT NOW| SHORT
Hello, Friends!
We are going short on the CAD/JPY with the target of 102.555 level, because the pair is overbought and will soon hit the resistance line above. We deduced the overbought condition from the price being near to the upper BB band. However, we should use low risk here because the 1W TF is green and gives us a counter-signal.
Disclosure: I am part of Trade Nation's Influencer program and receive a monthly fee for using their TradingView charts in my analysis.
✅LIKE AND COMMENT MY IDEAS✅

POTENTIAL SELLS ON CADJPYLooking at a 1H head and shoulder pattern on CADJPY. liquidity swept. targeting lows. 1:8

CADJPY BULLISH OR BEARISH DETAILED ANALYSISCADJPY has successfully broken out of a well-defined falling wedge pattern, confirming a bullish reversal setup on the daily timeframe. Price action has not only cleared the descending trendline but has also completed a clean retest of the breakout zone near 104.000–104.500. This retest held firmly, showing strong buyer interest, and the pair is now poised for a continuation toward the next key resistance level around 110.000. The technical structure is now favoring bulls, with momentum shifting upward after a prolonged corrective phase.
Fundamentally, the Canadian dollar is gaining strength supported by rising crude oil prices and stronger-than-expected economic data from Canada. The Bank of Canada’s recent tone remains relatively hawkish compared to other central banks, which adds further support to CAD. Meanwhile, the Japanese yen continues to remain under pressure due to the Bank of Japan's ultra-loose monetary policy stance. With Japan’s inflation struggling to sustain above target, the BOJ is showing no urgency to tighten, which keeps JPY weak against higher-yielding currencies like CAD.
The breakout from the falling wedge is also being supported by volume and bullish daily candles, suggesting a solid shift in market sentiment. The pair has formed a higher low and higher high, officially transitioning into a bullish structure. With the retest of the breakout structure now complete, there’s a high probability for continuation toward 108.000 initially and a full extension to 110.000 in the coming weeks.
Traders should closely monitor any dips as potential buying opportunities as long as CADJPY holds above 103.500–104.000 support. The reward-to-risk ratio remains favorable for swing traders aiming for medium-term targets. With strong technical confirmation, supportive fundamentals, and risk appetite returning to markets, CADJPY is setting up for a potentially profitable bullish wave.

CadjpyCadjpy I didn't post this trade cause not all my trade I post online I just take some on my own self but am expecting a possible bearish movement cause the buy earlier was for a retracment so expecting a bearish movement soon

CADJPY SELL IDEA-The daily chart is showing a Head and shoulders pattern, with the right shoulder complete, as indicated by the last daily close.
- H4 is also showing a Head and Shoulders Pattern with the right shoulder complete. Additionally, Price reached a major supply zone (Circled areas) and fell, forming a head pattern and a lower high.
- Price has formed a lower high and lower low on H1, and the last candle's close was an inverse bearish pin bar.
Risk - 40 pips
Reward - 159 pips

CADJPY higher bullish for expect
OANDA:CADJPY price is make push on trend line and ROUNDED BOTTOM pattern is be created on trend line, with zone inside, which are also breaked.
Here for next week, bullish continuation to expect.
SUP zone: 104.250
RES zone: 106.000, 106.350

POSSIBLE MOVE FOR CADJPY This is cad/jpy analysis, as we can see market overall is in uptrend by creating higher high and higher low. At the moment price is at demand level a good area to start looking for buying opportunities also we see price has already clear imbalances. Take a look one hour

CAD_JPY LONG FROM SUPPORT|
✅CAD_JPY has been falling recently
And the pair seems locally oversold
So as the pair is approaching
A horizontal support of 104.200
Price growth is to be expected
LONG🚀
✅Like and subscribe to never miss a new idea!✅
Disclosure: I am part of Trade Nation's Influencer program and receive a monthly fee for using their TradingView charts in my analysis.

CADJPY - NEW BREAKOUT !Hello Traders !
The CADJPY price formed a descending channel.
Currently, The resistance line is broken !
So, I expect a bullish move🚀
_______________
TARGET: 105.390🎯
