CHFJPY: Bullish Rally ContinuesI see another bullish pattern on 📈CHFJPY, this time in the form of an ascending triangle formation.
The price has broken above the neckline and closed higher, indicating a strong uptrend.
This pattern suggests that there is a high likelihood of continued growth, with the next resistance level at 172.
JPYCHF trade ideas

CHFJPY: Bearish Continuation & Short Signal
CHFJPY
- Classic bearish formation
- Our team expects pullback
SUGGESTED TRADE:
Swing Trade
Short CHFJPY
Entry - 170.83
Sl - 171.63
Tp - 169.26
Our Risk - 1%
Start protection of your profits from lower levels
Disclosure: I am part of Trade Nation's Influencer program and receive a monthly fee for using their TradingView charts in my analysis.
❤️ Please, support our work with like & comment! ❤️

CHF/JPY For Bullishwait for pull-back near by entry point and then go long
general trend is up trend
JPY is Weak
have fun :)

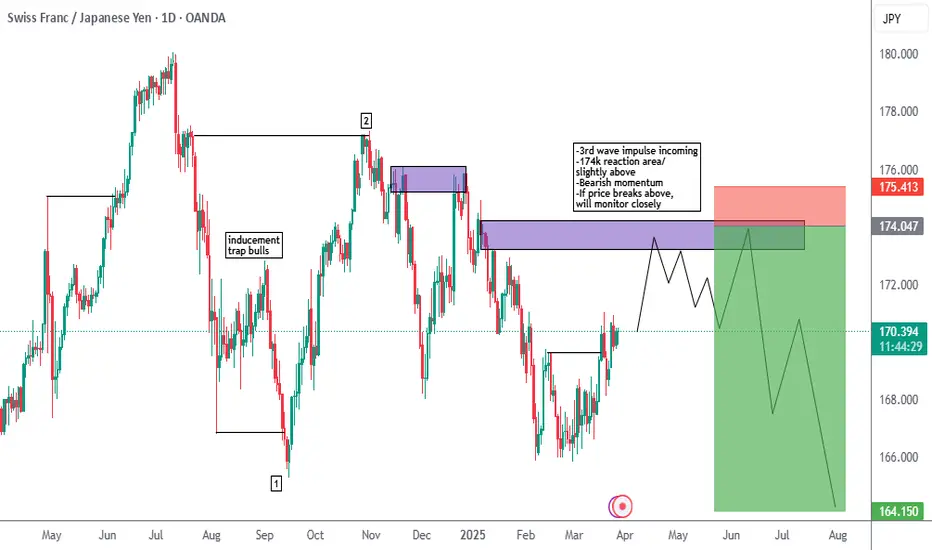
CHFJPY LONGHi traders, watch as I closely monitor and forecast the overall structure:
-3rd wave incoming
-174k reaction area/
slightly above
-bearish momentum
-supply areas
-bullish probability
Please drop a like, comment and follow my channel if you want to see more of this exceptional analysis!
CHF/JPY Triangle Pattern (27.3.25)The CHF/JPY Pair on the M30 timeframe presents a Potential Selling Opportunity due to a recent Formation of a Triangle Pattern. This suggests a shift in momentum towards the downside in the coming hours.
Possible Short Trade:
Entry: Consider Entering A Short Position around Trendline Of The Pattern.
Target Levels:
1st Support – 169.06
2nd Support – 168.46
🎁 Please hit the like button and
🎁 Leave a comment to support for My Post !
Your likes and comments are incredibly motivating and will encourage me to share more analysis with you.
Best Regards, KABHI_TA_TRADING
Thank you.

Bull flag CHF JPY Entry
1pm 26/03/2025
Bull flag with pole
fib 78.6
CHFJPY currency pair recently broke the resistance zone lying at the intersection of the resistance level 169.50 (former upward correction top from February) and the 38.2% Fibonacci correction of the sharp downward impulse from December.

BUY CHFJPYCHFJPY looks like a nice bullish flag pattern has been formed. The resistance was broken and retested, but now towards 173,5 and above

CHF/JPY BEARS ARE STRONG HERE|SHORT
Hello, Friends!
The BB upper band is nearby so CHF-JPY is in the overbought territory. Thus, despite the uptrend on the 1W timeframe I think that we will see a bearish reaction from the resistance line above and a move down towards the target at around 169.610.
Disclosure: I am part of Trade Nation's Influencer program and receive a monthly fee for using their TradingView charts in my analysis.
✅LIKE AND COMMENT MY IDEAS✅

CHFJPY The Target Is DOWN! SELL!
My dear followers,
I analysed this chart on CHFJPY and concluded the following:
The market is trading on 169.95 pivot level.
Bias - Bearish
Technical Indicators: Both Super Trend & Pivot HL indicate a highly probable Bearish continuation.
Target - 168.83
Safe Stop Loss - 170.67
About Used Indicators:
A super-trend indicator is plotted on either above or below the closing price to signal a buy or sell. The indicator changes color, based on whether or not you should be buying. If the super-trend indicator moves below the closing price, the indicator turns green, and it signals an entry point or points to buy.
Disclosure: I am part of Trade Nation's Influencer program and receive a monthly fee for using their TradingView charts in my analysis.
———————————
WISH YOU ALL LUCK

CHFJPY 1H TimeFrame BuyCHFJPY is bullish on higher Timeframes like 4H.
we expect a little correction and another bullish movements


CHFJPY Breaking the resistance ?CHFJPY was rejected from this area no making another attempt to break the resistance. will it be successful. enter the trade when it retests the resistance

CHFJPY I Wait for Correction and More GrowthWelcome back! Let me know your thoughts in the comments!
** CHFJPY Analysis - Listen to video!
We recommend that you keep this pair on your watchlist and enter when the entry criteria of your strategy is met.
Please support this idea with a LIKE and COMMENT if you find it useful and Click "Follow" on our profile if you'd like these trade ideas delivered straight to your email in the future.
Thanks for your continued support!Welcome back! Let me know your thoughts in the comments!

CHFJPY Possible Trend Continuation Hi Traders, here's my breakdown on FOREXCOM:CHFJPY for a potential sell trade .
So we've basically run into structure supply, LTF Flip.
Entry model : Breaker +Inducement + RTBb
Let's hope we get triggered, and most importantly, don't get stopped out lol
#Stay Reactive.
LIKE & FOLLOW
CHF/JPY For Bullishyou can go long now
or
wait for pull-back near by entry point and then go long
general trend is up trend
have fun :)

CHFJPY: Pullback Trade From Key LevelAnother pair that appears attractive for buying at a key support level is 📈CHFJPY.
Following a test of an important intraday structure, the price has formed a cup & handle pattern.
A bullish breakout above its neckline serves as a solid bullish confirmation.
It is likely that the pair will continue to climb and reach the 170.24 level in the near future.

CHFJPY is in a Bearish Structure after Breaking the SupportHello Traders
In This Chart CHFJPY HOURLY Forex Forecast By FOREX PLANET
today CHFJPY analysis 👆
🟢This Chart includes_ (CHFJPY market update)
🟢What is The Next Opportunity on CHFJPY Market
🟢how to Enter to the Valid Entry With Assurance Profit
This CHART is For Trader's that Want to Improve Their Technical Analysis Skills and Their Trading By Understanding How To Analyze The Market Using Multiple Timeframes and Understanding The Bigger Picture on the Charts

CHFJPY sell opportunity setting upHello,
A potential selling opportunity is setting up on the CHFJPY pair on the 45-minute chart. The pair is currently forming a corrective pattern, as shown in the analysis, and is approaching the moving average—signaling a potential continuation of the downtrend.
Additionally, the MACD indicator has just registered a zero-line crossover, further strengthening the bearish outlook.
For risk management, consider placing a stop loss just above the previous correction level, around 169.62, to mitigate potential reversals.
Disclosure: I am part of Trade Nation's Influencer program and receive a monthly fee for using their TradingView charts in my analysis.
Good luck!

CHFJPY: Trend Channel Collapse Signals Bearish ShiftTrend Channel Breakdown: The chart clearly shows a previously established upward trend channel that has been decisively broken to the downside. This indicates a potential shift in momentum from bullish to bearish.
Key Levels:
The 169.328 level has been breached, suggesting it may now act as resistance.
Potential support levels are identified at 167.656 and the low of 166.607.
Bearish Momentum: The sharp downward movement following the trendline break suggests strong bearish momentum.
Timeframe: The 1-hour timeframe focuses on short-term price action.

CHFJPY Potential DownsidesHey Traders, in today's trading session we are monitoring CHFJPY for a selling opportunity around 169 zone, CHFJPY is trading in a downtrend and currently is in a correction phase in which it is approaching the trend at 169 support and resistance area.
Trade safe, Joe.

CHFJPY Bearish Momentum: Technical and Fundamental InsightsCHFJPY Bearish Momentum: Technical and Fundamental Insights"
Technical Analysis:
CHFJPY has entered a strong bearish phase following the breakout from an aggressive Ascending Channel Pattern. This breakout signals the potential for further price declines. After any minor corrections, CHFJPY is likely to continue its downward trajectory. Key target levels to watch in the coming days are 167.70 and 166.70, as the bearish momentum remains robust and aggressive.
Fundamental Analysis:
Yesterday, the Bank of Japan (BoJ) maintained its interest rates at 0.5%. Meanwhile, today, the Swiss National Bank (SNB) announced a rate cut of 25 basis points, bringing its rates down to 0.25%.
For the first time in three years, a significant gap has emerged between the interest rates of these two safe-haven currencies. This divergence could further weigh on CHFJPY. If the SNB refrains from intervening in the forex market, we may see continued downward pressure on the pair.
You may find more details in the chart!
Thank you and Good Luck!
❤️PS: Please support with a like or comment if you find this analysis useful for your trading day❤️
Disclosure: I am part of Trade Nation's Influencer program and receive a monthly fee for using their TradingView charts in my analysis.

CHF/JPY Trend Shift? More Upside AheadCHF/JPY was in a downtrend for a long time, continuously moving lower. But when it hit support at 166.00, the price stopped falling, and buyers stepped in, pushing it back up. This level became a key turning point, preventing further drops.
After bouncing from 166.00, CHF/JPY started showing signs of going up and even broke above the trendline that was holding it down. This breakout is a sign that the market may be changing from a downtrend to an uptrend, meaning the price could keep rising.
With this breakout, our first target is 169.60, which is a resistance level where the price might slow down or take a break before moving higher. If buyers stay strong, our second target is 170.95, another important level where the price could face some resistance.

CHFJPY Wave Analysis – 18 March 2025
- CHFJPY broke resistance zone
- Likely to rise to resistance level 172.00
CHFJPY currency pair recently broke the resistance zone lying at the intersection of the resistance level 169.50 (former upward correction top from February) and the 38.2% Fibonacci correction of the sharp downward impulse from December.
The breakout of this resistance zone accelerated the active upward correction from the major support level 166.70.
CHFJPY currency pair can be expected to rise to the next resistance level 172.00 (which reversed the pair at the end of January).
