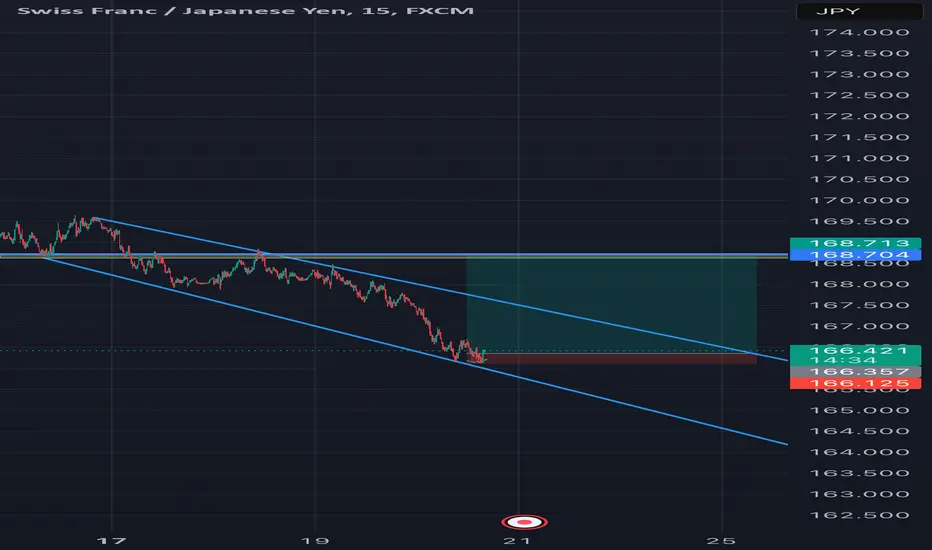
CHFJPYCHFJPY price is in the consolidation phase. Currently, the price is near the support zone of 166.27-166.03. If the price cannot break through the 166.03 level, it is expected that in the short term, there is a chance that the price will rebound. Consider buying the red zone.
🔥Trading futures, forex, CFDs and stocks carries a risk of loss.
Please consider carefully whether such trading is suitable for you.
>>GooD Luck 😊
❤️ Like and subscribe to never miss a new idea!
JPYCHF trade ideas

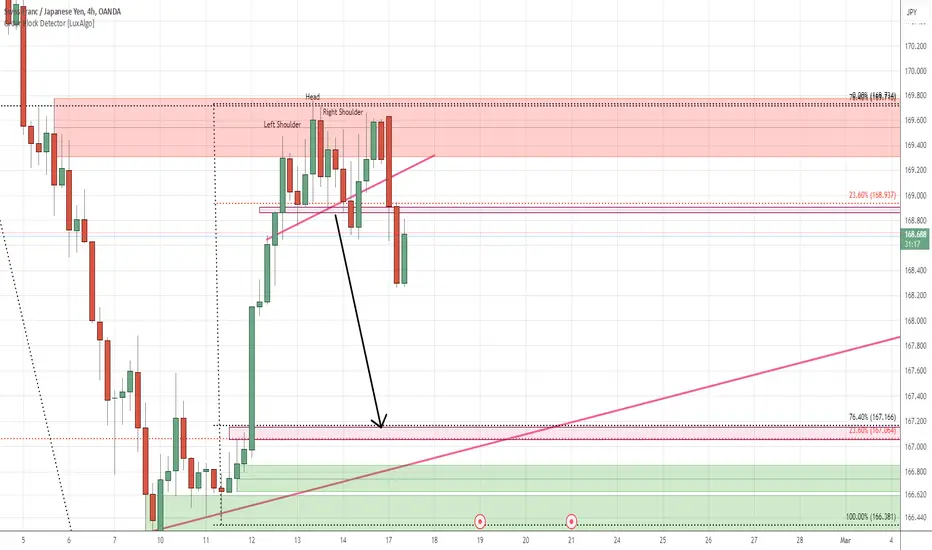
CHFJPY POSSIBLE NEXT MOVE!CHFJPY currently break down of traingle and trade and down side of traingle now market will going to retest this traingle resistance and make any candle that show bearish momentum and break thier low so we will see downward market will going.
Remember! The result of your past trades, whether they were winning or losing ones, shouldn’t affect how you handle your next positions.

CHFJPY is BullishPrice was in a downtrend, however now it seems that bulls are trying to assume control of the price action as bullish divergence has emerged on both hourly and four hourly time frames. If previous lower high is broken successfully then we can expect a bullish rally as per Dow theory. Targets are mentioned on the chart.

CHF/JPY "Swiss vs Japanese" Forex Market Heist Plan🌟Hi! Hola! Ola! Bonjour! Hallo! Marhaba!🌟
Dear Money Makers & Thieves, 🤑 💰🐱👤🐱🏍
Based on 🔥Thief Trading style technical and fundamental analysis🔥, here is our master plan to heist the CHF/JPY "Swiss vs Japanese" Forex market. Please adhere to the strategy I've outlined in the chart, which emphasizes long entry. Our aim is the high-risk Red Zone. Risky level, overbought market, consolidation, trend reversal, trap at the level where traders and bearish robbers are stronger. 🏆💸Book Profits wealthy and safe trade.💪🏆🎉
Entry 📈 : "The heist is on! Wait for the MA breakout (169.000) then make your move - Bullish profits await!"
however I advise to Place Buy stop orders above the Moving average (or) Place buy limit orders within a 15 or 30 minute timeframe most recent or swing, low or high level.
I Highly recommended you to put alert in your chart.
Stop Loss 🛑:
Thief SL placed at the recent / nearest low level Using the 3H timeframe (167.500) swing trade basis.
SL is based on your risk of the trade, lot size and how many multiple orders you have to take.
Target 🎯:
Primary Target - 171.000 (or) Escape Before the Target
Secondary Target - 174.000 (or) Escape Before the Target
🧲Scalpers, take note 👀 : only scalp on the Long side. If you have a lot of money, you can go straight away; if not, you can join swing traders and carry out the robbery plan. Use trailing SL to safeguard your money 💰.
📰🗞️Fundamental, Macro, COT, Sentimental Outlook:
CHF/JPY "Swiss vs Japanese" Forex Market is currently experiencing a bullish trend,., driven by several key factors.
🟡Fundamental Analysis
Fundamental factors driving CHF/JPY stem from the Swiss and Japanese economies, central bank policies, and safe-haven dynamics.
╰┈➤Interest Rates:
Swiss National Bank (SNB): Rates likely at 0.75-1% in Feb 2025, down from 1.25% in 2024, reflecting global easing. Negative real yields (e.g., -1.5% with 2.5% inflation) bolster CHF’s safe-haven status.
Bank of Japan (BoJ): Rates at 0.25-0.5%, a cautious hike from near-zero, but still a funding currency. Yield differential favors CHF slightly.
Impact: Mildly bullish for CHF/JPY, as CHF retains a yield edge.
╰┈➤Inflation:
Switzerland: Inflation at 2-2.5%, above SNB’s 0-2% target, prompting potential currency strength to curb import costs.
Japan: Inflation at 2.5%, high for Japan, but BoJ tolerance limits JPY gains.
Impact: Neutral to bullish, favoring CHF resilience.
╰┈➤Economic Growth:
Switzerland: GDP growth ~1.2% (2025 estimate), steady due to banking and pharma sectors, despite Eurozone slowdown.
Japan: GDP ~1%, export-driven (e.g., U.S. tariff diversion), but domestic weakness persists.
Impact: Mildly bullish, CHF edges out JPY in stability.
╰┈➤Safe-Haven Flows:
Both CHF and JPY are safe-havens, but CHF benefits more from European risks (e.g., Eurozone PMI at 46.2, Feb 2025) vs. JPY’s Asia-centric exposure.
Impact: Bullish for CHF/JPY in risk-off scenarios.
╰┈➤Trade Balance:
Switzerland: Surplus ~CHF 4B monthly, driven by exports (watches, pharma).
Japan: Surplus ~¥1.5T, but vulnerable to U.S. tariffs.
Impact: Neutral, both currencies supported.
🟠Macroeconomic Factors
A U.S.-focused lens with global context:
╰┈➤U.S. Influence: Fed rates at 3-3.5%, DXY ~100. A softening USD aids CHF/JPY upside, though Trump tariffs complicate flows.
╰┈➤Global Growth: 3% (Morgan Stanley), with China at 4.5% (slowing) and Eurozone at 1.2%. Risk-off favors CHF over JPY.
╰┈➤Commodity Prices: Oil at $70.44 (FXStreet) pressures Japan’s import costs, mildly weakening JPY.
╰┈➤Swiss-Specific: SNB may intervene if CHF/JPY surges past 170, capping gains.
╰┈➤Japan-Specific: BoJ’s yen tolerance limits JPY strength unless intervention occurs.
🟤Commitments of Traders (COT) Data
Hypothetical COT (mid-Feb 2025, CME):
╰┈➤Large Speculators: Net long CHF (30,000 contracts), net short JPY (150,000), suggesting CHF strength vs. JPY weakness.
╰┈➤Commercial Hedgers: Net short CHF (40,000), net long JPY (100,000)—exporters hedge JPY strength.
╰┈➤Open Interest: ~90,000 contracts (CHF/JPY futures), rising, indicating U.S. trader interest.
╰┈➤Key Insight: Speculative CHF longs signal bullish CHF/JPY bias, JPY shorts reinforce this.
🔴Market Sentiment Analysis
Includes retail, institutional, and corporate traders:
╰┈➤Retail Sentiment: U.S. retail traders likely 65% long CHF/JPY at 167.000 (hypothetical broker data), expecting safe-haven CHF gains. Contrarian risk if shorts pile in.
╰┈➤Institutional Traders: U.S./European funds (e.g., UBS, per Dec 2024) favor CHF (USD/CHF to 0.84 by 2025), neutral on JPY (USD/JPY to 145). Bullish CHF/JPY sentiment persists.
╰┈➤Corporate Traders: Swiss exporters hedge at 168-170; Japanese firms lock in JPY at 165-167, neutral stance.
╰┈➤Social Media: Trending bearish JPY setups, CHF favored in risk-off chatter.
╰┈➤Broker Data: U.S. IG sentiment ~60% long—mild overcrowding.
🟣Positioning Analysis
╰┈➤Speculative: U.S. longs target 170, shorts eye 165.
╰┈➤Retail Crowding: Longs at 167.500-168.000 risk a flush.
╰┈➤Institutional: Balanced, leaning bullish on CHF strength.
╰┈➤Corporate: Hedging stabilizes near-term moves.
🟢Overall Summary Outlook
CHF/JPY at 167.000 reflects CHF’s safe-haven edge over JPY amid U.S. tariff risks and global slowdown fears. Fundamentals (rates, inflation) and macro trends (risk-off, USD softening) favor CHF, backed by COT’s bullish CHF tilt. Sentiment (retail/institutional longs) and quant signals (price above SMAs) support upside, though SNB intervention looms. Short-term bullish to 168.50-170.00, medium-term range-bound with a bullish bias.
⚠️Trading Alert : News Releases and Position Management 📰 🗞️ 🚫🚏
As a reminder, news releases can have a significant impact on market prices and volatility. To minimize potential losses and protect your running positions,
we recommend the following:
Avoid taking new trades during news releases
Use trailing stop-loss orders to protect your running positions and lock in profits
💖Supporting our robbery plan will enable us to effortlessly make and steal money 💰💵 Tell your friends, Colleagues and family to follow, like, and share. Boost the strength of our robbery team. Every day in this market make money with ease by using the Thief Trading Style.🏆💪🤝❤️🎉🚀
I'll see you soon with another heist plan, so stay tuned 🤑🐱👤🤗🤩


CHFJPY: Pullback From Support 🇨🇭🇯🇵
CHFJPY looks bullish after a test of a key horizontal support.
As a confirmation, I identified a double bottom pattern
on an hourly.
Its neckline was violated with the market opening today.
I believe that the pair will continue rising at least to 167.0 level.
❤️Please, support my work with like, thank you!❤️

potential trend reversal / buy on chfjpyTREND REVERSAL
double bottom
ChfJPY has been falling for a while now; its currently at a major support on Hourly and daily timeframe and it might be a chance for a reversal

CHF/JPYOn Daily chart,
in the past 20 days, there have been multiple atempt to break the 166.00 Psychological Support/Resistant and it failed. ther is a great chance to pull back from Bearish move and price is over extended from EMAs.
On 1H chart,
It seems the price is setteling down and getting ready for reversal to 167.500 area.

CHFJPY 1W IdeaPotential for a bearish pullback on the CHHJPY which could lead to a price movement towards the support level at 159.000. SELL zone from 167.500

CHF/JPY – Potential Reversal SetupCHF/JPY – Potential Reversal Setup
The **Swiss Franc/Japanese Yen (CHF/JPY)** pair has been in a downtrend, but recent price action suggests a potential **bullish reversal** is forming.
Key support at **165.059 - 166.234** has held strong, with multiple rejection wicks (highlighted in red ovals), indicating **buying pressure** at these levels.
A **double bottom pattern** is emerging, further strengthening the case for a possible upside move.
The **Fibonacci retracement levels** align with key resistance zones, with **175.632 and 178.814** as major upside targets.
---
## **📈 Bullish Confirmation & Upside Potential:**
✅ Price is bouncing from a **strong support zone** 🚀
✅ A breakout above the **moving average (dynamic resistance)** could trigger further buying momentum
✅ **Risk-to-reward ratio** is favorable for a long setup
---
## **🎯 Key Targets:**
🔹 **First target:** 170.000 (Psychological Level)
🔹 **Second target:** 175.632 (Major Resistance Zone)
🔹 **Final target:** 178.814 (Upper Fibonacci Extension Level)
---
## **🔻 Risk Management:**
❌ **Stop-loss below** 165.059 to protect against further downside
❌ Avoid overleveraging & follow proper **risk-to-reward ratios**

CHF-JPY Long From Support! Buy!
Hello,Traders!
CHF-JPY keeps falling down
But will soon hit a horizontal
Support level of 165.280
And as the pair is locally
Oversold we will be expecting
A local bullish rebound and
And a move up
Buy!
Comment and subscribe to help us grow!
Check out other forecasts below too!

CHF/JPY Analysis | Potential Reversal or Continuation ? CHF/JPY Technical Analysis & Forecast
📉 Market Overview: Swiss Franc / Japanese Yen (CHF/JPY) – 4H Chart : The pair is currently trading within a well-defined descending channel, signaling a sustained bearish trend. The price action has consistently followed a lower high and lower low structure, confirming the prevailing downtrend.
However, recent price movements suggest potential signs of reversal as the pair approaches a key support zone. Let’s dive into the details.
🔍 Key Technical Highlights:
✅ Descending Channel: The market has been respecting a downward sloping trendline, indicating ongoing bearish pressure.
✅ Major Support Zone: The pair has tested a crucial quarter fulfillment level, a historically strong support area.
✅ Double Bottom Formation: A potential reversal pattern is forming, hinting at a possible upward move.
✅ 50 EMA Acting as Dynamic Resistance: The price remains below the 50-period Exponential Moving Average, a key level to watch for bullish confirmation.
✅ Resistance Levels: The 169.000 (50% Fib) and 172.000 (75% Fib) levels are the next upside targets if buyers gain control.
📊 Prediction & Outlook:
🔹 Bullish Scenario: A successful break above dynamic support/resistance and the 50 EMA could trigger a bullish move toward 169.000 and potentially 172.000.
🔹 Bearish Scenario: Failure to hold the current support could see the pair continue its downward trajectory within the channel, with potential targets around 163.250.
🔹 Key Confirmation Point: A breakout above the support & resistance zone (~168.000) would strengthen bullish momentum, while a rejection could lead to further downside.
📢 Trader’s Takeaway:
🔹 Short-term traders should watch for confirmation of the double bottom breakout.
🔹 Swing traders may look for opportunities within the current channel structure, capitalizing on both reversals and trend continuations.
🔹 Risk management is crucial; a break below 166.000 may invalidate bullish setups.
Stay tuned for more updates and trade wisely!
🚀 Follow me for real-time insights and forecasts.
OANDA:CHFJPY FX:CHFJPY VANTAGE:CHFJPY

MY CHFJPY Short Idea 21/2/2025CHFJPY is short due to many reasons but the main theme here is Japan is combating inflation (or hypothetically trying to increase their inflation) which strengthens the bond and the YEN. Meanwhile the SNB is cutting rates with their easing policies hence weakening the FRANC strength. CHFJPY is an extremely bearish FX pair and probably most likely pair to fall in %percentage for the year of 2025. I expect a 1.5-2.5% drop in the next few days or weeks.
My entry was a little late hence why I have a tight SL which could get triggered but I will take any short opportunity on this pair.

CHFJPY is in the Buying DirectionHello Traders
In This Chart CHFJPY HOURLY Forex Forecast By FOREX PLANET
today AUDCAD analysis 👆
🟢This Chart includes_ (CHFJPY market update)
🟢What is The Next Opportunity on CHFJPY Market
🟢how to Enter to the Valid Entry With Assurance Profit
This CHART is For Trader's that Want to Improve Their Technical Analysis Skills and Their Trading By Understanding How To Analyze The Market Using Multiple Timeframes and Understanding The Bigger Picture on the Charts

CHFJPY - Short after BOS !!Hello traders!
‼️ This is my perspective on CHFJPY.
Technical analysis: Here we are in a bearish market structure from daily timeframe perspective, so I look for a short. Price filled the imbalance and rejected from bearish OB. On H4 price formed regular divergence for sell, so after BOS I will open the trade.
Like, comment and subscribe to be in touch with my content!

CHF/JPYIn this chart, I present an analyst with a reward-to-risk ratio of at least 1:10. Here are three conditions that support the reversal:
1. We have a double bottom pattern, which is a reversal pattern.
2. We have a divergence between the indicators.
3. We have a bullish engulfing candlestick, which means the price has reached the bottom.
That’s just my opinion, and I may be mistaken. Ultimately, it’s up to you to form your own opinion and make your own decisions. Please trade safely. I’m not a financial advisor.
CHFJPY: Bullish Continuation is Expected! Here is Why:
The analysis of the CHFJPY chart clearly shows us that the pair is finally about to go up due to the rising pressure from the buyers.
❤️ Please, support our work with like & comment! ❤️

CHF_JPY GROWTH AHEAD|LONG|
✅CHF_JPY has been falling recently
And the pair seems locally oversold
So as the pair is approaching a horizontal support of 165.310
Price growth is to be expected
LONG🚀
✅Like and subscribe to never miss a new idea!✅

chfjpy|foxforexCHFJPY is below the support zone and has formed a downtrend. If this trend breaks, its first target will be to rise to the resistance zone. If it cannot break the trend and gets a reaction from here, it will retreat to the support zone below. Therefore, it is useful to follow this trend line.
Which scenario do you think will happen?

CHFJPY is bearishthe pair made a reversal pattern at the top and then penetrate inside the pattern as fake break ,then fell down
we believe that with this structure heading south toward lower fibo levels will be probable as depicted on the chart
lets see what the market will play out
CHFJPY is ready to push againNo comment needed. All information is in the chart analysis.
Steps to follow:
Analyze yourself.
Take the position with SL and Take Profits.
Wait, it may take a couple of days, so take a break and step away from the screen from time to time, just like I do :)
Get the result.
I will update the trade every day.
Like, comment with your good mood or viewpoint, share with your circle. It’s together that we get stronger!
Good trades, Traders!
The golden bear

CHFJPY POSSIBLE SELL?Overall direction is to the downside based on Monthly and Weekly perspective.
The market is currently testing the current Daily 0.618 area. Based on 4HR TF, the market seems to be forming a possible reversal pattern which could lead to a possible reversal.
We could see SELLERS coming in strong should the current level hold.
Disclaimer:
Please be advised that the information presented on TradingView is solely intended for educational and informational purposes only.The analysis provided is based on my own view of the market. Please be reminded that you are solely responsible for the trading decisions on your account.

CHFJPY Trade Idea🚀 CHFJPY Trade Idea 🚀
Looking for a potential move up towards key targets. Price has shown signs of reversal, aiming for 168.00+ levels.
📊 Trade Details:
🔹 Current Price: 167.698
🔹 Target 1: 168.006
🔹 Target 2: 168.139
🔹 Deadline: 168.38
🔥 Watching price action closely—will momentum push it through? Drop your thoughts below! 👇🏼📈
#ForexTrading #Trading #CHFJPY #TechnicalAnalysis #MarketMoves #PriceAction #TradeSetup #ForexCommunity
