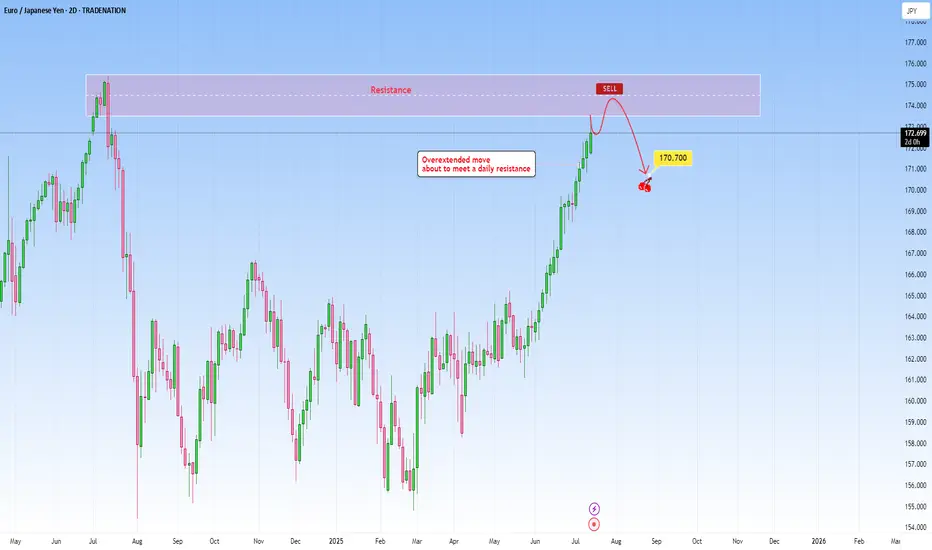
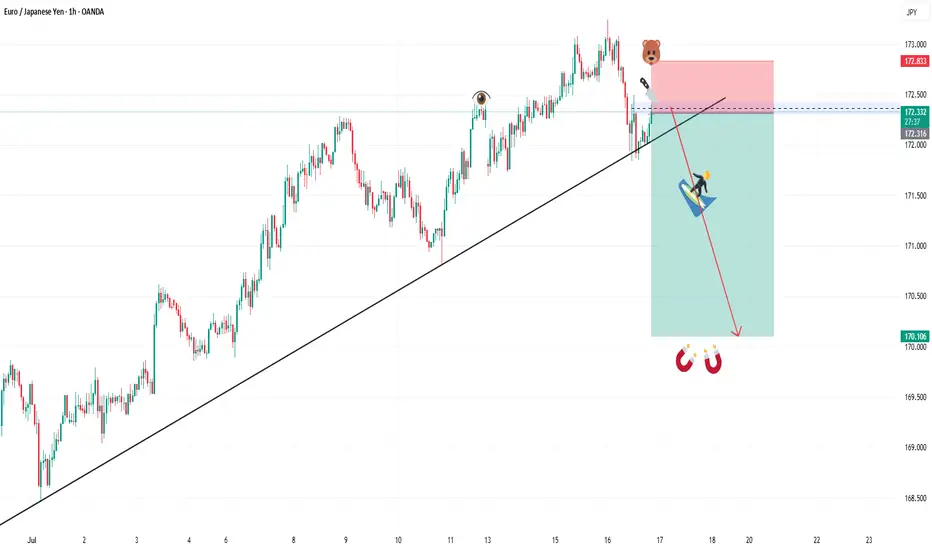
EURJPY: Overextended move to meet daily resistanceThe current market context on EURJPY shows an overextended move that has been pushing higher as price is about to reach a well-established daily resistance. The rally into this resistance lacks healthy retracements, and momentum is likely unsustainable without a deeper correction. The probability of a pause or reversal here under this circumstances increases substantially.
This extension exaggerates this imbalance making it a high probability setup. Volume and price action near this level becomes critical in this case. Signs such as long upper wicks, bearish engulfing patterns will hint that the move may be running out of steam.
I would be targeting a decent pullback towards 170.700.
Just sharing my thoughts for the charts, this isn’t financial advice. Always confirm your setups and manage your risk properly.
Disclosure: I am part of Trade Nation's Influencer program and receive a monthly fee for using their TradingView charts in my analysis.
JPYEUR trade ideas
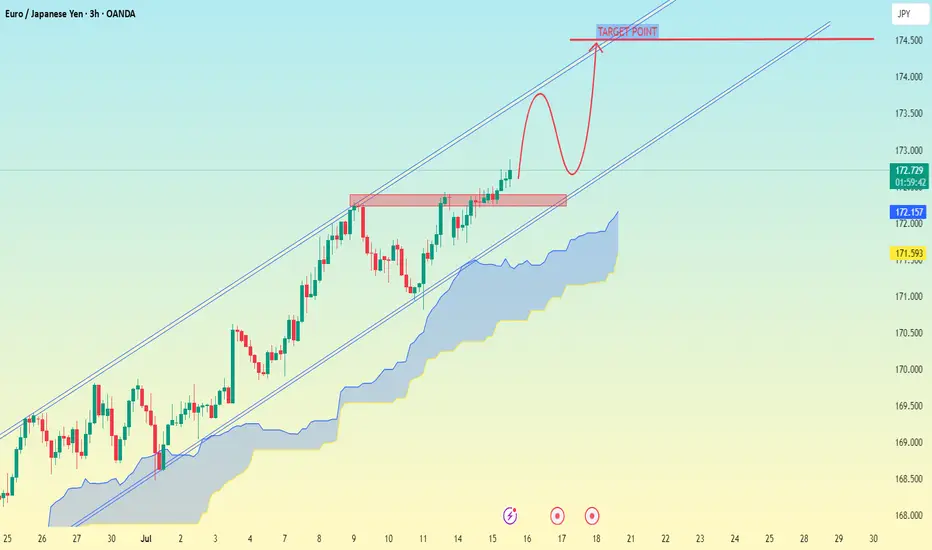
EUR/JPY (Euro vs Japanese Yen) on the 3-hour timeframeEUR/JPY (Euro vs Japanese Yen) on the 3-hour timeframe, the technical setup clearly suggests a bullish continuation inside an ascending channel, with a breakout above a consolidation zone.
---
🎯 Target Point (as marked on your chart):
Main Target Point: 174.500
---
🔍 Analysis Summary:
The price has broken above a resistance zone (around 172.700–172.900).
The chart shows a possible pullback and continuation setup (bullish flag/rounded retest).
The Ichimoku Cloud shows support below, suggesting bullish bias is intact.
The ascending channel remains unbroken and supports higher highs.
---
📌 Summary:
✅ Current Price Area: ~172.70
🥅 Target: 174.50
🔄 Potential Retest Zone: ~172.00–172.30 (marked in red box)
Would you like help with entry strategy, stop-loss placement, or trade management based on this setup?
EURJPY Hits Major Weekly Supply | Is the Bull Run Over?EUR/JPY – Institutional Macro Context (COT)
EUR (Euro)
Non-commercials net longs increased by +16,146 → strong buying.
Commercials added +25,799 long positions.
✅ Bias: Moderately bullish.
JPY (Japanese Yen)
Non-commercials decreased longs by -4,432.
Commercials cut -20,405 long contracts.
❌ Bias: Bearish pressure remains on JPY.
Conclusion (COT): EUR remains fundamentally strong, JPY structurally weak. Institutional flows favor long EUR/JPY, but positioning is stretched.
Seasonality (July)
EURJPY shows strong bullish seasonality in July, especially over the 2Y and 5Y averages (+1.03% and +0.66% respectively).
✅ Seasonality bias: Bullish.
Retail Sentiment
89% of traders are short on EUR/JPY.
Contrarian bias = bullish confirmation.
Technical Analysis (Weekly View)
Price is pushing into a major weekly supply zone around 172.50–173.00.
RSI still elevated but showing signs of weakening momentum.
Potential double top structure forming in confluence with liquidity grab.
First downside target sits around 169.50 (daily demand zone).
Awaiting a reaction in supply and confirmation for short.
Trading Plan (Top-Down)
Wait for price to reject the 172.50–173.00 area
Watch for bearish confirmation on Daily (engulfing or lower high)
Target: 169.50 zone
Risk: tight above 173.20 (invalidating supply zone)

EURJPY - Still Over-Bought!Hello TradingView Family / Fellow Traders. This is Richard, also known as theSignalyst.
📈EURJPY has been overall bullish trading within the rising channel marked in blue. However, it is currently retesting the upper bound of the channel.
Moreover, the green zone is a major weekly supply.
🏹 Thus, the highlighted red circle is a strong area to look for sell setups as it is the intersection of the upper blue trendline and weekly supply.
📚 As per my trading style:
As #EURJPY approaches the red circle zone, I will be looking for bearish reversal setups (like a double top pattern, trendline break , and so on...)
📚 Always follow your trading plan regarding entry, risk management, and trade management.
Good luck!
All Strategies Are Good; If Managed Properly!
~Richard Nasr
Disclosure: I am part of Trade Nation's Influencer program and receive a monthly fee for using their TradingView charts in my analysis.

Sell EURJPYIntraday trade on EURJPY. Bearish flag pattern is on display here. Let us see how price reacts after liquidity collection on the H1 timeframe chart.

EURJPY Hits Supply | Pullback Is ComingPrice has entered the daily supply zone (red area) between 170.80 and 171.80, showing immediate rejection with a long upper wick — a signal of potential short-term bearish reaction.
The RSI is turning lower, indicating loss of momentum, although it hasn’t reached extreme levels yet.
The current map suggests a technical pullback toward the 169.40–168.50 zone (FVG + dynamic support) before any potential bullish continuation toward 174+.
The overall structure remains bullish, but a correction looks likely due to technical exhaustion and retail positioning.
📊 2. COT Report (JPY Futures – as of 2025-07-01)
Non-Commercials (speculators) reduced long positions on the JPY by -7,779 contracts, and also slightly trimmed shorts → clear sign of position reduction.
Net positioning remains strongly negative (JPY weakness), but it's starting to recover slightly.
Commercials added both longs (+2,830) and shorts (+5,977), indicating indecision but growing interest.
Open interest slightly decreased (–516), though it remains elevated.
👉 The market has not yet reversed, but the JPY downtrend may be approaching exhaustion.
🧠 3. Retail Sentiment
86% of retail traders are short EUR/JPY — a strong contrarian bullish signal.
Average retail short entry: 166.27, while current price is 171.55 → retail traders are trapped and under pressure.
A short squeeze is likely underway or already completed, increasing the risk of a technical correction after distribution.
📅 4. Seasonality
July is historically weak for EUR/JPY:
20Y: -0.35
15Y: -0.49
10Y: -0.18
August tends to be even worse from a seasonal perspective.
This supports the idea of a potential pullback in the coming days or weeks.
Trading Conclusion
Current Bias: Short-term Neutral–Bearish, Medium-term Bullish.
✳️ Potential pullback from 172.30 toward 169.40–168.50
🎯 If price holds and builds clean bullish structure, expect continuation toward 174.00–175.00
❌ Invalidation on daily close below 167.80

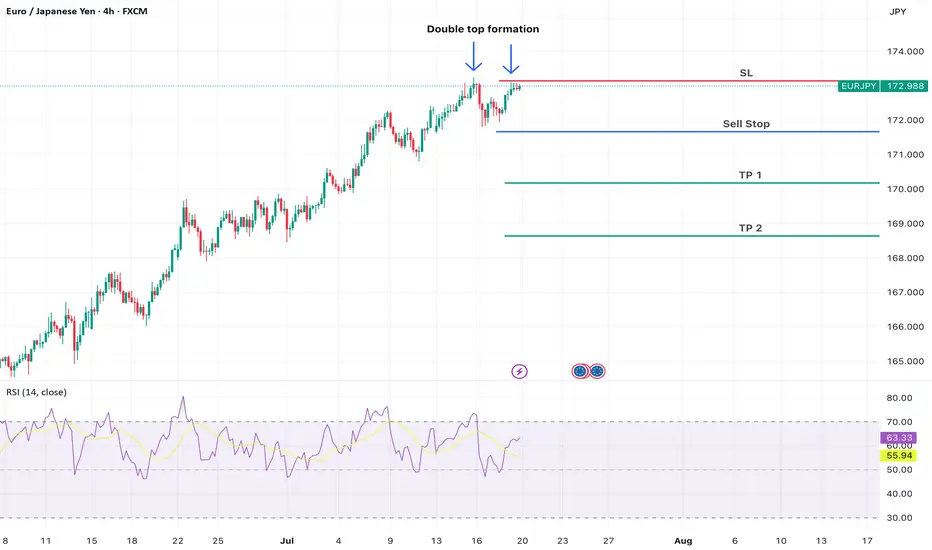
EUR/JPY – Double Top with RSI Divergence (Bearish Setup)Technical Analysis (Short Trade Idea)
EUR/JPY is forming a textbook double top pattern with notable bearish signals:
First top: 173.242
S econd top: 173.111 (lower high, indicating weakening bullish pressure)
Neckline: 171.650 – key support level, potential breakdown trigger
RSI divergence: Bearish divergence observed as RSI prints lower highs while price forms nearly equal tops, signaling momentum loss
This structure suggests a potential reversal from recent highs. A short opportunity may arise if price breaks below the neckline at 171.650 with confirmation.
Trade Setup
Sell Stop: 171.650
Stop Loss: 173.148
Take Profit 1: 170.180
Take Profit 2: 168.642
EURJPY IDEA After seeing the previous day close with bullish momentum we could expect continued push to the upside but since the 4hr is trading at a HH area a slight retrace could occur before the next bullish move to the upside

Sell eurjpyStrong sell expected minimum 700 pips target
Already daily and weekly too much overbought

EURJPY ANALYSIS After seeing the previous daily candle close bearish and close below the low of the previous bullish candle and also a break if the 4hr structure support, we could expect this pair to make a sell off to the downside

EUR_JPY WILL GO UP|LONG|
✅EUR_JPY is trading along the rising support line
And as the pair is going up now
After the retest of the line
I am expecting the price to keep growing
To retest the supply levels above at 173.166
LONG🚀
✅Like and subscribe to never miss a new idea!✅
Disclosure: I am part of Trade Nation's Influencer program and receive a monthly fee for using their TradingView charts in my analysis.

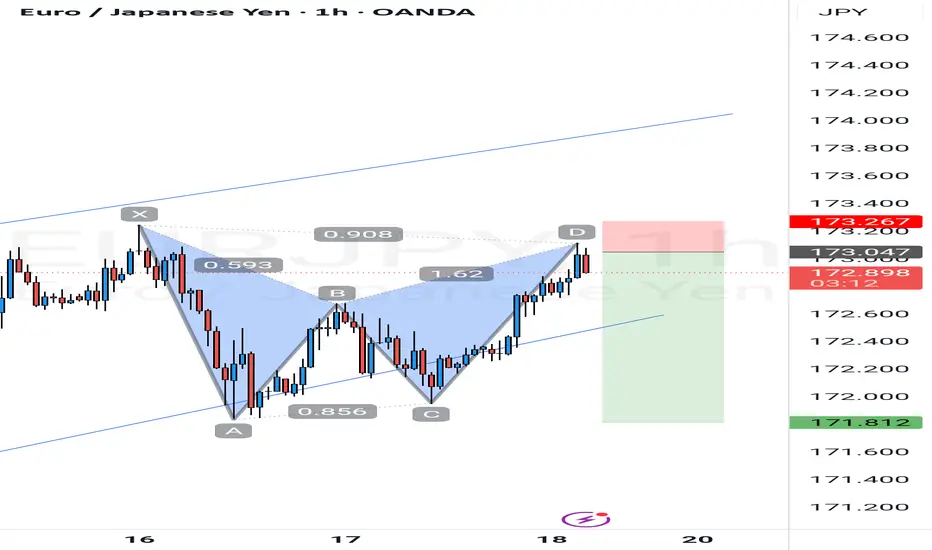
"Three Drives" And EURJPY Bulls Could Be Out!!OANDA:EURJPY has potentially been forming quite a rare Reversal Pattern, the Three Drives Pattern, after making a Bullish Breakout of the Triangle, lets break it down!
Three Drive Patterns are very similar to ABCD patterns except for one thing, a Retracement instead of a Reversal after the CD Leg is finished!
In the CD Leg, Price creates quite a Trading Volume Gap between 172.1 - 171.8 and after Price declines from Point D (normally a Short Opportunity on an ABCD Pattern), Price actually makes a 61.8% Retracement of CD, creating Point E in that very Price Range and moves up, which "drives" a strong case that we potentially could be looking at a Three Drive Pattern!
Now that we have Point E, we can use the Fibonacci Retracement Tool to help give us an idea on where the Extension of the EF Leg could potentially end and the Fibonacci Levels suspected are:
123.6% --> 173.585
138.2% --> 173.795
161.8% --> 174.134
Once Price has made an Extension, shows Reaction, and moves Down from these levels; this could generate a great Short Opportunity!

Potential BEARSOn a 1D TF, looks like we having a wedge/ending diagonal after a long bullish trade. On a 1H TF, we're having a bearish BAT Pattern which On completion will result into breaking out of the wedge. So we're looking to go down for more oil 🛢 .
EURJPY: Another Bullish pattern pushing EURJPY to 173 EURJPY: Another Bullish pattern pushing EURJPY to 173
Yesterday, EURJPY confirmed a bullish triangle pattern during the opening of the U.S. market.
EURJPY has already reached 170.60 and is coming back for a retest of the broken resistance before moving higher again.
It's a complex situation, but if the price holds above the 169.75 pattern, the chances of a clear uptrend will increase further.
Remember that the larger pattern will be almost complete near 173.00.
You may find more details in the chart!
Thank you and Good Luck!
PS: Please support with a like or comment if you find this analysis useful for your trading day
Disclosure: I am part of Trade Nation's Influencer program and receive a monthly fee for using their TradingView charts in my analysis.

SELL EURJPYIn todays session we are monitoring EURJPY for selling opportunity. As seen eurjpy has been on a strong uptrend however 173 level has shown strong resistance and a willingness for market to go lower. Our entry is at 172.390 and stops are above 172.835 our target is 170.180 and lower. Use proper risk management cheers
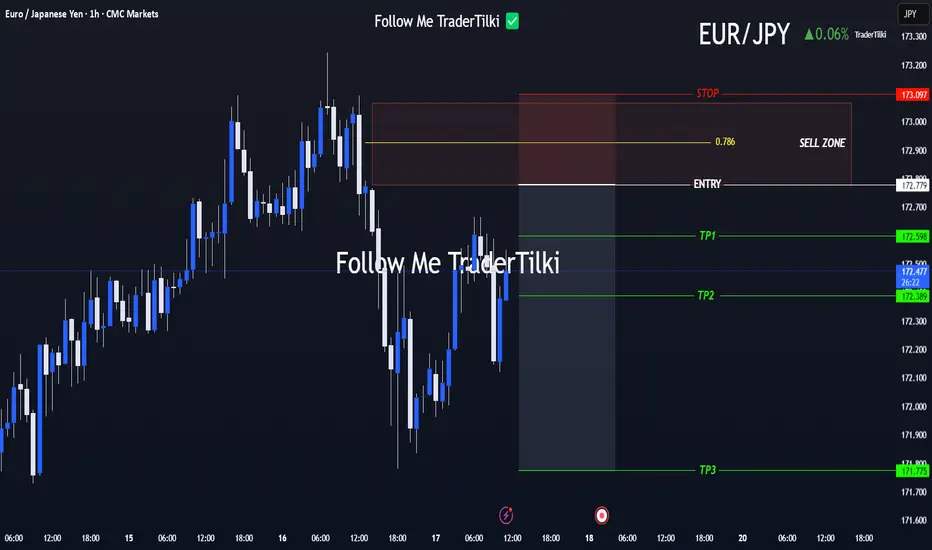
Clear Entry, Clear Targets! Strategy Kicks Off with EUR/JPYHey everyone 👋
📌 SELL LIMIT ORDER / EUR/JPY Key Levels
🟢 Entry: 172,779
🎯 Target 1: 172.598
🎯 Target 2: 172.389
🎯 Target 3: 171,775
🔴 Stop: 173.097
📈 Risk/Reward Ratio: 3.17
I double-checked the levels and put together a clean, focused analysis just for you. Every single like seriously boosts my motivation to keep sharing 📈 Your support means the world to me!
Huge thanks to everyone who likes and backs this work 💙
Our goals are crystal clear, our strategy is solid. Let’s keep moving forward with confidence and smart execution!
EURJPY Short Swing TradeOANDA:EURJPY Short trade, with my back testing of this strategy, it hits multiple possible take profits, manage your position accordingly.
This is good trade, don't overload your risk like greedy, be disciplined trader, this is good trade.
Use proper risk management
Looks like good trade.
Lets monitor.
Use proper risk management.
Disclaimer: only idea, not advice

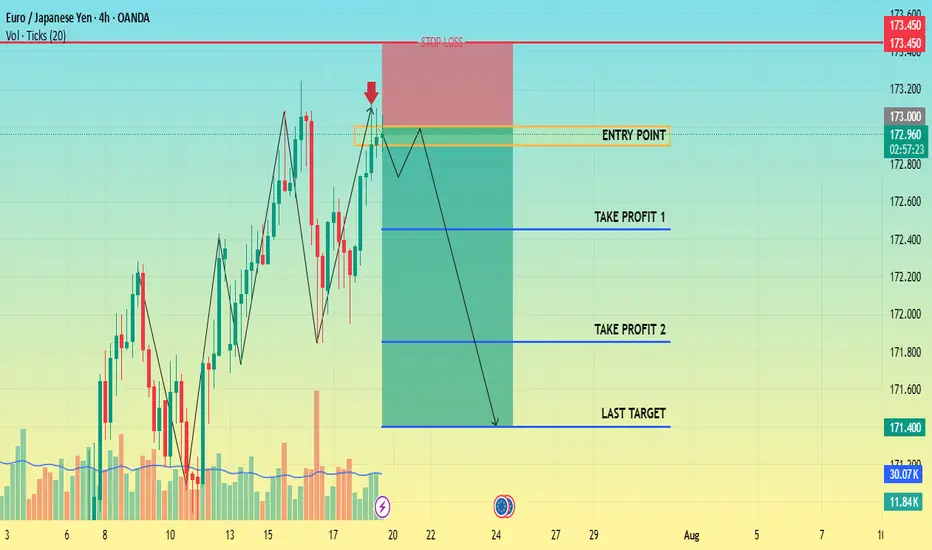
CHECK EURJPY SIGNAL READ CAPTAINShort (sell)
Entry Point: Around 173.000 172.900
Stop Loss: Around 173.450
🎯 Target Levels
Take Profit 1:
172.450
Take Profit 2:
171.850
Last Target:
171.400
EURJPY 4Hour TF - July 20th, 2025EURJPY 7/20/2025
EURJPY 4hour Bullish Idea
Monthly - Bullish
Weekly - Bullish
Daily - Bullish
4hour - Bullish
Bullish Continuation - This is the most likely scenario for EJ this week as nothing suggests anything other than Bullish activity.
EJ could take off right at market open and start pushing up without giving us a retest to enter on. If we do get some sort of retest or pullback, look for rejection as close to 172.400 as possible before looking long.
If this does execute it looks like it will be a very small window of opportunity to enter. Trade cautiously with EJ in this bullish scenario.
Bearish Reversal - This scenario is less likely but is much more favorable in my opinion.
For us to consider EJ bearish we would need to see a clear break below 172.400 with a lower high below. This would give us enough confidence to consider short scenarios and start looking lower toward major support levels like 170.750.

EURJPY Is Going Up! Long!
Here is our detailed technical review for EURJPY.
Time Frame: 7h
Current Trend: Bullish
Sentiment: Oversold (based on 7-period RSI)
Forecast: Bullish
The market is approaching a significant support area 172.355.
The underlined horizontal cluster clearly indicates a highly probable bullish movement with target 174.222 level.
P.S
Please, note that an oversold/overbought condition can last for a long time, and therefore being oversold/overbought doesn't mean a price rally will come soon, or at all.
Disclosure: I am part of Trade Nation's Influencer program and receive a monthly fee for using their TradingView charts in my analysis.
Like and subscribe and comment my ideas if you enjoy them!

EURJPY SHORT – DAILY FORECAST Q3 | W29 | D14 | Y25 GAP SHORT!!!!💼 EURJPY SHORT – DAILY FORECAST
Q3 | W29 | D14 | Y25
📊 MARKET STRUCTURE SNAPSHOT
EURJPY is currently reacting from a key higher time frame supply zone, with price action showing weakness at premium levels. Structure and momentum are now aligning for a short opportunity backed by multi-timeframe confluence.
🔍 Confluences to Watch 📝
✅ Daily Order Block (OB)
Strong reaction and early signs of distribution.
Previous bullish momentum is losing steam; structure is flattening with rejection wicks forming.
✅ 4H Order Block
Break of internal structure (iBoS) confirms a short-term bearish transition.
✅ 1H Order Block
1H structure shift bearish
📈 Risk Management Protocols
🔑 Core principles:
Max 1% risk per trade
Only execute at pre-identified levels
Use alerts, not emotion
Stick to your RR plan — minimum 1:2
🧠 You’re not paid for how many trades you take, you’re paid for how well you manage risk.
🧠 Weekly FRGNT Insight
"Trade what the market gives, not what your ego wants."
Stay mechanical. Stay focused. Let the probabilities work.
🏁 Final Thoughts from FRGNT
📌 The structure is clear.
The confluences are stacked.
Let execution follow discipline, not emotion.

EurjpyThe price has reached an important level and I think we can go back down to the specified targets.

Potential Short Opportunity on EURJPYReasons I think this pair will fall:
- Confirmed Trend line means harder break out.
- RSI was overbought on the 4H time frame
- Potential double top
What do you think?
