Wednesday signal The market is on an uptrend as some or us will lack patience and try to reverse it. You should always be a friend with the trend
JPYEUR trade ideas

CHECK EURJPY SIGNAL READ CAPTAINeurjpy signal technical analysis satup 👇🏼
(eurjpy ) sell zone
( TRADE SATUP)
ENTRY POINT (163.500) to (163.600) 📊
FIRST TP (163.150)
2ND TARGET (162.700) 📊
LAST TARGET (163.300 📊
STOP LOOS (164.000)❌
FALLOW RISK MANAGMENT

CHECK EURJPY SIGNALS READ CAPTAIN EURJPY buy Limit Zone
TRADE
Entry ponit 👉 162.262
Take profit Target 164.172
Stop loss 161.777
Follow money Menagment

EURJPY: Bearish Continuation
Balance of buyers and sellers on the EURJPY pair, that is best felt when all the timeframes are analyzed properly is shifting in favor of the sellers, therefore is it only natural that we go short on the pair.
Disclosure: I am part of Trade Nation's Influencer program and receive a monthly fee for using their TradingView charts in my analysis.
❤️ Please, support our work with like & comment! ❤️

EURJPY could be about to soarThe price is stuck in a large ascending triangle pattern. But with stocks moving higher, cryptocurrencies gaining momentum, and the trade war easing, could this pattern finally break? Watch the video to see which levels matter.
This content is not directed to residents of the EU or UK. Any opinions, news, research, analyses, prices or other information contained on this website is provided as general market commentary and does not constitute investment advice. ThinkMarkets will not accept liability for any loss or damage including, without limitation, to any loss of profit which may arise directly or indirectly from use of or reliance on such information.

CHECK EURJPY SIGNAL READ CAPTAIN (eurjpy) sell zone
(trade satup)
entry point (163.550) to (163.500) 📊
first target (163.300)
2nd target (162.950) 📊
last target (162.600) 📊
stop loss (163.800)❌

EURJPY still to expect bearish for new week
OANDA:EURJPY strong bearish bounce from top line of price action, currently price in rectangle and on bottom line of price action.
EUR with all showing self the weakest in last periods and expectations are still to see weaknes, here expecting break of rectangle and trend line of PA and higher bearish continuation till res zone.
SUP zone: 163.300
RES zone: 160.600

Qml + BosAfter the market gave us an entryway we came late but this is where we can Always catch up with it..wait for fvg to give us direction as the buyers are now taking control

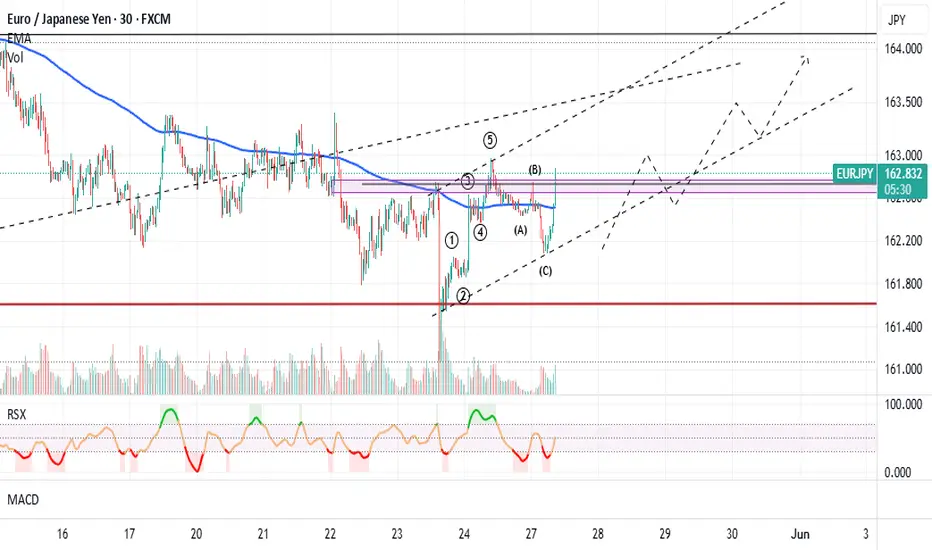
#EURJP Elliott wave analysisclear previous 5 wave bullish move followed by an abc corrective move which now could lead to a wave 3 or c.
EURJPY Wave Analysis – 26 May 2025
- EURJPY reversed from key support level 161.40
- Likely to rise to resistance level 165.00
EURJPY currency pair recently reversed up from the key support level 161.40 (which has been reversing the price from the middle of April), coinciding with the lower daily Bollinger Band
The upward reversal from the support level 161.40 created the daily Japanese candlesticks reversal pattern Long Legged Doji.
EURJPY currency pair can be expected to rise to the next resistance level 165.00, which has been reversing the price from last November.

EUR/JPY: Bulls Warming Up for the Next Leg !!Hey Traders
Price is holding above key structure and showing signs of bullish continuation. If momentum sustains, buyers could push price toward higher targets.
🎯 Target: 164.140
📌 (Not financial advice)
#EURJPY #ForexSetup #BullishBias #SmartMoney #PriceAction #FXTrading #TechnicalAnalysis #EuroYen

Bearish reversal?EUR/JPY is rising towards the resistance level which is an overlap resistance that lines up with the 50% Fibonacci retracement and could drop from this level to our take profit.
Entry: 163.18
Why we like it:
There is an overlap resistance level that lines up with the 50% Fibonacci retracement.
Stop loss: 163.18
Why we like it:
There is a pullback resistance level that is slightly above the 61.8% Fibonacci retracement.
Take profit: 161.61
Why we like it:
There is a pullback support level.
Enjoying your TradingView experience? Review us!
Please be advised that the information presented on TradingView is provided to Vantage (‘Vantage Global Limited’, ‘we’) by a third-party provider (‘Everest Fortune Group’). Please be reminded that you are solely responsible for the trading decisions on your account. There is a very high degree of risk involved in trading. Any information and/or content is intended entirely for research, educational and informational purposes only and does not constitute investment or consultation advice or investment strategy. The information is not tailored to the investment needs of any specific person and therefore does not involve a consideration of any of the investment objectives, financial situation or needs of any viewer that may receive it. Kindly also note that past performance is not a reliable indicator of future results. Actual results may differ materially from those anticipated in forward-looking or past performance statements. We assume no liability as to the accuracy or completeness of any of the information and/or content provided herein and the Company cannot be held responsible for any omission, mistake nor for any loss or damage including without limitation to any loss of profit which may arise from reliance on any information supplied by Everest Fortune Group.


CHECK EURJPY SIGNAL READ CAPTAINeurjpy signal technical analysis satup 👇🏼
(eurjpy) buy zone
( TRADE SATUP)
ENTRY POINT (162.800) to (162.700) 📊
FIRST TP (163.150)
2ND TARGET (163.550) 📊
LAST TARGET (163,900) 📊
STOP LOOS (162.500)❌
FALLOW RISK MANAGMENT

CHECK EURJPY SIGNAL READ CAPTAINEURJPY Sell Zone
TARDE✅
Entry ponit 👉 162.582
take profit¹ 162.200
take profit ² 161.870
take profit ³ 161.900
Stop loss 162.900
Follow money Menagment

EUR JPY TECHHello dear traders :) It's time to share my new tech!
As we see here we have many reasons to think its ok position to open Long EURJPY
We got a strong uptrend here. We have 16 days LONG strong up channel in this pair. also a nice support point inside.
Our trades price target is near +60 pips (Take Profit).
If you have any Questions? Ask me!
FxCROWN :)
Thank you

EURJPYcomplete buy on the open of the market based on economic data report we will be watching till newyork session

26.05.2025 - 30.05.2025 - EURJPY LONG POSITIONEURJPY - 26.05.2025 - 30.05.2025 Looking for LONG position on EURJPY

EURJPYEUR/JPY Economic Data, Bond Yields, and Carry Trade Analysis (May 25–31, 2025)
Key Economic Data Releases (May 25–31, 2025)
Date Time (UTC) Region Event Impact Previous Consensus
May 25 18:40 USD Fed Chair Powell Speech High — —
May 25 23:01 EUR Consumer Confidence (May) Low 58.7 59.1
May 26 05:00 EUR PPI YoY (Apr) Low 0.5% 1.1%
May 26 05:00 JPY Leading Economic Index (Mar) Low 108.2 107.7
May 26 05:00 JPY Coincident Index (Mar) Low 117.3 116.0
May 26 10:00 EUR Balance of Trade (Mar) Low -€0.61B -€0.68B
May 28 06:45 EUR GDP Growth Rate QoQ (Q1) Low -0.1% 0.1%
May 28 07:55 EUR Unemployment Rate (May) High 6.3% 6.3%
May 29 05:00 JPY Consumer Confidence (May) High 31.2 31.8
May 29 23:30 JPY Tokyo Core CPI YoY (May) Low 3.4% 3.5%
Key Focus: Eurozone unemployment (May 28) and Japanese consumer confidence (May 29) are high-impact events. Fed Chair Powell’s speech (May 25) may also influence USD-driven crosswinds in EUR/JPY.
10-Year Bond Yields (as of May 22–24, 2025)
Eurozone 10-Year Yield: 3.17% (up from 3.15% previous day, 3.10% YoY) .
Japan 10-Year JGB Yield: 1.57% (up from 1.53% previous day, 1.01% YoY) .
Interest Rate Differential:3.17%(EUR)−1.57% (JPY)=+1.60% the 3.17% (EUR)−1.57% (JPY)=+1.60%
Carry Trade Advantage
The 1.60% yield spread favors the euro, making EUR/JPY attractive for carry trades. Investors borrow JPY at low rates and invest in EUR-denominated assets to profit from the differential.
Key Considerations:
Upcoming Data Impact:
Stronger-than-expected Eurozone data (e.g., GDP, unemployment) could widen the yield spread, boosting EUR/JPY.
Higher Japanese CPI or consumer confidence might tighten BoJ policy, raising JGB yields and narrowing the spread.
Technical Outlook:
EUR/JPY is sensitive to risk sentiment. Geopolitical tensions or USD volatility (from Powell’s speech) could disrupt carry trade flows.
Historical Context:
The Eurozone yield is above its long-term average (2.48%) , while Japan’s remains below its average (2.06%) , reflecting divergent monetary policies.
Summary Table
Metric Eurozone (EURO Japan (JPY)
10-Year Bond Yield 3.17% 1.57%
Interest Rate Differential +1.60% —
Key Economic Events Unemployment, GDP Consumer Confidence, CPI
Conclusion
The EUR/JPY pair is supported by a 1.60% yield differential, favoring carry trades. However, upcoming Eurozone unemployment data (May 28) and Japanese consumer confidence (May 29) could shift bond yields and the exchange rate. Traders should monitor these releases alongside broader risk sentiment to assess carry trade viability.
#EURJPY

EURJPY AnalysisThe euro is showing clear signs of weakness as markets price in a higher likelihood of an upcoming ECB rate cut. This could put further downside pressure on EURJPY.
📉 Is this just the beginning of a larger move?

EUR/JPY Technical Breakdown: Rising Wedge Breakdown + Target🔺 1. Rising Wedge Pattern Explained
A Rising Wedge is formed when:
Price action creates higher highs and higher lows, but
The slope of the support line is steeper than the resistance line.
This signals that buyers are losing strength, and momentum is fading.
In this chart:
The wedge began forming around mid-February 2025.
Price was compressing within converging trendlines.
After multiple failed breakouts near resistance (~165.50), the pair finally broke below the lower trendline, confirming a bearish breakout.
This pattern is considered reliable because it traps late buyers and shifts sentiment from bullish to bearish quickly once the lower boundary is breached.
🔻 2. Key Technical Zones
📌 Major Resistance Zone (~165.00 – 166.00)
Strong supply area; price has rejected here multiple times since late 2023.
Resistance was confirmed again during the wedge formation.
High volume spike noted near this level, followed by a steep drop—evidence of distribution and smart money exiting long positions.
📌 Major Support Zone (~156.00 – 157.00)
Historically held as a demand zone.
Previous bounces suggest it is structurally significant.
However, repeated tests can weaken the zone, increasing the likelihood of a breakdown.
🎯 Target Price: 153.433
Measured by taking the height of the wedge and projecting it from the breakout point.
Coincides with a previously tested level (support turned target).
Bears could aim for this level as a swing target.
📉 3. Market Psychology Behind the Pattern
As price climbs inside a rising wedge, volume often declines, showing buyer exhaustion.
False breakouts near the top of the wedge trap breakout traders, adding fuel to the downside move once price breaks the lower boundary.
The sharp selloff post-breakout is often driven by stop-loss cascades and aggressive short positioning.
🔁 4. Potential Price Path & Trade Plan
Retest in Progress: Price may retest the broken wedge support (now resistance) near 163.00–164.00 before further decline. This retest zone offers a high-probability short entry opportunity with tight risk management.
Immediate Downside Levels: 160.00 (psychological level), 157.00 (support zone), and final target at 153.43.
Bearish Continuation Scenario: If the pair maintains below the wedge and forms lower highs, it confirms ongoing bearish sentiment.
🛑 5. Risk Factors to Monitor
ECB or BOJ monetary policy shifts (rate cuts/hikes, yield curve control updates).
Risk-on vs risk-off flows, especially in times of geopolitical or macroeconomic shocks.
Intervention by the Bank of Japan to protect JPY from excessive weakening.
✅ Conclusion: A Tactical Short Opportunity
The EUR/JPY chart is setting up for a potential medium-term short swing trade following a confirmed rising wedge breakdown. With clear rejection from a long-standing resistance zone and fading bullish momentum, the technicals align for a move toward 153.43 over the coming weeks.
Traders should watch for clean retests and structure-based entries, managing risk around 164.50 with profit-taking at key support zones along the path.

EURJPY - Look for Short (SWING) 1:XX!It’s been a while since I last shared a trading idea — here’s one for you.
EURJPY has spent the past few weeks in an accumulation phase and now looks poised to shift into a distribution phase to the downside. Let’s see how it unfolds.
Disclaimer:
This is simply my personal technical analysis, and you're free to consider it as a reference or disregard it. No obligation! Emphasizing the importance of proper risk management—it can make a significant difference. Wishing you a successful and happy trading experience!

