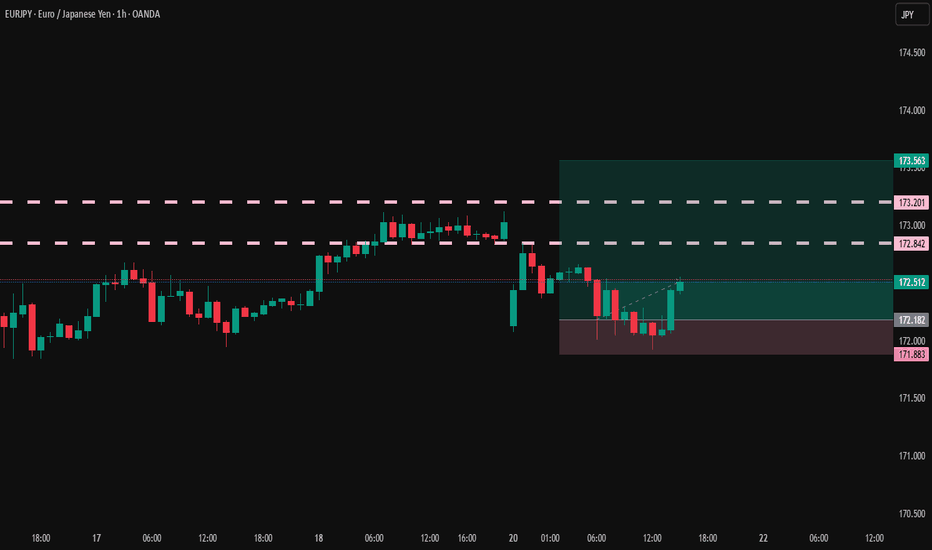
EURJPY – TCB Setup (Higher Timeframe Validation)🕐 EURJPY – TCB Setup (Higher Timeframe Validation ✅)
Strategy: Trend → Countertrend → Breakout (TCB)
Timeframe: 1H
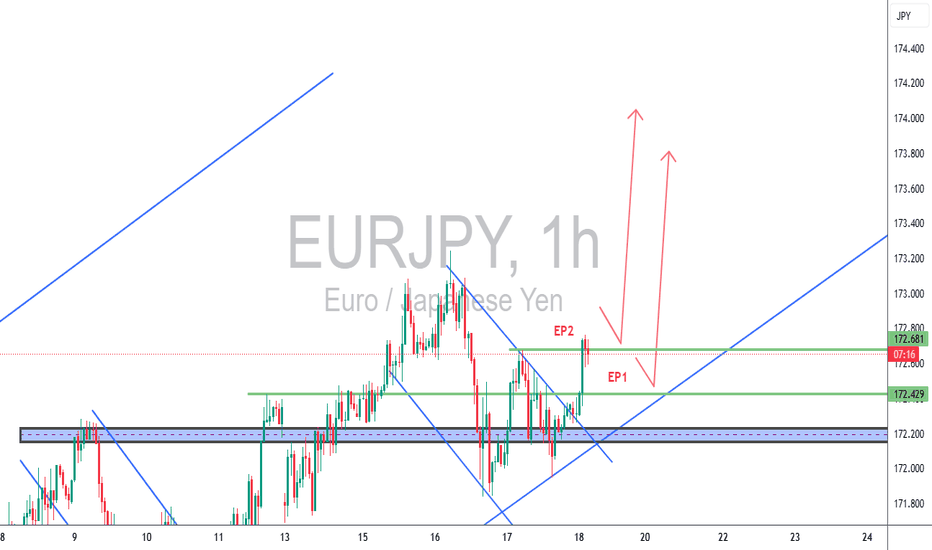
Status: Breakout confirmed — now watching EP1/EP2 for clean entry signals
🔍 Setup Breakdown:
📈 Trend: Clean bullish channel structure still intact
↘️ Countertrend: Descending wedge fully broken to the upside
🚀 Breakout: Price is now testing key structure → breakout above 172.429 & 172.681 zones
📌 Trade Plan:
EP1: 172.429 — safer, structure-based retest
EP2: 172.681 — aggressive entry if price holds above
SL: 172.150
TP1: 173.400
TP2: 174.000
R:R: 1:2.5+ depending on entry location
Checklist Score: 95% — confirmed breakout, now waiting for execution model in NY or Asia session
🧠 TCB Note:
Higher timeframe confluence makes this setup stronger. Look for price action confirmation (e.g. bullish engulfing or rejection wicks) at EP1/EP2 before executing.
#EURJPY #ForexTCB #BreakoutTrading #PriceActionFX #SmartMoneyFlow
JPYEUR trade ideas
EURJPY / Euro – Japanese Yen (2H) – Bullish Structure Rebuilding
Hello awesome traders! 👋
Wrapping up the week with one more setup review — this one’s moving step by step, and now testing a critical level. Let's break it down.
📌 Pattern Breakdown
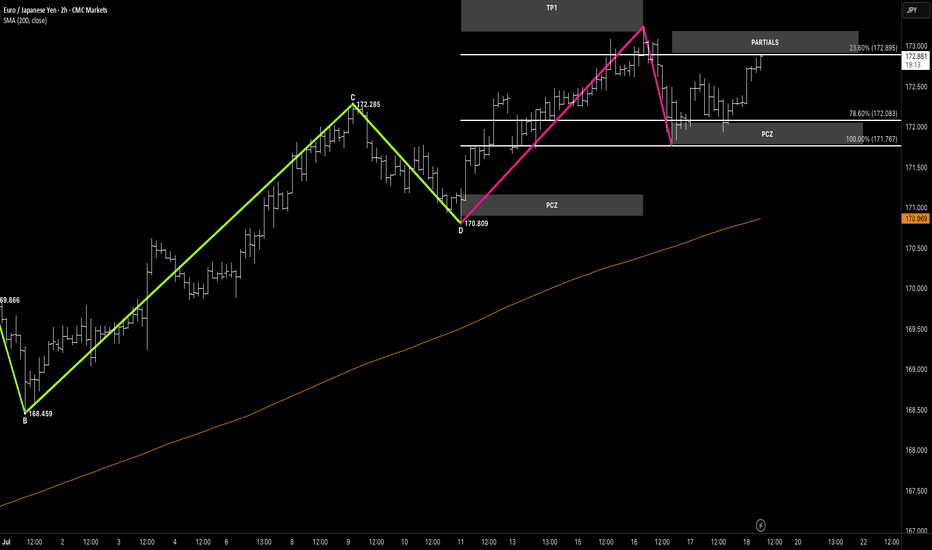
We had a clean multi-leg impulse and harmonic rotation:
🔹 D-leg reversal formed at 170.809, right inside the PCZ
🔹 Strong rally into the 23.6% fib zone (172.895)
🔹 Partial profits were taken at that first resistance
🔹 Price is now testing that same level as resistance turned support (R→S)
This is the decision point — a confirmed hold above 172.89 signals potential continuation toward TP1.
🎯 Targets Ahead
📍 TP1 Zone:
• 78.6% = 173.694
• 100% = 174.215
💡 But first — 23.6% is the gate. If it holds as new support, momentum should carry this back into the higher fibs.
🧠 What to Watch
✅ Structure respected from PCZ
✅ Partial taken on first reaction
🟡 Now watching reaction at 23% for direction:
• 🔼 Break + hold → continuation toward TP1
• 🔽 Failure + breakdown → reversion back into PCZ
🗝 Final Thoughts
This is how measured setups evolve — from structure → to reaction → to resolution.
You’ve got the edge — now it’s about letting price show the hand.
“The 23% isn’t just a pullback — it’s a pressure point. Hold it, and the next move builds.”
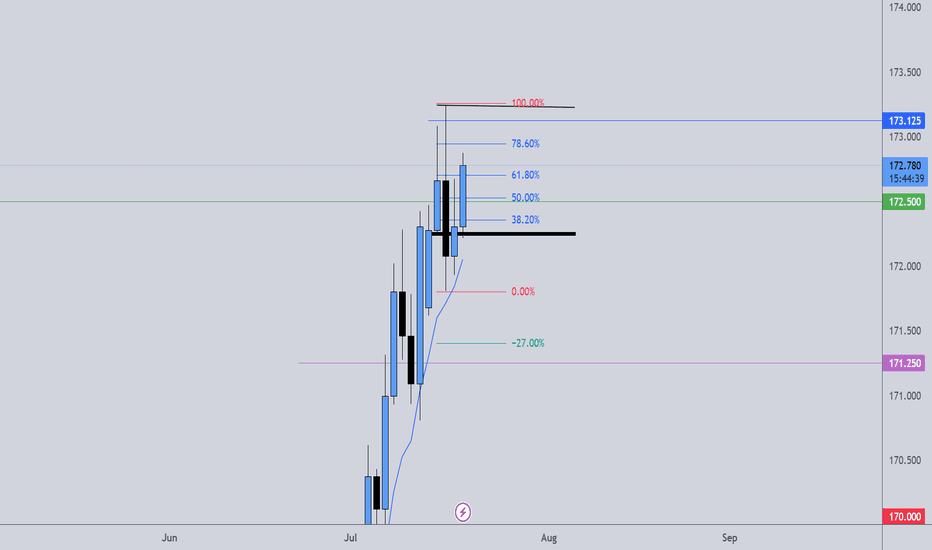
EURJPY Bullish Setup: Waiting for the Optimal Retrace EntryThe EURJPY is currently in a strong bullish trend 📈🔥. I’m anticipating a retracement into the Fibonacci 50–61.8% zone 🔄, which aligns with the equilibrium of the current price swing ⚖️. This potential pullback could present an optimal entry 🎯 — provided we see a bullish break of market structure 🔓📊 during the move down.
🛑 Stops and targets, as discussed in the video, are shared for educational purposes only — this is not financial advice 📚🚫. Please ensure you do your own analysis and risk assessment 🧠📉.
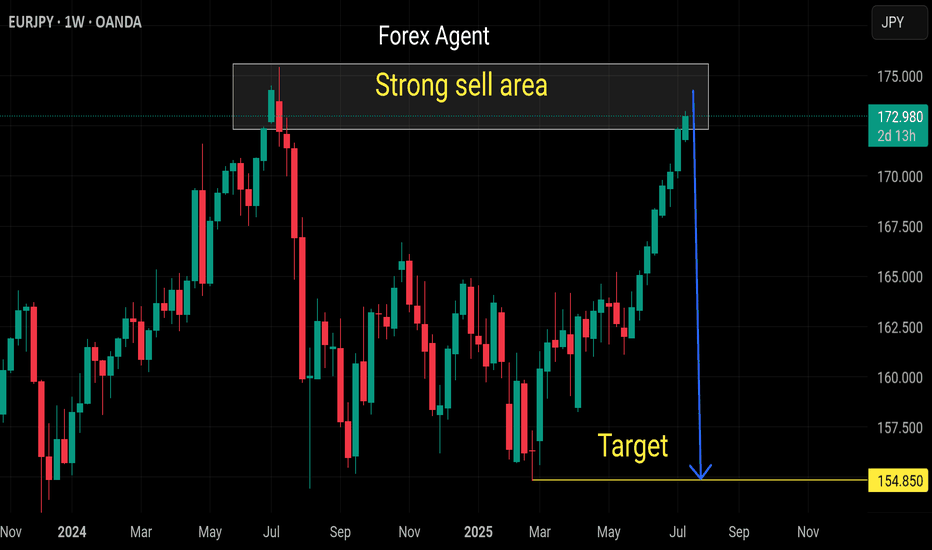
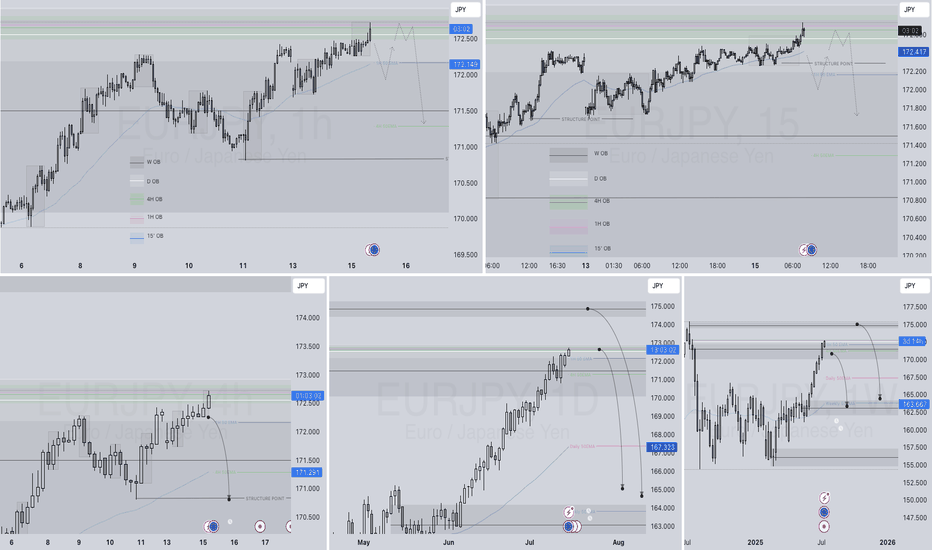
EURJPY – WEEKLY FORECAST Q3 | W30 | Y25📊 EURJPY – WEEKLY FORECAST
Q3 | W30 | Y25
Weekly Forecast 🔍📅
Here’s a short diagnosis of the current chart setup 🧠📈
Higher time frame order blocks have been identified — these are our patient points of interest 🎯🧭.
It’s crucial to wait for a confirmed break of structure 🧱✅ before forming a directional bias.
This keeps us disciplined and aligned with what price action is truly telling us.
📈 Risk Management Protocols
🔑 Core principles:
Max 1% risk per trade
Only execute at pre-identified levels
Use alerts, not emotion
Stick to your RR plan — minimum 1:2
🧠 You’re not paid for how many trades you take, you’re paid for how well you manage risk.
🧠 Weekly FRGNT Insight
"Trade what the market gives, not what your ego wants."
Stay mechanical. Stay focused. Let the probabilities work.
FRGNT FOREX ANALYSIS 📊
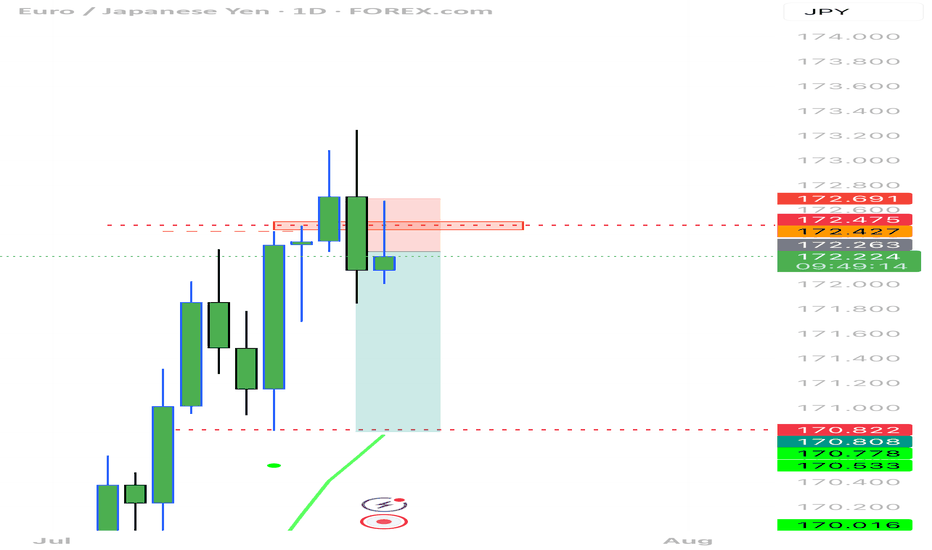
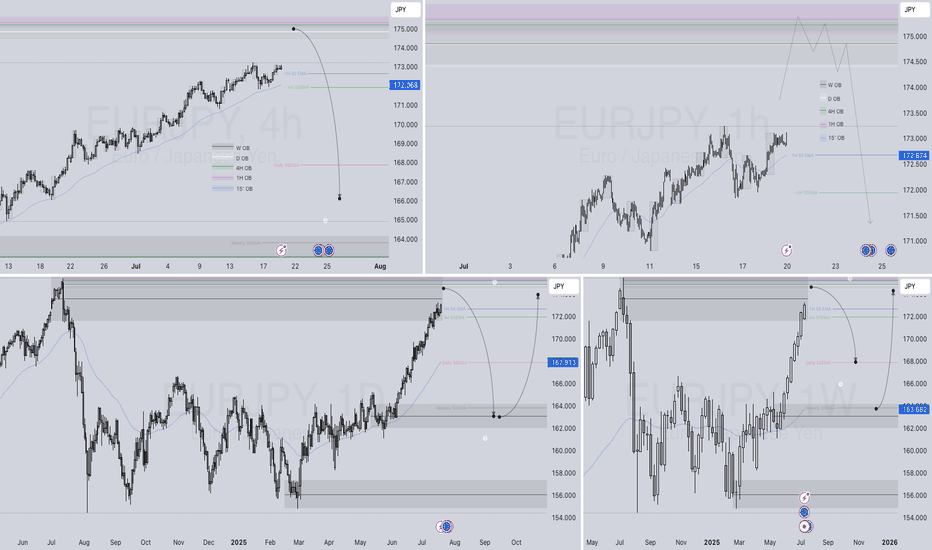
EURJPY SHORT – DAILY FORECAST Q3 | W29 | D15 | Y25💼 EURJPY SHORT – DAILY FORECAST
Q3 | W29 | D15 | Y25
📊 MARKET STRUCTURE SNAPSHOT
EURJPY is currently reacting from a key higher time frame supply zone, with price action showing weakness at premium levels. Structure and momentum are now aligning for a short opportunity backed by multi-timeframe confluence.
🔍 Confluences to Watch 📝
✅ Daily Order Block (OB)
Strong reaction and early signs of distribution.
Previous bullish momentum is losing steam; structure is flattening with rejection wicks forming.
✅ 4H Order Block
Break of internal structure (iBoS) confirms a short-term bearish transition.
✅ 1H Order Block
1H structure shift bearish
📈 Risk Management Protocols
🔑 Core principles:
Max 1% risk per trade
Only execute at pre-identified levels
Use alerts, not emotion
Stick to your RR plan — minimum 1:2
🧠 You’re not paid for how many trades you take, you’re paid for how well you manage risk.
🧠 Weekly FRGNT Insight
"Trade what the market gives, not what your ego wants."
Stay mechanical. Stay focused. Let the probabilities work.
🏁 Final Thoughts from FRGNT
📌 The structure is clear.
The confluences are stacked.
Let execution follow discipline, not emotion.
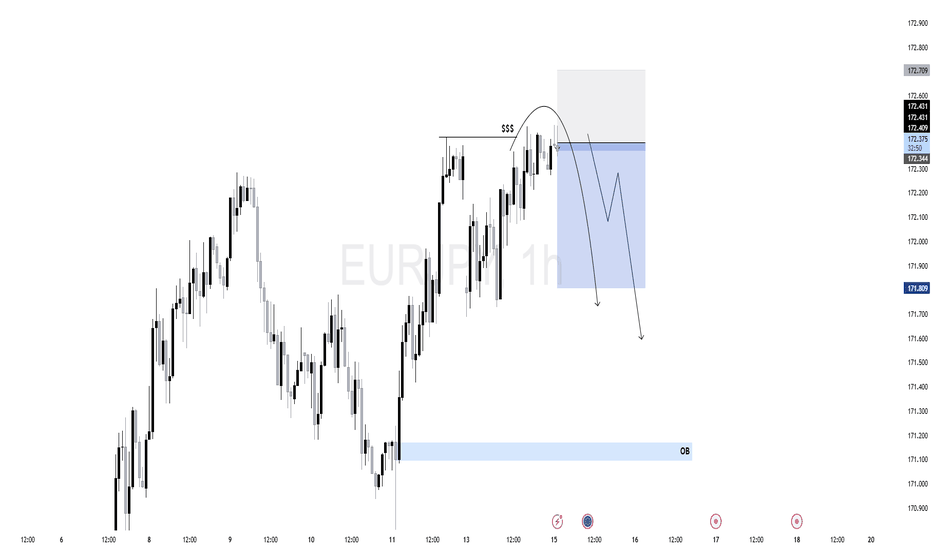
$EJ (EURJPY) 1HPrice has been in an overall bullish structure, forming higher highs and higher lows.
Price tapped into a premium zone, showing signs of exhaustion.
After the liquidity run, we saw a rejection from the top, followed by a shift in structure.
A bearish FVG has formed, and price has now retraced back into it, offering a potential sell opportunity.
As long as price holds below the high and inside the premium FVG zone, bearish bias is valid. Any break above the recent high would invalidate this setup.
EURJPY buysHello everyone,
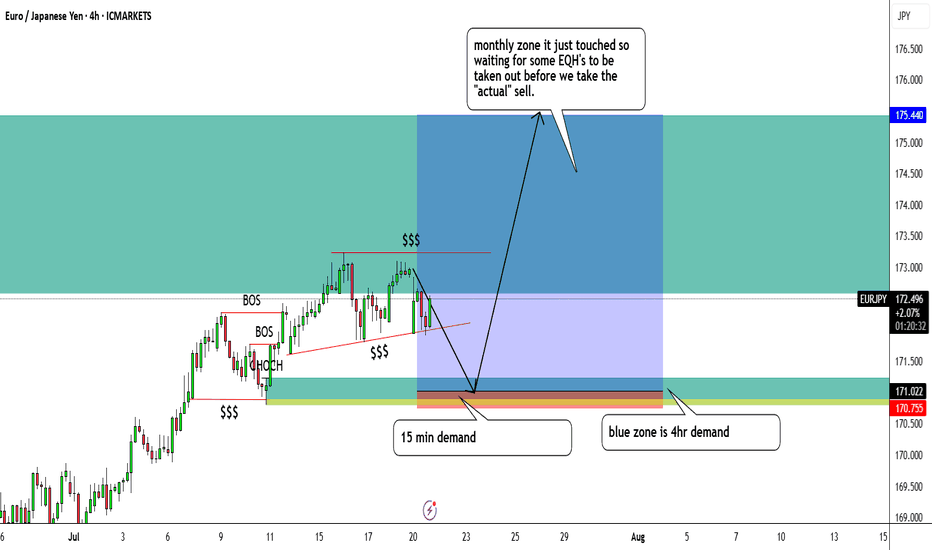
I am looking for eurjpy buys only because on the 15 min chart, price decided to take out EQL's to go long thus creating a big bullish move which has been marked in yellow and annotated.
Price than made this wedge liquidity zone where both EQL's and EQH's are present so we believe outside of this range is where the liquidity actually is.
4hr and 15 min demand zone is still untouched so we're looking for the buy around the 171.185 area to be precise.
I will be putting up screenshots as well so that it makes sense.
EUR/JPY BEST PLACE TO SELL FROM|SHORT
Hello, Friends!
EUR/JPY pair is trading in a local uptrend which we know by looking at the previous 1W candle which is green. On the 2H timeframe the pair is going up too. The pair is overbought because the price is close to the upper band of the BB indicator. So we are looking to sell the pair with the upper BB line acting as resistance. The next target is 171.514 area.
Disclosure: I am part of Trade Nation's Influencer program and receive a monthly fee for using their TradingView charts in my analysis.
✅LIKE AND COMMENT MY IDEAS✅
EURJPY SHORT – DAILY FORECAST Q3 | W29 | D14 | Y25 GAP SHORT!!!!💼 EURJPY SHORT – DAILY FORECAST
Q3 | W29 | D14 | Y25
📊 MARKET STRUCTURE SNAPSHOT
EURJPY is currently reacting from a key higher time frame supply zone, with price action showing weakness at premium levels. Structure and momentum are now aligning for a short opportunity backed by multi-timeframe confluence.
🔍 Confluences to Watch 📝
✅ Daily Order Block (OB)
Strong reaction and early signs of distribution.
Previous bullish momentum is losing steam; structure is flattening with rejection wicks forming.
✅ 4H Order Block
Break of internal structure (iBoS) confirms a short-term bearish transition.
✅ 1H Order Block
1H structure shift bearish
📈 Risk Management Protocols
🔑 Core principles:
Max 1% risk per trade
Only execute at pre-identified levels
Use alerts, not emotion
Stick to your RR plan — minimum 1:2
🧠 You’re not paid for how many trades you take, you’re paid for how well you manage risk.
🧠 Weekly FRGNT Insight
"Trade what the market gives, not what your ego wants."
Stay mechanical. Stay focused. Let the probabilities work.
🏁 Final Thoughts from FRGNT
📌 The structure is clear.
The confluences are stacked.
Let execution follow discipline, not emotion.
EURJPY SHORT – WEEKLY FORECAST Q3 | W29 | Y25💼 EURJPY SHORT – WEEKLY FORECAST
Q3 | W29 | Y25
📊 MARKET STRUCTURE SNAPSHOT
EURJPY is currently reacting from a key higher time frame supply zone, with price action showing weakness at premium levels. Structure and momentum are now aligning for a short opportunity backed by multi-timeframe confluence.
🔍 Confluences to Watch 📝
✅ Daily Order Block (OB)
Strong reaction and early signs of distribution.
Previous bullish momentum is losing steam; structure is flattening with rejection wicks forming.
✅ 4H Order Block
Break of internal structure (iBoS) confirms a short-term bearish transition.
✅ 1H Order Block
1H structure shift bearish
📈 Risk Management Protocols
🔑 Core principles:
Max 1% risk per trade
Only execute at pre-identified levels
Use alerts, not emotion
Stick to your RR plan — minimum 1:2
🧠 You’re not paid for how many trades you take, you’re paid for how well you manage risk.
🧠 Weekly FRGNT Insight
"Trade what the market gives, not what your ego wants."
Stay mechanical. Stay focused. Let the probabilities work.
🏁 Final Thoughts from FRGNT
📌 The structure is clear.
The confluences are stacked.
Let execution follow discipline, not emotion.
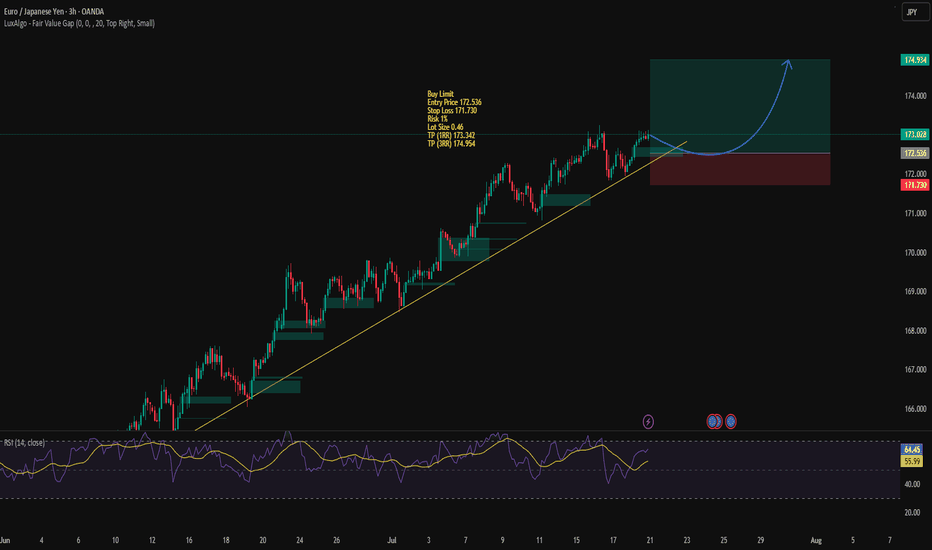
EURJPY POSSIBLE EXPECTED MOVEIn this analysis we're focusing on 1H time frame. Today I'm looking for a potential buy move from my marked key levels. This is a higher time frame analysis. Let's analyze more deeply into smaller timeframe and potential outcomes. Confirmation is very important.
Always use stoploss for your trade.
Always use proper money management and proper risk to reward ratio.
This is my analysis.
#EURJPY 1H Technical Analysis Expected Move.
EURJPY – Breakout Retest Trade | TCB Strategy ExecutionEURJPY – Breakout Retest Trade | TCB Strategy Execution
📍 Pair: EURJPY
🕒 Timeframe: 4H
📅 Date: July 13, 2025
📈 Strategy: TCBFlow (Trend → Countertrend → Breakout)
🔹 Market Context:
EURJPY is maintaining bullish structure within a rising trend channel. After a corrective dip, price has reclaimed structure above 171.550–171.640 and broken above resistance with momentum.
This move creates a potential retest buy opportunity, targeting the 174.00 region as part of a breakout continuation.
✅ TCB Breakdown:
Trend: Clear bullish channel holding
Countertrend: Short pullback into structure demand
Breakout: Price broke above minor resistance (171.640–172.338)
🎯 Trade Idea:
Buy Zone: 171.640–171.552 (retest of breakout)
SL: Below 171.20
TP Target: 174.000 zone (measured move + expansion target)
📊 Checklist Score: 90–95%
✅ Clean trend structure
✅ Valid countertrend breakout
✅ Momentum break with potential NY retest
