JPYEUR trade ideas


Trendline BreakThe price has broken a bearish trendline and followed by a pullback and now looks to have a bearish impulse
WE ONLY TRADE PULLBACKS

EURJPY, 440 Pips Drop, 5RR, Premium SignalBased on my trading algorithm, EURJPY is about to drop 440 pips and give a 5RR return.

EUR JPY #0007 Long Swing Trade- The trade is heavily reliant on the liquidity pools exist along the structures
- Fair Value Gap coupled by an order block indicates an Imbalanced in price movement.
- Multiple failed attempts to break the Intra-Liquidity Pools (towards Bullish), indicating exhaustion in the bullish bias.
- customary, a fair value gap presents an imbalance in price, where the market will react to it by a set of corrections, and we aim to capitalize on that.
- The Buy Limit is placed at the price within the order blocks and SL is placed outside the Larger Liquidity Pool,s giving enough room for price "play-around".
- TP target will be on the Larger Liquidity Pools
- Trade is Swing in Nature.

EUR/JPY Technical Outlook: Poised for Breakout Above 162.60The EUR/JPY trades higher ahead of ECB monetary policy today. It hits an intraday high of 162.57 and is currently trading around 162.45. The intraday outlook is bullish as long as the support 161.50 holds.
Technical Analysis:
The EUR/JPY pair is trading above 34, below 55 EMA and 200-4H EMA in the 15 min chart.
Near-Term Resistance: Around 162.60 a breakout here could lead to targets at 163/163.30/164.20/165/166.65/167.
Immediate Support: At 162 if breached, the pair could fall to 161.50/161/160.50/160/ 159.25/158.85/158.25.
Indicator Analysis 1-hour chart):
CCI (50): Bullish
Average Directional Movement Index: Bullish
Overall, the indicators suggest the bullish trend
Trading Recommendation:
It is good to buy on dips around 162.38-40 with stop loss at 162.750 for a TP of 164.18.

Bullish bounce?EUR/JPY is falling towards the pivot which acts as an overlap support and could bounce to the 1st resistance which is also an overlap resistance.
Pivot: 160.89
1st Support: 159.93
1st Resistance: 162.23
Risk Warning:
Trading Forex and CFDs carries a high level of risk to your capital and you should only trade with money you can afford to lose. Trading Forex and CFDs may not be suitable for all investors, so please ensure that you fully understand the risks involved and seek independent advice if necessary.
Disclaimer:
The above opinions given constitute general market commentary, and do not constitute the opinion or advice of IC Markets or any form of personal or investment advice.
Any opinions, news, research, analyses, prices, other information, or links to third-party sites contained on this website are provided on an "as-is" basis, are intended only to be informative, is not an advice nor a recommendation, nor research, or a record of our trading prices, or an offer of, or solicitation for a transaction in any financial instrument and thus should not be treated as such. The information provided does not involve any specific investment objectives, financial situation and needs of any specific person who may receive it. Please be aware, that past performance is not a reliable indicator of future performance and/or results. Past Performance or Forward-looking scenarios based upon the reasonable beliefs of the third-party provider are not a guarantee of future performance. Actual results may differ materially from those anticipated in forward-looking or past performance statements. IC Markets makes no representation or warranty and assumes no liability as to the accuracy or completeness of the information provided, nor any loss arising from any investment based on a recommendation, forecast or any information supplied by any third-party.

EURJPY 15minutes Forecast Hello guys I hope you're well Let me tell you. wait until our demand zone then our target will be in our area.

EURJPY Potential DownsidesHey Traders, in today's trading session we are monitoring EURJPY for a selling opportunity around 162.100 zone, EURJPY is trading in a downtrend and currently is in a correction phase in which it is approaching the trend at 162.100 support and resistance area.
Trade safe, Joe.


EUR change to bullish which will leads for strong bullish trend Hello Traders,
straight to the point we all saw the strong bearish pattern for the head and shoulders which indicates strong bearish movement and change in the trend however ! that was before the trade war that changes every thing and the way the market react is very clear we all saw strong movement on the bearish pairs and the opposite
*i saw strong gab to the down side was easily recovered and closed and continue to grow the up trend
*strong double bottoms and retest
*i break and close above the trend line will give us very clean move to the 170 again
*fake break and close under the trend line another clean move to the 161
and you how do you see the next move ? please share your ideas and tell me what could work better

EUR/JPY - Positive uptrend formulating!Hi guys please find below our analysis over EUR/JPY
1. Technical Momentum
EUR/JPY has recently broken above key resistance levels, suggesting bullish momentum. The pair is trending above its 50-day and 100-day moving averages, a signal of continued strength. RSI levels remain in bullish territory without being overbought, indicating room for further upside.
2. Diverging Monetary Policy
The European Central Bank (ECB) remains cautious on policy easing despite market expectations, while the Bank of Japan (BoJ) continues its ultra-loose stance with only minimal steps toward normalization. This policy divergence has been a significant driver for EUR/JPY strength and is likely to persist in the near term.
The BoJ’s slow exit from yield curve control and a historically dovish posture mean the yen remains weak relative to the euro, which benefits from steady economic resilience in the eurozone.
3. Improving Risk Sentiment
Global equity markets have been rebounding, and risk sentiment is turning positive. In such environments, the yen—traditionally a safe-haven currency—tends to weaken as investors move capital toward higher-yielding assets like the euro.
4. Economic Stability in the Eurozone
Recent Eurozone data, particularly out of Germany and France, has surprised to the upside. PMI figures and business confidence indices are beginning to recover, suggesting that the worst of the economic slowdown may be behind. This improves investor sentiment toward the euro.
Conclusion - Due to the positive Fundamental news coming from the Eurozone gives us a positive indication to showcase growth potential in this pair. From a technical overview, the analysis is supported by the MACD and RSI giving positive indication of a Ascending Channel formulating.
📌 Trade Plan
📈 Entry: 162.115
✅ Target 163.150
❌ SL: 161.400

EURJPY Is Very Bullish! Buy!
Please, check our technical outlook for EURJPY.
Time Frame: 2h
Current Trend: Bullish
Sentiment: Oversold (based on 7-period RSI)
Forecast: Bullish
The market is approaching a key horizontal level 162.005.
Considering the today's price action, probabilities will be high to see a movement to 163.310.
P.S
We determine oversold/overbought condition with RSI indicator.
When it drops below 30 - the market is considered to be oversold.
When it bounces above 70 - the market is considered to be overbought.
Disclosure: I am part of Trade Nation's Influencer program and receive a monthly fee for using their TradingView charts in my analysis.
Like and subscribe and comment my ideas if you enjoy them!

EJ Short
---
EUR/JPY – Short Entry @ 161.316
Entry Justification
Price rejected off the upper boundary of a well-defined range that has held since early April. The area aligns with a supply zone formed after the last impulsive sell-off. A Break of Structure occurred a few days prior, shifting internal order flow bearish and invalidating the prior bullish leg.
Today’s entry capitalized on a textbook retest of the range high, where price wicked into the upper liquidity pocket and immediately sold off, confirming continued seller interest. This entry offered high reward-to-risk potential with tight invalidation parameters and clear structure control.
Macro Alignment
- Euro weakened by dovish ECB tone, increasing likelihood of June rate cuts
- JPY gaining mild strength on recent risk-off shifts and flight to safety behavior
- Global equity market hesitations support further downward pressure on EUR/JPY
Trade Logic:
-Range-top rejection with bearish order flow confirmation
-BOS already printed prior to entry, offering structure-based conviction
-Macro + sentiment alignment supports short bias
-Technical entry aligned with bearish liquidity cycle and exhaustion at highs
---

Short trade
1Hr TF overview
📉 Trade Breakdown – Sell-Side (EUR/JPY)
📅 Date: Tuesday, April 15, 2025
⏰ Time: 10:00 AM – NY Session AM
📈 Pair: EUR/JPY
🧭 Direction: Short (Sell)
Trade Parameters:
Entry: 161.906
Take Profit (TP): 161.137 (–0.47%)
Stop Loss (SL): 162.058 (+0.09%)
Risk-Reward Ratio (RR): 5.06
🧠 Trade Narrative:
I assume a sell off of a lower high or supply zone, involving:
Targeting an intraday low or PD array level for this sellside trade idea.

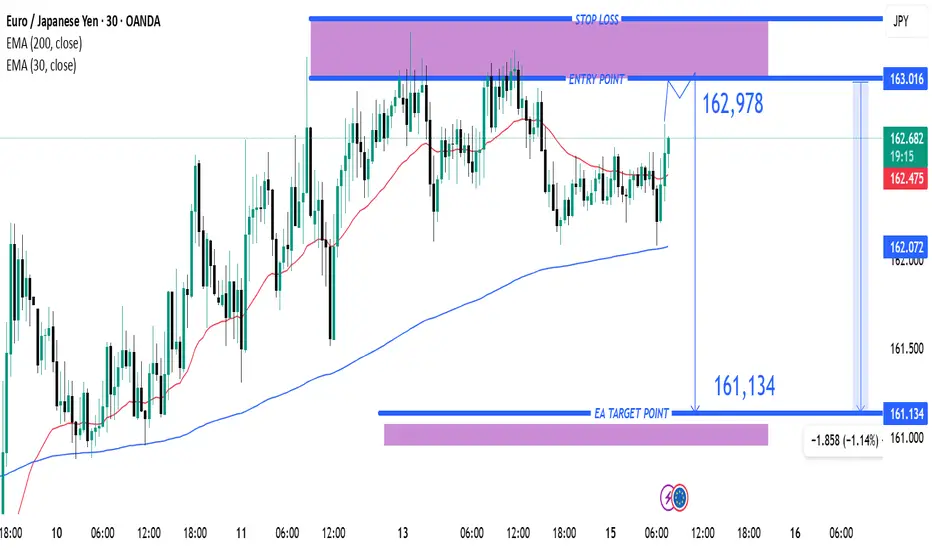
EUR/JPY Short Setup – Bearish Reversal Targeting 161.134 with TiEMA 30 (red): Currently at 162.470
EMA 200 (blue): Currently at 162.071
Trade Setup:
Entry Point: Around 162.978
Stop Loss: Slightly above 163.016 (highlighted in purple zone)
Target (Take Profit): 161.134 (labeled as “EA TARGET POINT”)
Analysis:
Trend: The pair has been trending upwards recently, as shown by the price staying above the 200 EMA.
Current Price: 162.604, just below the proposed entry.
Risk/Reward:
Risk: ~3.8 pips (entry to stop loss)
Reward: ~184.4 pips (entry to target)
This implies a favora
EURJPY still bullish for expect
OANDA:EURJPY strong bullish push we are have on start of month, thoughts are strong bullish volume is gathered and the we can see still here bullish trend.
Currently price is in ASCENDING CHANNEL, expecting to see break of same and new bullish push.
SUP zone: 158.500
RES zone: 164.500

EURJPY still bullish view
OANDA:EURJPY first analysis attached, in new analysis, we have new structures created (BULLISH FLAG, ZONE, TREND LINE), both pairs dominant in market, personally here still bullish i am.
SUP zone: 160.350
RES zone: 163.400, 164.100

EURJPY MARKET ANALYSIS AND PRICE PREDICTIONEURJPY, has finished consolidating at the Institutional Renegotiation zone, decision has been taken in favor of the Bears already. Price is dropping towards the Renegotiation Support to sweep off the sell side liquidity. Entry is now.
Stop loss and Take Profit are clearly marked out on the chats.
GOOD LUCK!

EJI am expecting a bull run from here. A rally long. We were 3 for 3 yesterday gaining 7% on our account. Lets keep it rolling. We have a 1:3 R:R with this setup.

Setup of the Week: EURJPY Long Toward LiquidityI'm currently watching EURJPY for a potential long setup. Price is showing signs of bullish structure, and there’s a clean upside target sitting at 164.20, where equal highs rest on the weekly chart. That level also ends in a .20—an institutional number often used for stop placement—which adds confluence that price may be drawn toward it.
Why I'm Bullish
The Euro is showing strength across the board this week, supporting directional alignment.
Structure is starting to build bullish pressure, especially as price grinds upward toward liquidity.
We have weekly equal highs at 164.20, which is a clear magnet. (zoom out)
This setup is pretty straightforward: I’m anticipating that price wants to make a move toward those untouched highs. No extra complexity needed.
Recent Price Action
Looking at structure from April 9th:
Price sold off, took out a daily low, and then reversed sharply—classic manipulation and reclaim. The idea is that smart money will need to close those sell orders out if price returns to that zone.
The April 9th move down into 160 created what I believe is an institutional footprint.
This move took out liquidity, reversed hard, and left behind a zone I expect to be defended.
On Sunday’s weekly open, price quickly ran last week’s high, then reversed hard during the Tokyo session—a likely short-term trap. This tells me we might see some short-term bearish pressure before a larger move up, which is fine since I want price to return to the institutional buy zone around 160.00–160.30.
📍 Key Levels
Buy Zone: 160.00–160.30
This is where volume flooded in to drive the initial bullish manipulation move. If price returns, I expect heavy buying interest to step in.
Trap Confirmation: 162.80
During London open today, price ran a low, then reclaimed a high, and retested 162.80—another institutional level (ends in .80). That area acted as a trap and likely marked the start of the move down. We should see price stay under this move for this idea to work.
Target: 164.20
That’s the weekly equal high. Liquidity sits above there. If we return to the buy zone and bulls step in, I’ll be looking to ride the move up into that level.
Summary
I’m looking to long EURJPY on a retracement into 160.00–160.30, ideally after a stop hunt or false breakdown into that zone. The goal is to ride the volume push up toward the weekly target of 164.20, where stops likely sit from early sellers who might take a trendline break trade. If price respects the London trap at 162.80 and moves lower, I’ll be watching closely for reaction and confirmation in the buy zone.
Let me know your thoughts below or if you're watching the same levels.

EURJPY: Bullish Continuation
The charts are full of distraction, disturbance and are a graveyard of fear and greed which shall not cloud our judgement on the current state of affairs in the EURJPY pair price action which suggests a high likelihood of a coming move up.
Disclosure: I am part of Trade Nation's Influencer program and receive a monthly fee for using their TradingView charts in my analysis.
❤️ Please, support our work with like & comment! ❤️

EURJPY breakout setup: 969 pip move ahead?EURJPY has traded sideways for 257 days, forming a descending triangle. A breakout could trigger a move of nearly 1,000 pips. We discuss bullish and bearish scenarios, trade setup, risk-reward, and what could trigger the move.
This content is not directed to residents of the EU or UK. Any opinions, news, research, analyses, prices or other information contained on this website is provided as general market commentary and does not constitute investment advice. ThinkMarkets will not accept liability for any loss or damage including, without limitation, to any loss of profit which may arise directly or indirectly from use of or reliance on such information.
