eur jpy CLEAR THE NEXT SIDEMARKETS are going crazy because of donald trump but your analysis still must proceed
you must still aim to strike with precision
through the wins and losses
lets go
JPYEUR trade ideas

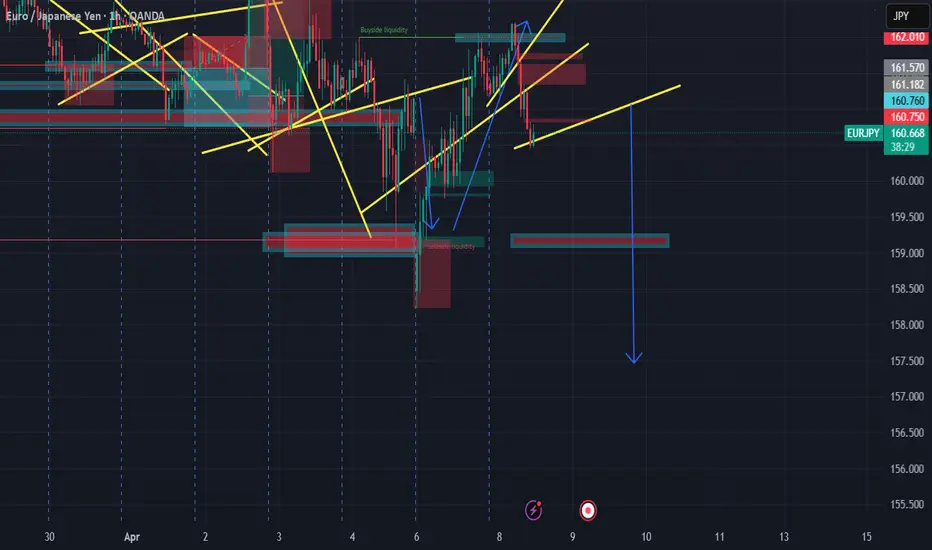
EURJPYCurrently, EUR/JPY is in a bearish trend on the 1-hour timeframe, forming lower highs and lower lows. The pair is currently taking support at a major support level.
If EUR/JPY reverses from this point without breaking the previous low of 158.977, and then gives a breakout above 161.143, we will consider entering a long position.
The stop-loss will be placed at 158.123, with targets set at 162.172 and 163.287.


EUR/JPY BULLISH IDEAAfter economical market data and price action analysis, in my perspective EUR could see a possible rally with regards to the JPY aligning with some of analysts sentiment.
If so my target for such rally would be 165.

Heading into 61.8% Fibonacci resistance?EUR/JPY is rising towards the pivot and could drop to the 1st support.
Pivot: 161.18
1st Support: 159.92
1st Resistance: 162.16
Risk Warning:
Trading Forex and CFDs carries a high level of risk to your capital and you should only trade with money you can afford to lose. Trading Forex and CFDs may not be suitable for all investors, so please ensure that you fully understand the risks involved and seek independent advice if necessary.
Disclaimer:
The above opinions given constitute general market commentary, and do not constitute the opinion or advice of IC Markets or any form of personal or investment advice.
Any opinions, news, research, analyses, prices, other information, or links to third-party sites contained on this website are provided on an "as-is" basis, are intended only to be informative, is not an advice nor a recommendation, nor research, or a record of our trading prices, or an offer of, or solicitation for a transaction in any financial instrument and thus should not be treated as such. The information provided does not involve any specific investment objectives, financial situation and needs of any specific person who may receive it. Please be aware, that past performance is not a reliable indicator of future performance and/or results. Past Performance or Forward-looking scenarios based upon the reasonable beliefs of the third-party provider are not a guarantee of future performance. Actual results may differ materially from those anticipated in forward-looking or past performance statements. IC Markets makes no representation or warranty and assumes no liability as to the accuracy or completeness of the information provided, nor any loss arising from any investment based on a recommendation, forecast or any information supplied by any third-party.

Risk OFF = further JPY strength? Yes - SELL EURJPYAll the information you need to find a high probability trade are in front of you on the charts so build your trading decisions on 'the facts' of the chart NOT what you think or what you want to happen or even what you heard will happen. If you have enough facts telling you to trade in a certain direction and therefore enough confluence to take a trade, then this is how you will gain consistency in you trading and build confidence. Check out my trade idea!!
www.tradingview.com

EUR/JPY Bullish Reversal Setup – Entry, Stop Loss & Target StratEMA (30) - Red Line (160.596): Short-term trend.
EMA (200) - Blue Line (161.267): Long-term trend, currently above the 30 EMA indicating a bearish macro trend.
2. Entry Zone:
Marked in purple between 159.751 and 160.161, suggesting a buy (long) opportunity if price retests this demand/support zone.
3. Stop Loss:
Set just below the entry zone at 158.907, protecting against deeper bearish momentum.
4. Target Zone:
163.025 is the profit target, with a purple rectangle showing a resistance/supply zone around that level.
5. Price Action:
The price is currently consolidating near the ent

EURJPY Short Opportunity: AI-driven Analysis Suggests Bearish MoEASY Trading AI indicates a strong SELL signal for the EURJPY pair. Current Entry Price stands at 160.204, targeting Take Profit at 159.41466667, with a necessary precautionary Stop Loss set at 161.59466667. This bearish stance is supported by recent momentum shifts and significant resistance rejection near key price levels identified through neural network pattern recognition. Technical indicators integrated into the EASY Trading AI point consistently downward, highlighting potential selling pressure and increased volatility ahead.

Short - EUR/JPYBase on the market structure in the smaller timeframe. We can see a potential CHOCH in the 30 minute timeframe. This allows me to understand that there is a potential chance for the price to change its direction. I will be looking for a position to leverage my short position.

EURJPY What Next? BUY!
My dear followers,
I analysed this chart on EURJPY and concluded the following:
The market is trading on 160.85 pivot level.
Bias -Bullish
Technical Indicators: Both Super Trend & Pivot HL indicate a highly probable Bullish continuation.
Target - 161.67
About Used Indicators:
A super-trend indicator is plotted on either above or below the closing price to signal a buy or sell. The indicator changes color, based on whether or not you should be buying. If the super-trend indicator moves below the closing price, the indicator turns green, and it signals an entry point or points to buy.
Disclosure: I am part of Trade Nation's Influencer program and receive a monthly fee for using their TradingView charts in my analysis.
———————————
WISH YOU ALL LUCK

expecting eur jpy to take a FULL SLIDE TO THE DOWNSIDE158.461 DOWNSIDE TARGET for eur jpy im expecting a full liqudity slide
on structure until we see some sell side exhaustion in price action
eurjpy 8 AprAppear to be a break out of channel, if can maintain above, should go higher towards the mark region

EUR/JPY NEXT MOVESell after bearish candle stick pattern, buy after bullish candle stick pattern....
Best bullish pattern , engulfing candle or green hammer
Best bearish pattern , engulfing candle or red shooting star
NOTE: IF YOU CAN'T SEE ANY OF TOP PATTERN IN THE ZONE DO NOT ENTER
Stop lost before pattern
R/R %1/%3
Trade in 5 Min Timeframe, use signals for scalping

EURJPY Bearish Breakout!
HI,Traders !
EUR-JPY broke the rising
Support line and the breakout
Is confirmed so we are
Bearish biased and we
Will be expecting a
Further move down !
Comment and subscribe to help us grow !

EURJPY 07/04/2025Weekly:
-Inverse H&S pattern.
-FVG.
Daily:
-Inverse H&S pattern.
-Bullish M pattern.
-Liquidity sweep.
4H:
-Inverse H&S pattern.

EURJPYWe can attempt to buy EURJPY from specified level as it make HL , also there is no bearish divergence occur indicate that it moves upward.
SL , TP mention in chart.

EUR/JPY "The Yuppy" Forex Bank Heist Plan (Swing/Day)🌟Hi! Hola! Ola! Bonjour! Hallo! Marhaba!🌟
Dear Money Makers & Robbers, 🤑 💰💸✈️
Based on 🔥Thief Trading style technical and fundamental analysis🔥, here is our master plan to heist the EUR/JPY "The Yuppy" Forex Market. Please adhere to the strategy I've outlined in the chart, which emphasizes long entry. Our aim is the high-risk ATR Zone. Risky level, overbought market, consolidation, trend reversal, trap at the level where traders and bearish robbers are stronger. 🏆💸"Take profit and treat yourself, traders. You deserve it!💪🏆🎉
Entry 📈 : "The heist is on! Wait for the MA breakout (164.000) then make your move - Bullish profits await!"
however I advise to Place Buy stop orders above the Moving average (or) Place buy limit orders within a 15 or 30 minute timeframe most recent or swing, low or high level.
📌I strongly advise you to set an "alert (Alarm)" on your chart so you can see when the breakout entry occurs.
Stop Loss 🛑: "🔊 Yo, listen up! 🗣️ If you're lookin' to get in on a buy stop order, don't even think about settin' that stop loss till after the breakout 🚀. You feel me? Now, if you're smart, you'll place that stop loss where I told you to 📍, but if you're a rebel, you can put it wherever you like 🤪 - just don't say I didn't warn you ⚠️. You're playin' with fire 🔥, and it's your risk, not mine 👊."
📍 Thief SL placed at the recent/swing low level Using the 4H timeframe (161.000) Day / swing trade basis.
📍 SL is based on your risk of the trade, lot size and how many multiple orders you have to take.
🏴☠️Target 🎯: 167.000 (or) Escape Before the Target
🧲Scalpers, take note 👀 : only scalp on the Long side. If you have a lot of money, you can go straight away; if not, you can join swing traders and carry out the robbery plan. Use trailing SL to safeguard your money 💰.
EUR/JPY "The Yuppy" Forex Market Heist Plan (Swing / Day Trade) is currently experiencing a bullishness,., driven by several key factors.👇👇👇
📰🗞️Get & Read the Fundamental, Macro, COT Report, Quantitative Analysis, Sentimental Outlook, Intermarket Analysis, Future trend targets..., go ahead to check 👉👉👉🔗
⚠️Trading Alert : News Releases and Position Management 📰 🗞️ 🚫🚏
As a reminder, news releases can have a significant impact on market prices and volatility. To minimize potential losses and protect your running positions,
we recommend the following:
Avoid taking new trades during news releases
Use trailing stop-loss orders to protect your running positions and lock in profits
💖Supporting our robbery plan 💥Hit the Boost Button💥 will enable us to effortlessly make and steal money 💰💵. Boost the strength of our robbery team. Every day in this market make money with ease by using the Thief Trading Style.🏆💪🤝❤️🎉🚀
I'll see you soon with another heist plan, so stay tuned 🤑🐱👤🤗🤩

EURJPY SellEUR/JPY is showing signs of bearish momentum after a recent retracement into key resistance levels. This analysis will break down the key levels, market structure, and potential trade setups based on the 1-hour chart.
Bearish Market Structure & Resistance Rejection
The chart indicates a clear downtrend, with lower highs and lower lows forming. The recent rally into resistance aligns with Fibonacci retracement levels, suggesting a potential continuation of the bearish trend.
Key Areas of Interest
Resistance Zone at 160.60 - 160.75: This area, marked as an "Area of Interest," aligns with the 0.5 and 0.618 Fibonacci retracement levels, making it a potential turning point for bearish continuation.
Support at 158.44: This level aligns with the Asian session low and could serve as the next bearish target if price resumes its downward movement.
Fibonacci Retracement & Potential Sell Zones
Price is currently retracing within the Fibonacci levels, with the 0.5 and 0.618 zones acting as potential resistance. If price fails to break above 160.75, a strong rejection could signal a sell opportunity targeting lower support levels.
Liquidity
Liquidity is likely sitting below the recent lows near 158.44. A stop-hunt scenario could see price briefly pushing above resistance before reversing downward.
Bearish Scenario: If price rejects the 160.60 - 160.75 zone with bearish confirmation (such as a strong rejection wick or bearish engulfing candle), traders could look for short entries targeting 159.40 and then 158.44.
Bullish Scenario: If price breaks and holds above 160.75, it could invalidate the bearish setup, opening the door for a potential push toward 161.20.
TRADE
Entry: 160.649
Stop Loss: 161.095
Take Profit: 159.242

EURJPY: Top formation, sell opportunity.EURJPY is neutral on its 1D technical outlook (RSI = 53.515, MACD = 0.340, ADX = 26.005) as it ranges between its 1D MA50 and 1D MA200. This is a peak formation on the LH trendline of the 5 month Channel Down identical to January. At least a -6.20% bearish wave is to be expected. Today's spike gives an even better sell entry for a TP = 154.00.
## If you like our free content follow our profile to get more daily ideas. ##
## Comments and likes are greatly appreciated. ##

EUR/JPY Bullish Breakout Setup with 2.02% Target PotentialEMA 30 (red): 160.813
EMA 200 (blue): 161.441
---
Highlighted Zones & Points:
1. Entry Point:
Marked around 160.719 (just below EMA 30)
Positioned in a demand/support zone (highlighted purple box)
2. Resistance Point:
Marked at 161.799
Serves as a minor resistance level before the major target
3. EA Target Point:
Final target is 163.880
This represents a potential move of 3.253 units or 2.02%
---
Interpretation:
Bullish Bias: The chart suggests a bullish setup, anticipating a breakout above EMA 200 and the resistance point toward the target of 163…

Is EURJPY trying to break the resistance move again to 176 area?OUT OF BOX THOUGHTS -Risky : Last week, EURJPY experienced a false breakout and has been spending a considerable amount of time consolidating near the resistance zone. Is it trying to break through the resistance and reach 176 again? Let's find out.

EUR JPY #0002 Short Position Trading - The Weekly chart indicating a downtrend
- There was a presence of a false breakout price action named Inverted hammers on weekly charts
- The Daily Charts reflecting a presence of order blocks signified a accumulation of short position is undergoing.
- I decided to place entry at the last weekly candle's HIGH as my liquidity area.
- The rest are as labelled
- This is meant for Swing/position trading - might take some time
- less headache
- I am a revert position-trader, from the sin of Scalping.

London session short Price failed to move last week while accumulating positions. Asian session created bos looking to short in London/NY session.
