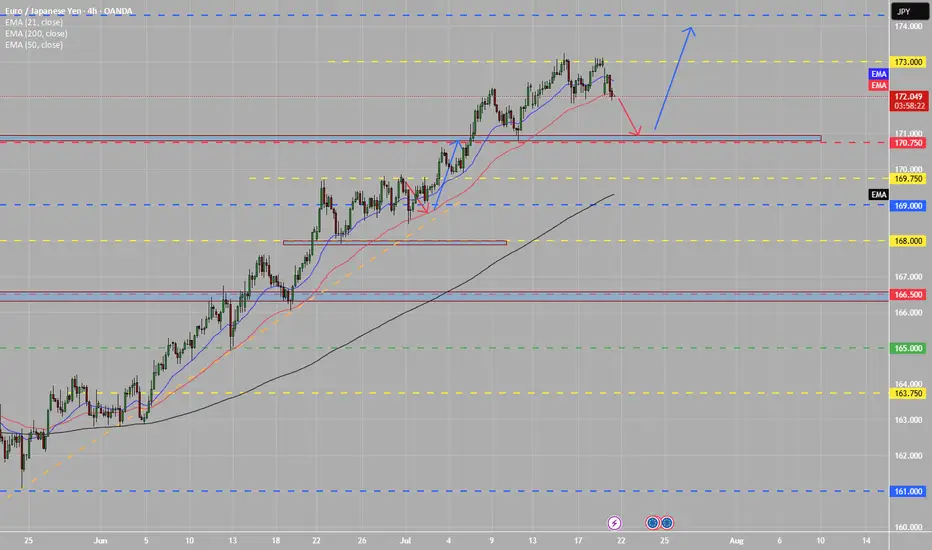
EURJPY Hits Supply | Pullback Is ComingPrice has entered the daily supply zone (red area) between 170.80 and 171.80, showing immediate rejection with a long upper wick — a signal of potential short-term bearish reaction.
The RSI is turning lower, indicating loss of momentum, although it hasn’t reached extreme levels yet.
The current map suggests a technical pullback toward the 169.40–168.50 zone (FVG + dynamic support) before any potential bullish continuation toward 174+.
The overall structure remains bullish, but a correction looks likely due to technical exhaustion and retail positioning.
📊 2. COT Report (JPY Futures – as of 2025-07-01)
Non-Commercials (speculators) reduced long positions on the JPY by -7,779 contracts, and also slightly trimmed shorts → clear sign of position reduction.
Net positioning remains strongly negative (JPY weakness), but it's starting to recover slightly.
Commercials added both longs (+2,830) and shorts (+5,977), indicating indecision but growing interest.
Open interest slightly decreased (–516), though it remains elevated.
👉 The market has not yet reversed, but the JPY downtrend may be approaching exhaustion.
🧠 3. Retail Sentiment
86% of retail traders are short EUR/JPY — a strong contrarian bullish signal.
Average retail short entry: 166.27, while current price is 171.55 → retail traders are trapped and under pressure.
A short squeeze is likely underway or already completed, increasing the risk of a technical correction after distribution.
📅 4. Seasonality
July is historically weak for EUR/JPY:
20Y: -0.35
15Y: -0.49
10Y: -0.18
August tends to be even worse from a seasonal perspective.
This supports the idea of a potential pullback in the coming days or weeks.
Trading Conclusion
Current Bias: Short-term Neutral–Bearish, Medium-term Bullish.
✳️ Potential pullback from 172.30 toward 169.40–168.50
🎯 If price holds and builds clean bullish structure, expect continuation toward 174.00–175.00
❌ Invalidation on daily close below 167.80
JPYEUR trade ideas

EURJPY ANALYSIS After seeing the previous weekly candle close bullish and the past few weeks pushing to the upside we could expect the momentum to continue into weekly highs of 175.000

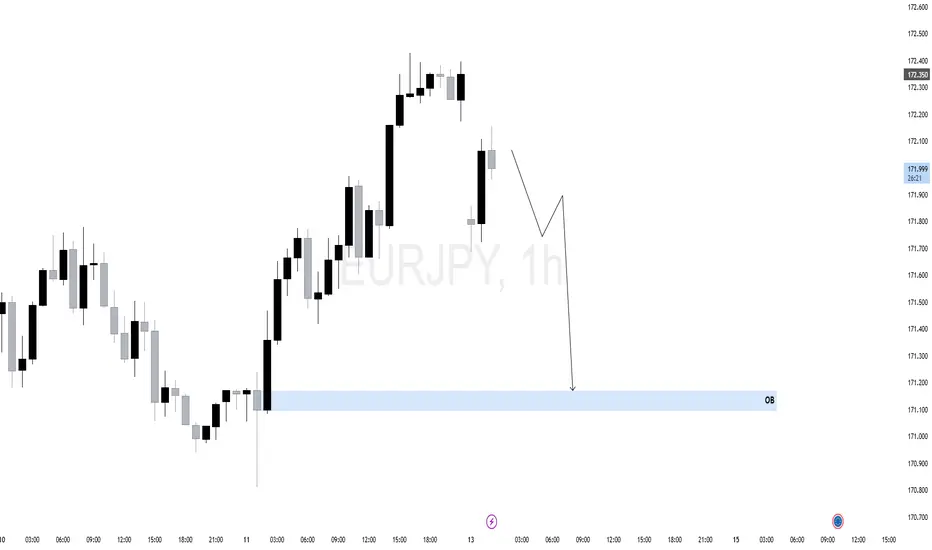
$EJ (EURJPY) 1HEURJPY recently showed a strong bullish rally off a key 1H Order Block (OB) near 171.200. This rally swept sell-side liquidity before shifting short-term structure.
However, current price action shows signs of weakness — multiple rejection wicks near 172.350 and a potential shift in momentum.
The corrective structure forming suggests the bullish move may have been a liquidity run. A clean lower high may confirm bearish intent.
As long as price remains below the recent swing high, we anticipate a short-term retracement toward the OB zone (171.200), which aligns with an area of unfilled orders and possible rebalancing.
EURJPY Long Trade There is an order block that started the long ride up, the ride up broke the previous Higher high.
It is expected that it come back to retest the order block, if this happen it will give up opportunity to go long


EURJPY – Buy the Dip in a Continuing UptrendTrade Idea
Type: Buy Limit
Entry: 171.00
Target: 172.50
Stop Loss: 170.25
Duration: Intraday
Expires: 11/07/2025 06:00
Technical Overview
The primary trend remains bullish, with no clear signs that the upward move is ending.
While a correction is possible, it is expected to be contained within the broader uptrend, providing an opportunity to buy at lower levels.
A move above 172.00 will confirm renewed bullish momentum, supporting a move toward 172.50, with a measured move target at 172.75.
Current levels do not offer a good risk/reward for immediate buying, so waiting for a dip to 171.00 is preferred.
No significant economic events are scheduled in the next 24 hours, keeping the focus on technical factors.
Key Technical Levels
Support: 172.00 / 171.50 / 171.00
Resistance: 172.00 / 172.50 / 172.75
Disclosure: I am part of Trade Nation's Influencer program and receive a monthly fee for using their TradingView charts in my analysis.

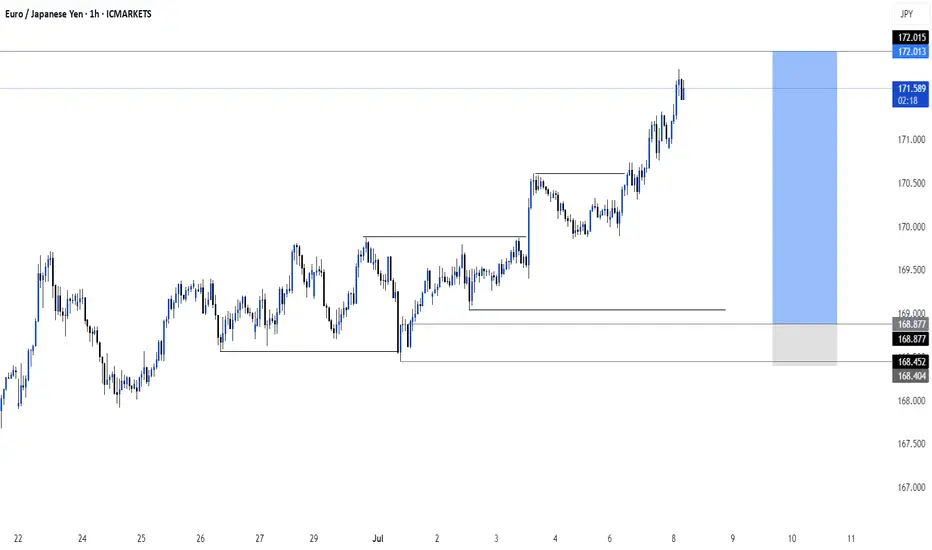
eurjpy buy setup Setup Breakdown:
1. Previous Downtrend and Market Structure Shift (MSS):
Price was in a clear downtrend, as seen on the left side.
A Market Structure Shift (MSS) is marked — this suggests the beginning of a potential bullish reversal.
After MSS, price makes a higher high and pulls back, indicating bullish interest.
2. Liquidity Grab Below Previous Day’s Low (PDL):
Price swept below the Previous Day's Low (PDL) and into a demand zone (blue and purple shaded box).
This is a classic liquidity hunt — smart money clears out stop losses below the PDL before reversing.
3. Refined Demand Zone (Entry):
Entry is planned at the refined demand zone, where price previously showed buying interest.
The entry (pink box) is within this zone, suggesting you’re anticipating a reaction there.
4. FVG (Fair Value Gap) Fill and Targeting Supply:
The target zone is marked in the grey box at the top, just below 172.221, likely a previous supply area or unmitigated order block.
The grey shaded area is a high reward zone, showing you expect a strong bullish move from demand into that supply.
5. Risk-to-Reward:
Stop loss just below the demand zone, likely under the liquidity sweep.
Take profit is around 2–3x the stop distance, targeting the premium/supply area.
✅ Why This is a Strong Buy Setup:
MSS confirmed (shift from bearish to bullish structure).
PDL sweep = liquidity grab → fuels bullish move.
Entry in refined demand aligned with price action logic.
Clear imbalanced area above → price may seek to fill inefficiencies.
High Risk-Reward with low drawdown potential if demand holds


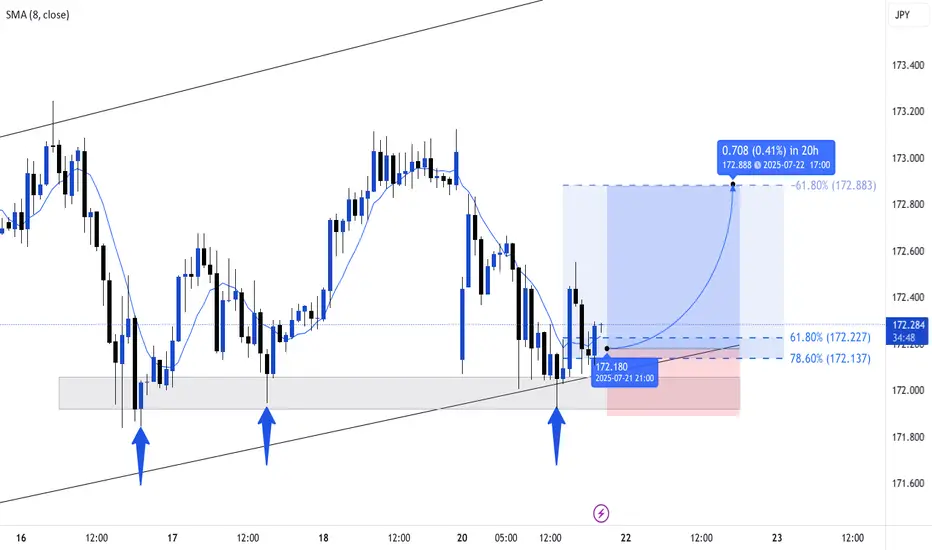
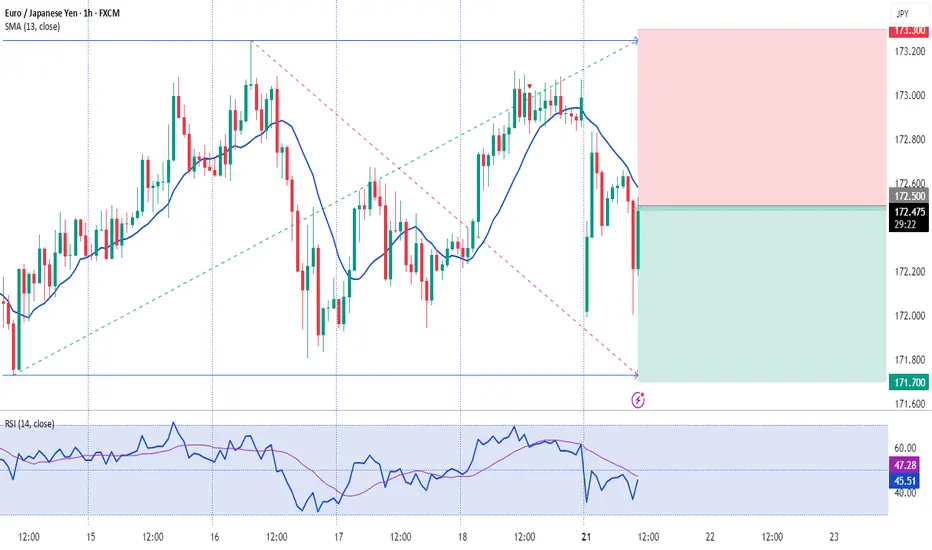
EURJPY Potential Sell ZoneI've set 2 pending limit orders here. One for the 1:1 RR and the other for a 1:4.3 RR. If the first trade holds we get a free shot at the 1:4 RR. NFA. Manage your risk accordingly. Sometimes I'll move to BE on trade 2 once we clear 1:2 RR.

EUR/JPY Hits 12-Month HighEUR/JPY Hits 12-Month High
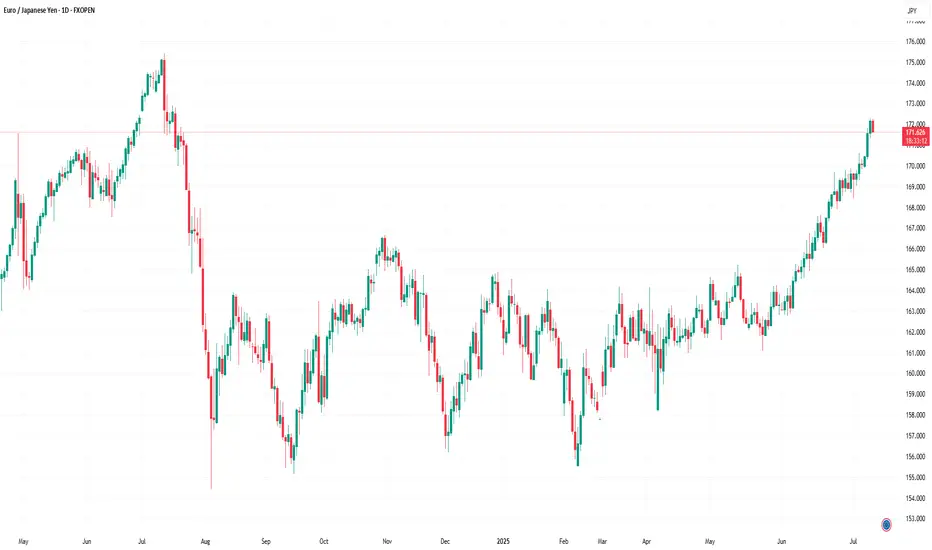
As the chart indicates, the EUR/JPY pair has risen above ¥172 per euro — a level last seen in July 2024.
Since early June, the exchange rate has increased by approximately 5.6%. This upward movement is driven by a combination of factors, including:
→ Divergence in central bank policy: The European Central Bank’s key interest rate remains significantly higher than that of the Bank of Japan, making the euro more attractive in terms of yield compared to the yen.
→ US trade tariffs on Japan: The potential imposition of 25% tariffs by the United States on Japanese goods poses a threat to Japan’s export-driven economy, placing downward pressure on the national currency.
→ Eurozone expansion and consolidation: News of Bulgaria’s potential accession to the euro area is strengthening investor confidence in the single currency.
→ Weakness in the US dollar: As the US Dollar Index fell to its lowest level since early 2022 this July, demand for the euro has grown, positioning it as a key alternative reserve currency.
Can the rally continue?
Technical Analysis of EUR/JPY
For several months, the pair traded within a range of approximately ¥156–165 per euro, but has recently broken above the upper boundary of this channel. Based on technical analysis, the width of the previous range implies a potential price target in the region of ¥174 per euro.
It is noteworthy that the rally gained momentum (as indicated by the arrow) following the breakout above the psychological threshold of 170, a sign of bullish market dominance. At the same time, the RSI has surged to a multi-month high, signalling moderate overbought conditions.
Under these circumstances, the market may be vulnerable to a short-term correction, potentially:
→ Towards the lower boundary of the ascending channel (shown in orange);
→ To retest the psychological support around ¥170.
That said, a reversal of the prevailing trend would likely require a significant shift in the fundamental backdrop — for example, progress towards a trade agreement between Japan and the United States.
This article represents the opinion of the Companies operating under the FXOpen brand only. It is not to be construed as an offer, solicitation, or recommendation with respect to products and services provided by the Companies operating under the FXOpen brand, nor is it to be considered financial advice.
EUR JPY has reached a resistance area and more likely to go downEURJPY has good rally recently and crossed fib 0.5 and now looks to be facing resistance at a trendline which was support earlier, on 4 hr chart look for breakout of this trendline and enter the trade.

EUR/JPY buy opportunity!!!Eurjpy provides us with a possible buy opportunity around 170.544 (pullback support) a retrace to that zone provides a potential buy opportunity. Keep a close a watch to take advantage of this opportunity


EURJPY Bullish Breakout!
HI,Traders !
#EURJPY is trading in an
Uptrend an the pair made a
Bullish breakout of the key
Horizontal level of 169.790
Which is confirmed so after
pullback we will
Be expecting a further
Bullish continuation !
Comment and subscribe to help us grow !

EJ BULLISH SETUP Looking for a nice retest at the daily support zone, if this holds true price will start to look for monthly resistance marked in blue.
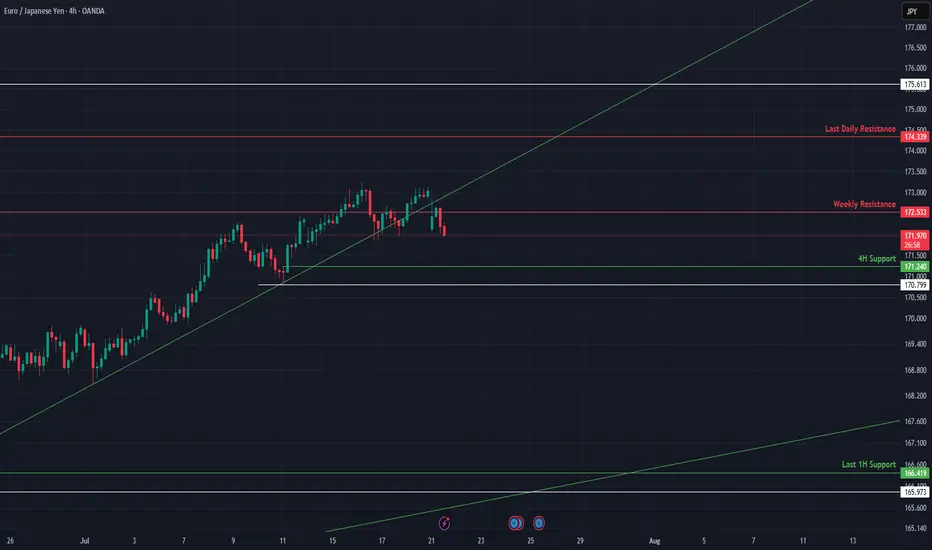
EURJPY at Risk of Breakdown Below Key Support📈 EURJPY Approaches Key Technical Breakout Point
EURJPY is caught between a critical 4H support and weekly resistance, with momentum beginning to compress. The next move hinges on whether price holds the rising trendline or breaks beneath it. This update outlines the active structure, key levels, and macro narrative around JPY weakness.
🔍 Technical Analysis:
EURJPY recently rejected from weekly resistance at 172.53 and is now sitting on the 4H support at 171.24, right above an ascending trendline. The structure remains bullish while this trendline holds, but a breakdown below 170.77 would flip the bias.
On the upside, reclaiming 172.53 opens the path toward 174.33 (Last Daily Resistance). If support gives way, expect a drop toward 166.80 or lower.
🛡️ Support Zones (if pullback continues):
🟢 171.24 – 4H Support (High Risk)
Immediate support. Good for tight risk scalps.
Stop-loss: Below 170.77
🟡 166.89 – 165.27 – 1H Last Support (Medium Risk)
Strong historical base + diagonal confluence. Favorable for intraday or swing entries.
Stop-loss: Below 165.00
🔼 Resistance Levels:
🔴 172.53 – Weekly Resistance
Key rejection point. Break above this confirms upside continuation.
🔴 174.33 – Last Daily Resistance
Major supply zone. Bullish breakout target.
🧭 Outlook:
Bullish Case:
Hold above 171.24 and break 172.53 = upside continuation toward 174.33.
Bearish Case:
Break below 170.77 and failure to reclaim = possible slide toward 166.80 and below.
Bias:
Neutral–bullish while price holds above trendline. Flip bearish on close below 170.77.
🌍 Fundamental Insight:
JPY remains weak due to BoJ’s ultra-loose stance. However, intervention risk remains elevated if yen depreciation becomes disorderly. Euro remains supported by ECB’s hawkish tone and improving economic data. Watch for BOJ rhetoric and global yield shifts.
✅ Conclusion:
EURJPY is resting at a structural pivot between 4H support and weekly resistance. A breakout in either direction will likely determine the trend into August. Bulls must defend the trendline and 171.24 to stay in control.
Not financial advice. Like & follow for more high-probability setups across FX majors.
short eurjpysell eurjpy targetting 100% fib level as tp1. even though it is a weekly analysis, i dont intend to stay in it for more than a week

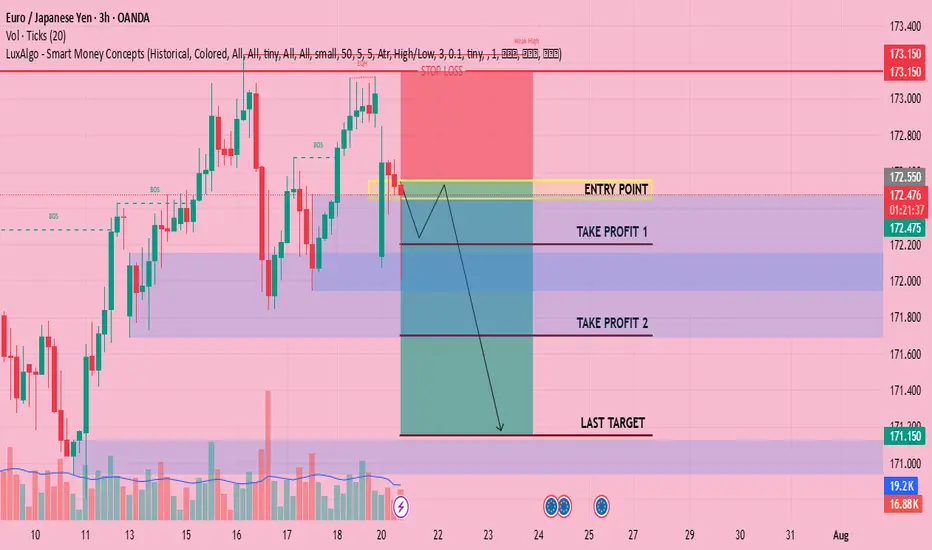
CHECK EURJPY SIGNAL READ CAPTAINEntry Point: Around 172.550 172.450
Stop Loss: Around 171.150
🎯 Target Levels
Take Profit 1:
172.200
Take Profit 2:
171.700
last target
171.150
EURJPYEUR/JPY is in a clear downtrend, and the marked zone is the best area for selling.
Dear friends, always trade with the trend
