I only need this tradeThis will be my only trade in Forex for a while if it doesn't stop me out. The pair is rolling over from a high resistance area. That trendline won't hold, I'll add heavily if it breaks down the trendline in the daily timeframe. SL triggers if a weekly candle CLOSES above 159.20, otherwise is just volatility. I'm holding this for several weeks. Patience is the key.
JPYEUR trade ideas

EURJPY potential bearish breakout over next few sessionsIchimoku daily and 4hr showing bearish moves. Price tested Senkou Span B at 158.492 and was swiftly rejected. Personally think this may have been a liquidity grab / stop hunt before the 3 following widespread bearish candles.
There was a bear trap earlier on 28th Feb. in the Asian session which as you can see, wicked down to 154.807. After triggering the bears push price up and shook out any remaining weak hands.
Look for a potential bearish breakout over the next few sessions.
in term of potential targets, there is an N wave at 152.755. Ultimate target for the Sym.Tri 147.400.

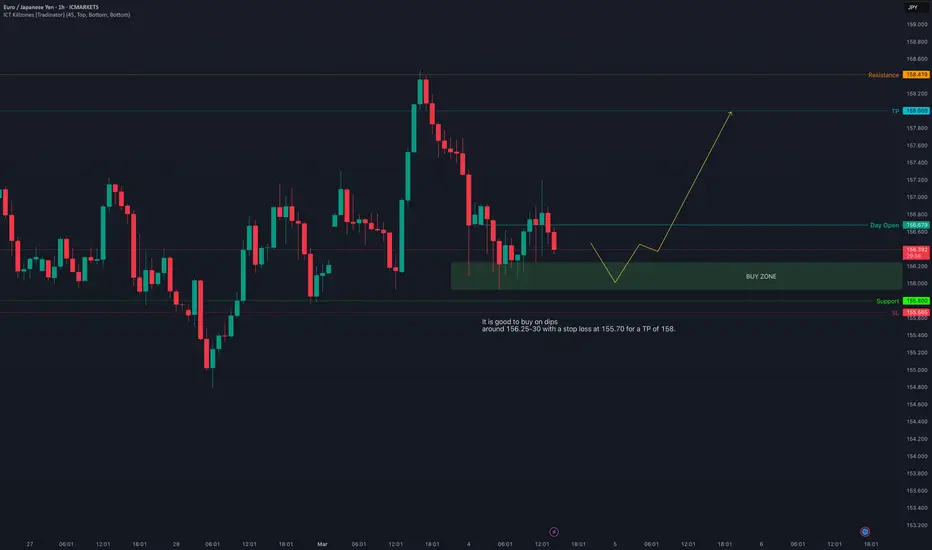
EURJPY Trade Ideahe EUR/JPY pared some of its gains from a minor top of 158.46. It hit an intraday low of 155.92 and is currently trading around 157.18. The intraday outlook is bullish as long as the support of 155.90 holds.
European leaders, led by UK Prime Minister Keir Starmer and French President Emmanuel Macron, are collaborating with Ukrainian President Volodymyr Zelenskyy to come up with a structured peace plan for Ukraine, prompted by concern regarding American commitment after a dispute between Presidents Trump and Zelenskyy. The strategy includes a "coalition of the willing" to ensure Ukrainian participation in the talks, a four-phase plan with continued support and security guarantees, and a proposed one-month ceasefire. While other European nations are likely to be engaged, the plan depends on securing U.S. participation, which is uncertain, especially given Russia's refusal of external intervention in peace talks
Technical Analysis:
The EUR/JPY pair is trading below the 34,55 EMA and 200-4H EMA in the 8-hour chart.
Near-Term Resistance: Around 158.50 a breakout here could lead to targets at 159/160.25/161/161.50/162/163/163.60/164/165/166.65/167.
Immediate Support: At 155.80– if breached, the pair could fall to 155.49/155/154.40.
Indicator Analysis 4-hour chart):
CCI (50): Neutral
Average Directional Movement Index: Neutral
Overall, the indicators suggest a mixed trend
Trading Recommendation:
It is good to buy on dips around 156.25-30 with a stop loss at 155.70 for a TP of 158.
EURJPY from an investor[long-term] perspective.Completion of the Wave 5 would be completion of a Flat correction of the larger zigzag highlighted in Yellow. Keep in mind that a retest on the 261.8% Fib would be a confirmation for a beautiful 5 wave move up. This is a very big move that will go well beyond 176.000 and should be capitalized. Note that this move should confirm before the NFP.

EURJPY Gearing Up for a Potential Upside MoveThe EURJPY pair is showing promising signs of upward momentum as it holds above key support levels. With improving risk sentiment, potential monetary policy shifts, and favorable technical patterns, the pair could be setting up for a steady climb.
In this analysis, we’ll examine critical levels, trend indicators, and macro drivers that could fuel further upside in EURJPY. Could this be the start of a bullish phase? Let’s explore!
Disclaimer:
Trading involves risk, and this analysis is for educational purposes only. Traders should perform their own due diligence and risk assessment before executing any trades.

Bearish drop?EUR/JPY is rising towards the pivot and could drop to the 1st support which acts as a pullback support.
Pivot: 157.09
1st Support: 155.00
1st Resistance: 158.35
Risk Warning:
Trading Forex and CFDs carries a high level of risk to your capital and you should only trade with money you can afford to lose. Trading Forex and CFDs may not be suitable for all investors, so please ensure that you fully understand the risks involved and seek independent advice if necessary.
Disclaimer:
The above opinions given constitute general market commentary, and do not constitute the opinion or advice of IC Markets or any form of personal or investment advice.
Any opinions, news, research, analyses, prices, other information, or links to third-party sites contained on this website are provided on an "as-is" basis, are intended only to be informative, is not an advice nor a recommendation, nor research, or a record of our trading prices, or an offer of, or solicitation for a transaction in any financial instrument and thus should not be treated as such. The information provided does not involve any specific investment objectives, financial situation and needs of any specific person who may receive it. Please be aware, that past performance is not a reliable indicator of future performance and/or results. Past Performance or Forward-looking scenarios based upon the reasonable beliefs of the third-party provider are not a guarantee of future performance. Actual results may differ materially from those anticipated in forward-looking or past performance statements. IC Markets makes no representation or warranty and assumes no liability as to the accuracy or completeness of the information provided, nor any loss arising from any investment based on a recommendation, forecast or any information supplied by any third-party.

EURJPY- Buy IdeaEURJPY bounced back after breaking above a strong accumulation. Look to buy on re-test of resistance turned support zone. Manage your risk reward accordingly. Seasonals also suggest an uptrend from the start of March.
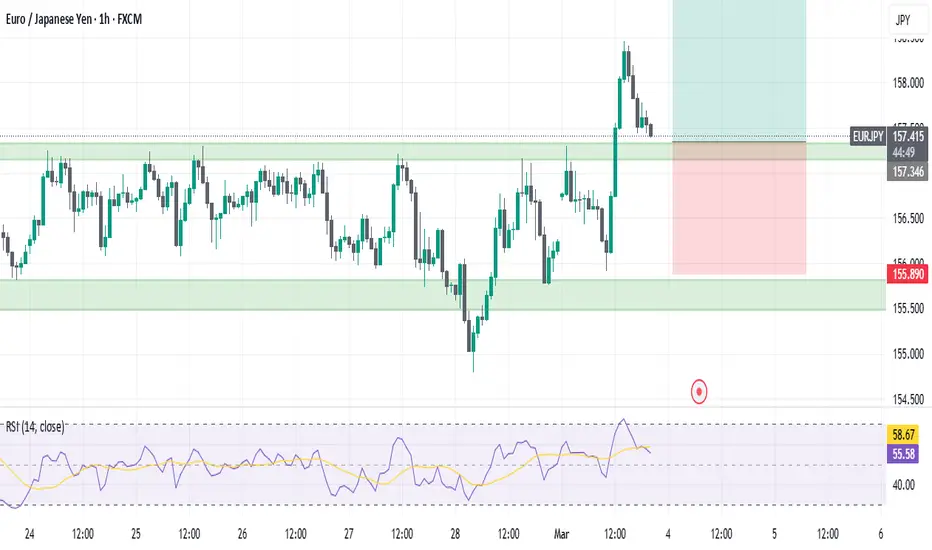
EURJPY Long1)Trend defined. 4h uptrend after a false breakout on a major support level.
2)Contradictory limit order entry. At the upper extreme of the 4h range.
3)Default loss. Below the consolidation zone.
4)Target not set. Multiple targets.
5)Risk <= 3%.
6)Singular trade.
7)Trades placed today <= 5.

Possible CHOCH - Sell to Buy / EURJPYCurrently EUR/JPY has managed to pushed itself all the way back into last week Medium Risk Zone (ORANGE) . Personally I believe that the zone from last week won't be as strong as it used to be so there are also possibilities where EUR/JPY will use the zones from last week and bounce off. This means that there is a chance that EUR/JPY will touch Medium Risk Zone (ORANGE) retrace for a little bit into the High Risk Zone (ORANGE) and from then on bounce off to its respective structure. <--- Scenario 1
If EUR/JPY does not follow the first idea then I would prepare myself to buy at a more lower price which is in our Medium risk Zone (WHITE) & Low Risk zone (WHITE). I will only BUY if there are signs of reversals or at least a CHOCH in the smaller timeframe within these areas of interest.

EURJPY BUY PROJECTION EURJPY as we can see has made an extreme buy , so I expect price to come back to the breaker block And go long

EURJPY Bullish Breakout: Targeting 300 Pips Toward 161.500EURJPY is currently trading at 157.500, having completed a falling wedge breakout and now holding above a key support level. The falling wedge is a strong bullish reversal pattern, indicating that after a period of consolidation, buyers are stepping in to drive the price higher. If this support holds, EURJPY could gain further momentum, targeting the 161.500 level for a potential 300-pip move.
From a technical perspective, the breakout has already been confirmed, and price action suggests that bulls are in control. A strong hold above support, along with increased buying pressure, could push EURJPY toward its next resistance zone near 161.500. Traders should watch for bullish candlestick formations and volume confirmation to strengthen the breakout scenario.
On the fundamental side, the euro’s strength against the yen is largely driven by monetary policy divergence between the European Central Bank (ECB) and the Bank of Japan (BoJ). The ECB remains relatively hawkish, while the BoJ continues its ultra-loose monetary policy, keeping the yen weak. Additionally, risk-on sentiment in global markets tends to favor EURJPY upside.
In summary, EURJPY has broken out of a falling wedge and is holding above a critical support level, with bullish momentum building. If this level remains intact, the pair could see a 300-pip rally toward 161.500. Traders should monitor price action, volume, and any shifts in ECB or BoJ policy for further confirmation of the bullish trend.

EURJPY Range Setup – Could We See a 100–200 Pip Push?We’ve had two successful calls on EURJPY recently—each netting around 100 pips—and that’s not even counting our private setups.
Price is currently trading inside a familiar range, hovering around the triple-bottom area (bottoms 1, 2, and 3). I’m looking for a bounce toward 158.03 if buyers hold this zone.
🔍 Why I’m Watching This Trade:
✅ Range-Bound Action: Price has been revisiting the same support levels, suggesting a possible rebound.
✅ Triple-Bottom Area: Each time price hit this zone, buyers stepped in, hinting at bullish momentum.
✅ Short-Term Target: If buyers remain strong, I’m aiming for around 100–200 pips, reaching 158.03 or slightly higher.
⚡ Levels to Watch:
Support: ~155.00 (triple-bottom zone)
Resistance: ~158.03
If price can’t stay above the bottom support or breaks decisively below these levels, then sellers may push it further down. However, as long as it holds, I’m expecting a decent run to 158.03. Let’s see how this range plays out! 🚀

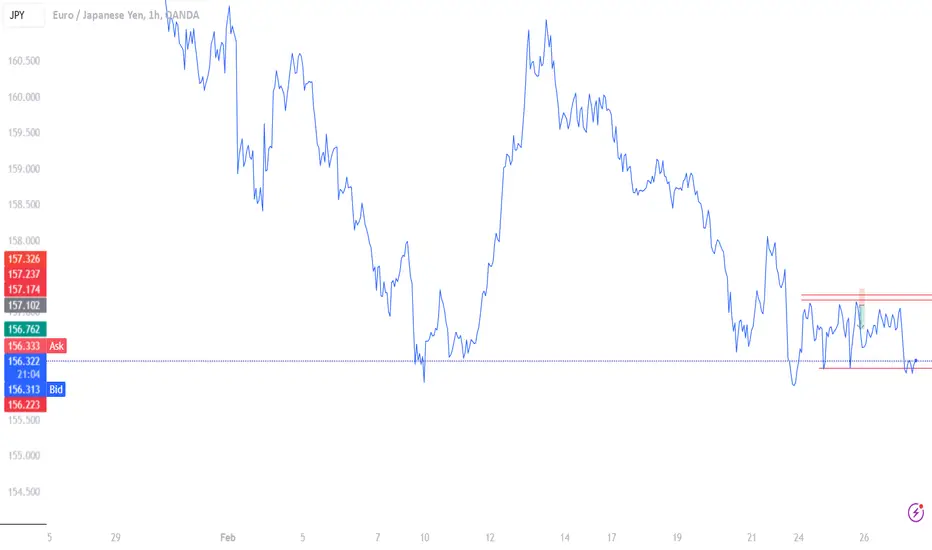
T/R zonesThis is idea based on transient/recurrence zones.
Price will revisit 157.43 zone with high probability
15 min cycle

EURJPY: Gap is Going to Close 🇪🇺🇯🇵
There is a nice gap up opening on EURJPY.
The formation of a bearish engulfing candle
after a test of the underlined resistance indicates
that the gap is going to be filled soon.
Goal - 156.3
❤️Please, support my work with like, thank you!❤️
I am part of Trade Nation's Influencer program and receive a monthly fee for using their TradingView charts in my analysis.

EUR/JPY SHORTI believe EUR/JPY has the potential to go down some more. The reason being so is because of the market structure that was set in the 4 Hours Timeframe and this allows me to pivot my bias into shorting EUR/JPY base on the given risks levels. If the price breaks those levels then I will consider this set up fail but if it doesn't break and actually follows how the analysis is. I would be looking for a long position on the down side


EUR/JPY Bearish Outlook 30-60 daysEUR/JPY 30–60 Day Outlook
Technical Analysis
EUR/JPY has been in a corrective pullback since hitting a multi-year high around ¥164.5 in early January 2025. The pair dropped to a low near ¥154.8 at the end of February  , marking a significant support zone. Support Levels: The mid-150s (around ¥154–¥156) have emerged as key support – this area includes the late-February low (~¥154.8) and the 38.2% Fibonacci retracement of the 2020–2024 rally near ¥152  . A sustained break below ¥154 could open the door to the ¥152 zone or even the psychological ¥150 level if bearish momentum accelerates. Resistance Levels: On the upside, initial resistance lies around ¥159–¥161, which encompasses recent pivot highs  and roughly the 50-day moving average (where the pair’s short-term downtrend line may coincide). Above that, the previous January peak area of ¥164–¥165 is a major resistance; a climb past ¥164.9 would indicate a bullish reversal of the recent downtrend .
Moving Averages & Trend: The recent decline has put EUR/JPY below its 50-day moving average, reflecting a loss of bullish momentum. The 100-day MA is flattening, and the 200-day MA (tracking the longer-term trend) appears to be in the mid-150s, near current prices – a decisive move away from this level could signal the next directional trend. Overall, the medium-term trend has turned sideways-to-bearish after a 5-year rally, with a possible head-and-shoulders topping pattern visible on weekly charts .
RSI and Momentum: The Relative Strength Index recently approached oversold levels during the February sell-off, indicating the pullback was stretched. On the weekly chart, RSI remains below 50 and is trending lower (yet not deeply oversold), confirming bearish momentum without a clear reversal signal yet . In other words, bounces may occur from oversold conditions, but the momentum favors the downside until RSI and price action break their downtrends. Traders will be watching if RSI can climb above the mid-50s (to signal recovering bullish momentum) or if it rolls over near that level, indicating rallies could be sold.
Key Technical Takeaways: EUR/JPY is consolidating above crucial support in the mid-150s. A rebound toward ¥161–¥164 is possible if the support holds (the pair has formed a “sideways pattern” off the ¥154 floor, with scope for an upleg toward ¥164 if ¥161.1 is breached ). However, failure to sustain gains and a break under ¥154 would confirm a downtrend continuation, potentially targeting the next Fibonacci level (~¥152) or lower  . Traders should monitor these support/resistance levels and momentum cues for short-term direction.
COT Positioning Trends
The latest Commitments of Traders (COT) data reveals a notable shift in market positioning that favors the Japanese yen. Speculators (non-commercial traders) have aggressively built long positions in JPY futures, reflecting a bullish stance on the yen. In fact, combined long contracts held by large speculators and asset managers surged by about 63,000 in a single week – the fastest pace on record – indicating a strong bet on yen strength . This has pushed large speculators’ net positioning on JPY to net-long for the first time since early 2021  . In contrast, these speculative traders have been turning bearish on the euro: late last year, large specs’ net-short positions in euro futures neared their most bearish level since March 2020 , and a proxy COT index for EUR/JPY shows large speculators are now net short EUR/JPY at their most bearish stance in eight years . Asset managers (typically longer-term institutional players) remain net long euro, but even they have slashed their bullish EUR/JPY exposure by ~65% since the peak in mid-2024 .
On the other side, commercial hedgers (often businesses and financial institutions hedging currency risk) have taken the opposite positions. The COT report indicates that commercial traders’ yen positioning is near an all-time high (i.e. commercials are extremely long JPY relative to shorts) . This could reflect Japanese exporters hedging against a stronger yen or European importers guarding against EUR/JPY downside. Such an extreme in commercial positioning “reflects a potential sentiment change” in the market . Historically, when speculators and hedgers are this polarized, it often signals a turning point or at least a caution for trend followers – either the crowded trade (yen longs in this case) continues to pay off, or a reversal squeezes those positions.
Positioning Implications: The heavy speculative long interest in JPY suggests a market bias toward yen strength (EUR/JPY downside). This aligns with the broader narrative of traders positioning for BOJ tightening and ECB easing (discussed below). However, with so many speculators already on one side of the boat, there’s a risk that if the yen rally loses momentum, a position unwinding could trigger sharp short-term rebounds in EUR/JPY. Still, absent a clear catalyst for euro strength, the COT data tilts the bias toward the yen (EUR/JPY bearish) in the coming weeks. Market sentiment from positioning is therefore a headwind for any sustained EUR/JPY rally, unless fundamentals shift unexpectedly.
Fundamental Factors
Interest Rates & Central Bank Policy: Monetary policy divergence is a central theme for EUR/JPY. The European Central Bank (ECB) is firmly in an easing cycle now, reacting to cooling inflation and slowing growth in the Eurozone. According to Bloomberg surveys, 97.5% of analysts expect the ECB to cut rates by 25 bps at the upcoming March 6, 2025 meeting  – likely bringing the deposit rate down to ~2.75%. This would mark the ECB’s fourth consecutive rate cut (after aggressive hikes in 2022–2023), clearly reducing the euro’s yield advantage. In contrast, the Bank of Japan (BOJ) has begun moving away from its ultra-loose policy stance. The BOJ already ended its negative rate policy in late 2024 and raised its policy rate to +0.25% , and while an imminent hike in March 2025 is viewed as unlikely (market odds of a March BOJ hike are under 2% ), the trajectory is toward gradual normalization. Analysts expect the BOJ could reach a 1.0% policy rate by end-2025  if wage-driven inflation continues to rise. This narrowing interest rate differential – Eurozone rates coming down while Japanese rates inch up – puts structural pressure on EUR/JPY. The euro had benefited from a carry trade appeal when ECB rates were rising and BOJ was at zero; now that carry advantage is eroding. As one analyst noted, these divergent monetary policies (ECB easing vs. BOJ prepping to tighten) “could make things tricky for EUR/JPY bulls in 2025” . In other words, the fundamental rate bias now favors the yen.
Inflation and Monetary Dynamics: Eurozone inflation has been trending lower from its peak, which is why the ECB feels comfortable cutting rates. Euro area price pressures are moderating toward target, and the ECB is even willing to go “below neutral” on rates to support growth . Meanwhile in Japan, inflation – while lower than Europe’s – has surprised to the upside. Japan’s core CPI has persistently exceeded the BOJ’s 2% target in recent months, and there is “growing evidence that Japan’s economy is running hotter than expected,” as seen in upside surprises in inflation data . This has markets questioning if they are underpricing the risk of a BOJ hike in the near future . In short, inflation trends support a stronger yen: falling EU inflation = dovish ECB, rising Japan inflation (with wage growth) = hawkish tilt from BOJ.
GDP Growth & Employment: The growth outlook further underscores the policy divergence. The Eurozone economy has hit a soft patch – downside risks are “emerging” and the ECB has shifted its focus to the lack of growth . High interest rates in 2023 cooled Europe’s economy, and now growth is sluggish enough that unemployment may tick up and the ECB is prioritizing stimulating the economy. Japan’s economy, on the other hand, has shown resilience. Japan’s Q4 GDP beat expectations and overall economic data have outperformed other regions (Japan’s economic surprise index is above its peers) . Stronger growth and extremely low unemployment in Japan (around 2.5% jobless rate) are boosting wage pressures – a positive sign domestically, and one that reinforces BOJ’s case for normalizing policy . By contrast, Eurozone growth is close to stall speed, and unemployment, while relatively low, could rise if the slowdown continues (some Eurozone economies are flirting with recession). Bottom line: a robust Japan vs. a slowing Europe tends to favor the yen over the euro. Capital flows could increasingly favor Japanese assets if growth/inflation prospects there improve, whereas expectations of ECB easing make euro assets slightly less attractive in comparison.
Risk Sentiment & Geopolitics: EUR/JPY is also sensitive to global risk sentiment. The Japanese yen is a classic safe-haven currency – it strengthens when investors seek safety (e.g. during equity market sell-offs or geopolitical tensions). In the next 1–2 months, a few factors could stir risk sentiment: for example, the uncertainty surrounding the new U.S. administration’s policies (2025 has brought a change in the White House, and talk of renewed trade tensions or geopolitical shifts under President Trump’s second term could unsettle markets). Analysts note that turbulence from a Trump presidency could increase demand for the yen as a safe haven . Additionally, any escalation in geopolitical hotspots or surprises (such as energy prices affecting Europe disproportionately) would likely see the yen outperform. On the flip side, if global markets stay optimistic (risk-on), the yen might soften as investors deploy capital into higher-yielding or riskier assets (which could help EUR/JPY stabilize). However, given the backdrop – central banks easing in the West, potential trade policy noise, and still-elevated uncertainty – the current market sentiment leans cautious, which tends to benefit JPY.
In summary, fundamental drivers favor the yen in the coming weeks. Falling euro area interest rates versus a BOJ slowly stepping toward tightening reduce EUR/JPY’s appeal. Europe’s slower growth and easing inflation vs. Japan’s improving outlook and rising inflation further support this bias. Barring a sharp shift to risk-on sentiment, these fundamental factors should keep downward pressure on EUR/JPY.
Seasonality
Seasonal patterns in FX can sometimes influence price action, although they are not guarantees. For EUR/JPY (and yen crosses in general), the late first quarter and early second quarter have some noteworthy tendencies:
• Fiscal Year-End Yen Strength: Japan’s fiscal year ends on March 31, and traditionally there have been repatriation flows as Japanese firms and investors bring money home. This can lead to yen buying in March, exerting downward pressure on EUR/JPY. Historical records from the Fed note that expectations of Japanese repatriation ahead of March 31 often lead to yen purchases across the board . We could see a similar effect this year, with yen demand picking up in mid-to-late March, which would cap EUR/JPY rallies or even push the pair lower. However, it’s worth noting that this “March yen strength” effect has become less consistent over time (as more corporate hedging smooths out flows). In fact, over the last decade, JPY rose against USD in March only 30% of the time  – meaning in 70% of those years, the yen actually weakened in March. So while repatriation flows are a factor, they don’t guarantee a stronger yen every year. Traders should be aware of the potential for end-of-Q1 volatility but not rely solely on it.
• April and Q2 Patterns: Moving into April, some historical data suggest the yen can remain firm. One analysis found USD/JPY tends to decline in April on average , implying yen strength in the early part of Q2. This could be related to Japanese investors being cautious at the start of the new fiscal year or global money continuing to favor safety in spring. For EUR/JPY, if April follows that pattern, we might see the pair testing lower levels (yen stronger) during the month. However, once again seasonals can flip – there have been years where new fiscal-year investment outflows from Japan (e.g. insurance/pension funds buying foreign assets in April) have actually weakened the yen.
• Historical Price Tendencies: Looking at multi-year averages, EUR/JPY has not shown a dramatic consistent seasonal bias in March-April. It often depends on the broader macro context of that year. One source notes that April has historically been a strong month for yen (weak USD/JPY), whereas March’s reputation for yen strength is mixed . Also, volatility around the end of Q1 can spike due to fiscal year-end book closing. This year, given the fundamental backdrop (discussed above), seasonality may align with fundamentals – meaning yen strength into late March. But by late April, if repatriation subsides and global markets stabilize, EUR/JPY could find a base.
In summary, seasonal factors slightly favor the yen in the March-April period, especially around late March. Traders should watch for possible yen-buying flows as the fiscal year closes. Nonetheless, the seasonal effect is not overwhelming – recent decades show March can just as often buck the old pattern . Therefore, while seasonality adds another piece to the puzzle (tilting bias to a softer EUR/JPY in late Q1), it should be weighed alongside technical and fundamental signals.
Expected Trading Range (30–60 Days)
Given the current volatility and historical ranges, we anticipate EUR/JPY will trade roughly between ¥154 and ¥162 in the next 1–2 months, absent any major shocks. This projected range is derived from both recent price swings and quantitative volatility measures:
• Volatility & ATR: EUR/JPY has seen elevated volatility recently – for example, it moved nearly 10 yen (about 6%) from early January’s high to late February’s low. On a day-to-day basis, the pair typically moves about 90–100 pips per day on average  (roughly ¥0.95). With volatility currently a bit higher than average, daily ranges of 100–150 pips are not uncommon. Over a 30-day period, this daily volatility can compound to multi-yen moves. Average True Range (ATR) readings (14-day) are likely around 1.2–1.5 yen right now, given the recent large candles. This suggests that within any given week, swings of 2–3 yen can occur. Incorporating this into a 4–8 week outlook, a 7–8 yen total range (~4–5% of current price) is a reasonable expectation.
• Support/Resistance Boundaries: Our range bottom of ¥154 is near the aforementioned key support (mid-150s). It assumes that the recent low (¥154.8) or the Fibonacci support (~¥152) will hold even in a downside scenario. If the market breaks significantly below ¥154 and sustains there, it would likely indicate a more bearish development than currently expected (and could then target ¥150 or below). On the upside, ¥162 corresponds to the lower end of the strong resistance zone (upper-150s to mid-160s). The pair spent much of January and early February oscillating in the 158–162 area before the deeper drop, so any rebounds may stall out in that region. A move above ¥162–¥164 would require a fundamental catalyst (or a squeeze of yen longs) and is outside our base-case range – though not impossible, it’s just not the anticipated norm.
• Historical Precedent: The average trading range for EUR/JPY in a given month is often a few yen from low to high. With 2025’s early months already producing about a 10-yen swing high-to-low, we expect the next two months to be somewhat more contained as the market digests information. An estimated range of roughly 500 to 800 pips (5–8 yen) captures most potential fluctuations if conditions remain similar. This would put approximate bounds at mid-150s on the low end and low-160s on the high end. Indeed, many analysts forecast only modest net moves for EUR/JPY in the near term – for example, one source projects the pair around ¥158 by end of March , implying it stays in this general vicinity.
Of course, volatility could expand the range if unexpected events occur. A surprise hawkish move by the BOJ or a sharp risk-off episode might challenge the ¥152 and even ¥150 support. Conversely, an abrupt shift to risk-on (or a less-dovish ECB stance) could see ¥164 re-tested. But considering current ATR-based volatility and chart boundaries, ¥154–¥162 is our expected trading range for the next 30–60 days. This suggests traders can plan for multi-week consolidation within that band, punctuated by short-term swings, rather than a runaway trend.
30–60 Day Forecast
Directional Bias: We maintain a cautious bearish bias for EUR/JPY over the next 1–2 months. This view emerges from the confluence of technical, fundamental, and positioning factors discussed above. In summary, the path of least resistance appears to be mildly to the downside, although a large, one-way drop may be tempered by periodic rebounds. Here’s the synthesis:
• Technicals – The recent downtrend off January’s highs is intact, with lower highs on the daily chart and momentum still weak. Key support has held so far (~¥154–¥155), so we may see some near-term range trading or a bounce. However, unless EUR/JPY can break above ¥161–¥162 convincingly, the technical structure favors sellers on rallies. Indicators like weekly RSI and the potential head-and-shoulders top suggest the rally of the past years is topping out . Thus, any bounce could be an opportunity for the bears to reassert control. A neutral/upside surprise would be if the euro can rally above ¥164 – that would force a re-evaluation – but that scenario seems unlikely given current headwinds.
• Fundamentals – The macro backdrop clearly leans in favor of a stronger yen vs a weaker euro in the coming weeks. An ECB rate cut in March (almost fully expected ) could put downward pressure on EUR/JPY, as lower euro rates reduce carry trades. Meanwhile, even without an imminent BOJ hike, the tone from Tokyo is shifting less dovish, and Japanese data strength (inflation, GDP) is keeping yen bulls confident. Moreover, global growth concerns and any safe-haven flows tend to benefit JPY. As one analysis put it, the euro’s resilience could be “stripped” by a more dovish ECB, with scope for EUR/JPY to drop toward 150 over time in a bearish scenario . While 150 may be beyond our 60-day horizon unless there’s a shock, it underscores the fundamentally-driven downside risk. We expect Eurozone-U.S. rate differentials (Fed also cutting slowly) to maybe limit USD/JPY downside, but for EUR/JPY, the Eurozone-Japan differential is the key – and that is unequivocally narrowing in yen’s favor. Overall, fundamentals point to EUR/JPY grinding lower or at best struggling to rise.
• Positioning/Sentiment – With speculators already heavily short EUR/JPY (long JPY) , one might worry about a contrarian rally. However, this positioning is actually part of why we think any EUR/JPY upticks will likely be limited: the market has anticipated yen-positive news, and so far those bets have been right (given EUR/JPY’s decline from the highs). Unless there’s a clear reason for these speculators to abandon their yen longs, they will likely continue to sell into EUR/JPY strength. In addition, the fact that commercial hedgers are so long yen  suggests real-money interests are protecting against further EUR/JPY downside (for example, European corporates hedging euro exposure, or Japanese firms hedging foreign earnings). That can act as an overhead weight on the pair. Market sentiment, as seen in COT and broader narratives, is tilted bearish on EUR/JPY – which aligns with our bias. As one strategist quipped, “EUR/JPY bulls have seen the best part of the move… the greater rewards could await bears” in 2025  . Over the next 30–60 days, we expect that theme to play out moderately, absent a significant shift in sentiment.
Taking all these points together, our forecast is for EUR/JPY to trade with a downward bias, likely oscillating within the mid-150s to lower-160s range, but with an inclination to test the lower end of that range. We wouldn’t be surprised to see the pair drift into the low-150s if euro weakness or yen strength accelerates (for instance, a move toward ¥152). Conversely, strong resistance in the low-160s should contain any counter-trend rallies. In practical terms, this means strategies like selling on strength (shorting near resistance) could outperform buying dips, given the current backdrop.
However, caution is warranted: event risks like an unexpected change in ECB tone (less dovish than expected) or a sudden improvement in risk appetite could spur a sharper euro rebound versus yen. Also, if the pair approaches the big ¥150 level, one might see profit-taking by yen longs or even concerns of BOJ intervention in FX (historically Japan has intervened to weaken yen when it gets too strong, though ¥150 against the euro is not as prominent a trigger as levels against USD). These factors could limit extreme moves.
Bottom Line: We expect EUR/JPY to be somewhat heavy in the next 30–60 days, with an estimated trading range of roughly ¥154–¥162. The directional bias is mildly bearish, skewing toward yen strength (lower EUR/JPY), driven by supportive technical signals, a yen-friendly fundamental environment (narrowing rate gap, solid Japanese data, etc.), and positioning that reflects and reinforces this bias. Traders should keep an eye on the upcoming central bank meetings (ECB in early March, BOJ in late March) and economic data, as these will be the catalysts that either reinforce the current trajectory or, if they surprise, challenge it. For now, current sentiment and evidence suggest rallies will likely be sold and EUR/JPY could gravitate lower into spring, barring a major shift in the narrative.
Sources:
• ActionForex – EUR/JPY Technical Outlook   (support/resistance and technical pattern insights)
• MarketPulse/CityIndex – Analyst Commentary on ECB & BOJ Policies   (policy divergence and safe-haven yen demand)
• FastBull/ECB Survey – Rate Cut Expectations ; BOJ hike odds  (interest rate outlook for ECB and BOJ)
• ING Think – Central Banks 2025 Outlook   (ECB prioritizing growth, BOJ normalization path)
• CityIndex COT Report – Yen Positioning   (speculators net-long yen at record pace)
• Forex.com/CityIndex – EUR/JPY COT Proxy  (extreme bearish positioning on EUR/JPY by large speculators)
• Reuters/NY Fed – Yen Repatriation Seasonality  (March flows effect)
• IG.com – Seasonality Caution  (historical frequency of yen moves in March)
• QuantifiedStrategies – EUR/JPY Volatility (ATR)  (average daily range ~95 pips)
• CityIndex/Forex.com – Market Sentiment Quotes   (strategist view that EUR/JPY bullish run may be over, favoring bears).
Here’s how I interpret the Wyckoff structure on this chart:
Wyckoff Distribution Phase Breakdown
1. Preliminary Supply (PSY) – This likely occurred around late November to early December, when buying pressure started to slow down and volume increased on peaks, signaling that larger players were distributing positions.
2. Buying Climax (BC) – The highest peak near 162-164 appears to be the Buying Climax, where large amounts of supply entered the market. This was followed by a sharp reaction downward.
3. Automatic Reaction (AR) – The first drop to the 156-158 zone following the BC confirmed the trading range.
4. Secondary Test (ST) – The price retested resistance levels but failed to break significantly higher, forming a lower high.
5. Upthrust (UT) and Upthrust After Distribution (UTAD) – Price attempted a push above 161-162, but these were rejected, confirming supply dominance.
6. Sign of Weakness (SOW) – The recent drop back below 156 shows a clear breakdown below previous supports, confirming bearish control.
7. Last Point of Supply (LPSY) – The last bounce near 158 failed to reclaim prior highs, suggesting that supply is still outweighing demand.
8. Breakdown / Markdown Phase – If price breaks below 154, it could enter a markdown phase, potentially testing the 150 level or lower.

EUR/JPY Weekly Forecast – Liquidity Grab Before Bullish Move 🔍 Market Overview:
EUR/JPY is currently approaching a key weekly sell-side liquidity zone. We anticipate that institutions will sweep this liquidity before driving price higher for a long-term bullish trend.
🎯 Trade Plan:
✅ Wait for Liquidity Grab: Look for price to take out the weekly sell-side liquidity (SSL) before considering long positions.
✅ Confirmation Zone: Watch for a strong reversal signal near demand zones after the liquidity sweep.
✅ Bullish Targets:
Target 1: First supply zone after BOS (Break of Structure).
Target 2: Higher timeframe order block for extended bullish move.
📊 Key Market Confluences:
🔹 Liquidity Sweep: Institutions may clear weak buy-side traders before reversing.
🔹 Smart Money Concept (SMC): We need a clear Change of Character (ChoCH) for bullish confirmation.
🔹 Institutional Order Flow: Watch for high-volume rejections & price absorption signs.
🚀 Best Trading Sessions to Monitor:
📌 London & New York Overlap – High volatility expected for entry confirmation.
⚠️ Risk Management:
Patience is key! Wait for the liquidity grab and a strong bullish reaction before entering long positions. No FOMO!
💬 Do you see EUR/JPY flipping bullish after liquidity sweep? Comment below! 👇🔥

EUR/JPY Breakout Alert – Bullish Reversal in Progress!Analysis & Description:
This chart of EUR/JPY (JPY timeframe) shows a downtrend channel breakout that could signal a bullish reversal.
Key Observations:
✅ Descending Channel Break: The price has been trending inside a bearish descending channel and is now attempting to break out.
✅ Accumulation Zone: A range-bound consolidation occurred before the breakout attempt, indicating possible smart money accumulation.
✅ Key Resistance Levels:
156.545 (Breakout confirmation level)
158.100 (Next resistance)
159.100 & 160.453 (Potential upside targets)
✅ Bullish Breakout Structure: The price is forming higher highs and higher lows, confirming early bullish momentum.
Trading Plan:
📈 Bullish Bias:
A successful breakout above 156.545 with retest confirmation could provide a buy opportunity targeting 158.100 → 159.100 → 160.453.
⚠️ Bearish Invalidations:
If price fails to hold above 156.545, a rejection may lead to a pullback before the next bullish move.
Final Thought:
EUR/JPY is showing early signs of trend reversal. A strong breakout above 156.545 could trigger a bullish rally toward 160+ levels in the coming sessions. 🚀

EUR\JPY | Bullish trend but the price depends on the opening📉 EURJPY Price Forecast – Bullish Breakout Setup! 📈
EURJPY recently touched the 154.300 retest level and rebounded strongly, signaling a potential breakout from the downside channel. With momentum shifting bullish, this setup offers a low-risk, high-reward entry opportunity!
🔥 Entry Price: 156.200
🎯 Target Points:
✅ 1st TP: 161.00
✅ 2nd TP: 163.00
✅ 3rd TP: 165.00
🛑 Stop Loss: Adjust based on risk tolerance
📊 Strategy: Follow EMA 50 for trend confirmation
🔹 Risk Management: Secure profits and minimize losses with proper position sizing
🚀 No Risk, Easy Entry – Let’s Ride the Momentum!
📌 Follow my rules & stay ahead of the market!
💬 Like Comment & Follow for real-time market insights, expert trade setups, and profitable strategies!

#036 Trust The Process EURJPY 0936SGT 27022025Buying.
Price at major support area, so, buy, right?
0927SGT 27022025
I have some ideas privated because i reached the daily limit for posting ideas.
I will repost them later. Now I feel giddy and trapped plus im so tired and malnourished.
Too bad. the effects of childhood trauma has caught up.
0938SGT 27022025
EUR/JPY Key Supply Zone Holding – Bearish Rejection in PlayChart Analysis & Trade Setup:
The EUR/JPY 45-minute chart highlights a strong supply zone near 157.50 - 157.60, where price has repeatedly rejected, leading to multiple sell-offs. This zone remains a critical resistance area for further downside movement.
Technical Breakdown:
📌 Key Supply Zone (157.50 - 157.60): Price has attempted to break above but faced strong rejection, confirming sellers' dominance.
📉 Bearish Price Action: Each rejection from the supply zone has resulted in a decline towards key support levels.
🔄 Liquidity Grab & Drop: A fake-out above 157.50 led to a sharp reversal, suggesting a distribution phase.
Trade Plan:
✅ Entry: Consider a short position on a retest of 156.50 - 157.00, if price fails to reclaim higher levels.
🎯 Target 1: 156.00 (Recent support level).
🎯 Target 2: 155.70 - 155.50 (Stronger demand zone).
🛑 Stop Loss: Above 157.65, as a breakout above this level would invalidate the bearish setup.

