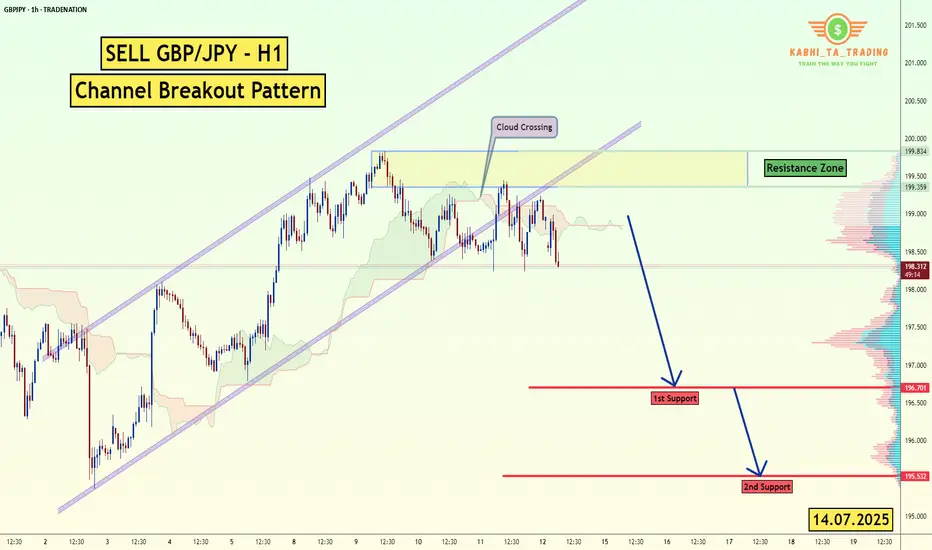
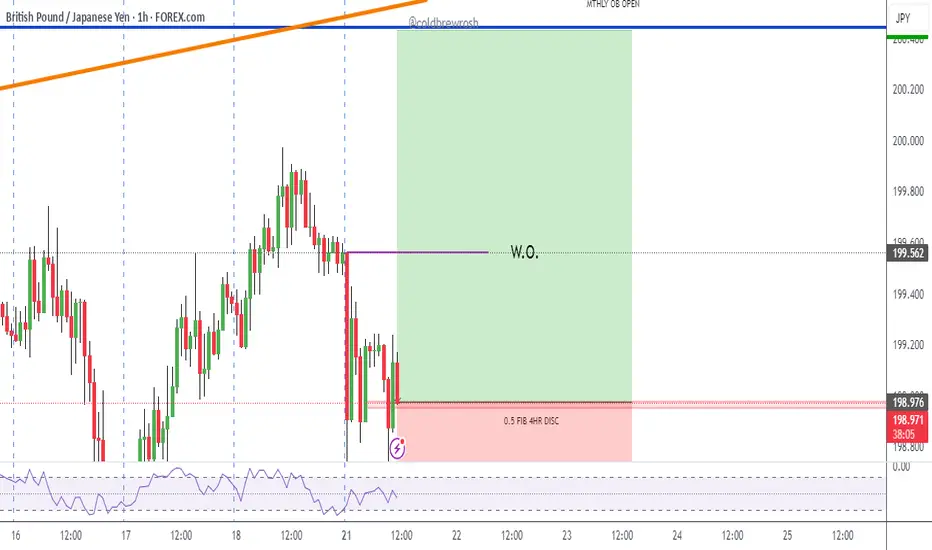
GBP/JPY -H1- Channel Breakout (14.07.2025)The GBP/JPY Pair on the H1 timeframe presents a Potential Selling Opportunity due to a recent Formation of a Channel Breakout Pattern. This suggests a shift in momentum towards the downside in the coming hours.
Possible Short Trade:
Entry: Consider Entering A Short Position around Trendline Of The Pattern.
Target Levels:
1st Support – 196.70
2nd Support – 195.53
🎁 Please hit the like button and
🎁 Leave a comment to support for My Post !
Your likes and comments are incredibly motivating and will encourage me to share more analysis with you.
Best Regards, KABHI_TA_TRADING
Thank you.
Disclosure: I am part of Trade Nation's Influencer program and receive a monthly fee for using their TradingView charts in my analysis.
JPYGBP trade ideas
GBPJPYGBP/JPY is undergoing a trend reversal.
What matters is that, based on price action and fractal concepts, the bullish trend has ended.
Practice proper risk management and protect your profits.
GBPJPY: Get Ready to Buy 🇬🇧🇯🇵
GBPJPY is consolidating within a narrow horizontal range
on a daily time frame.
I am waiting for its bullish breakout and a daily candle close above
199.85 to confirm the next bullish wave.
A rise will be expected to 201 level then.
❤️Please, support my work with like, thank you!❤️
I am part of Trade Nation's Influencer program and receive a monthly fee for using their TradingView charts in my analysis.

Waiting for the bigger move with GBPJPYHi Traders!
Right now, GJ is failing to swing higher at a major resistance at 199.200. Looking at the 4HR, yesterday July 16th, price wicked down to 198.000 retesting a previous 4HR CHOCH, then pulling back up to continue consolidation in between 198.000 and 199.200. However, on the 4HR price didn't close below 198.000 with continuation, which would make me believe that if the new 4HR CHOCH is valid, eventually price will break through 199.200. This will require patience if I want a bigger move. A more conservative approach to this trade, for me, would be entering on the break with a retest/bounces off 199.200.
SL below a new HL, TP1: 201.000, Overall TP: 202.000.
In addition, the only way I would sell is if price broke down past 198.500/198.200, and kept rejecting. Then, I could see a downside. But, imo price action just it's giving that confirmation right now.
*DISCLAIMER: I am not a financial advisor. The ideas and trades I take on my page are for educational and entertainment purposes only. I'm just showing you guys how I trade. Remember, trading of any kind involves risk. Your investments are solely your responsibility and not mine.*

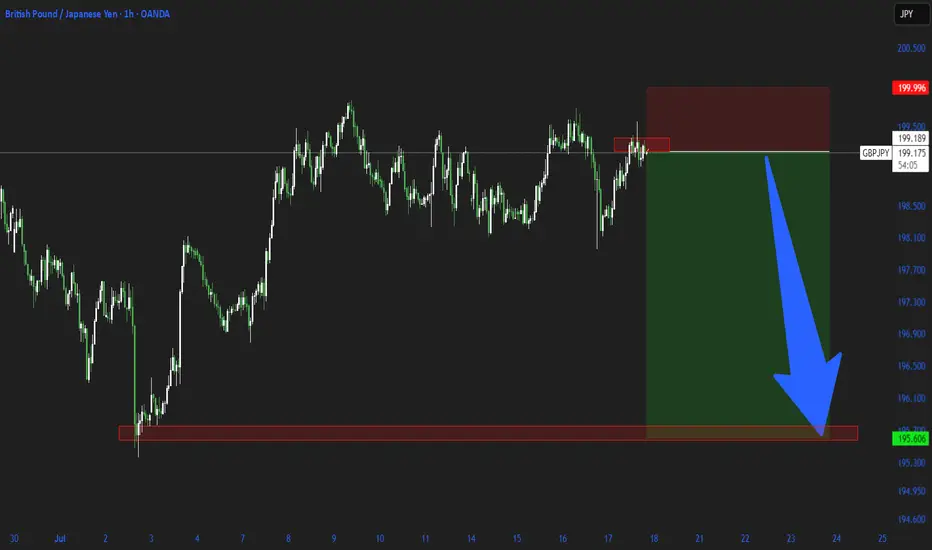
GBPJPY - Trading The Range!Hello TradingView Family / Fellow Traders. This is Richard, also known as theSignalyst.
📈GBPJPY has been hovering within a big range.
This week, GBPJPY is retesting the upper bound of the range and $200 round number.
As long as the resistance holds, we will be looking for shorts on lower timeframes, targeting the lower bound of the range.
📚 Always follow your trading plan regarding entry, risk management, and trade management.
Good luck!
All Strategies Are Good; If Managed Properly!
~Rich
Disclosure: I am part of Trade Nation's Influencer program and receive a monthly fee for using their TradingView charts in my analysis.

GBP/JPY) Bearish Analysis Read The captionSMC trading point update
Technical analysis of GBP/JPY on the 3-hour timeframe, suggesting a potential short-term pullback within a larger ascending channel.
---
Analysis Summary
Pair: GBP/JPY
Timeframe: 3H
Current Price: 198.883
Bias: Bearish move toward channel support
---
Key Technical Insights
1. Ascending Channel Formation:
Price is moving within an upward-sloping channel.
Current structure suggests price is heading toward the lower trendline support.
2. Support Level & Target Zone:
The yellow zone around 196.355 is a major support area and target point, coinciding with both structural support and the bottom of the channel.
3. EMA (200 Close):
Price is still above the 200 EMA (197.067), so overall trend remains bullish — but current move is a correction.
4. RSI (14):
RSI is neutral near 51.14, allowing room for further downward movement before becoming oversold.
---
Target Point
Target: 196.355 (support zone and bottom of channel)
---
Trade Idea
Direction Entry Stop-Loss Target
Sell 198.80–199.00 Above 199.70 196.35
SMC trading point
---
Summary
GBP/JPY is likely to retrace toward support at 196.35 before possibly bouncing within the larger bullish structure. This offers a short-term selling opportunity, with potential buy setups near the lower trendline later.
Please support boost 🚀 this analysis)

GBPJPY Bullish Breakout IncomingAnother bullish breakout on the H4 TF is pending. The trend has been consistently bullish and confirmations of a continuation are clear.
Wait for that breakout of the bullish pattern and ride the trend.

17.07.25 Morning ForecastPairs on Watch -
OANDA:US30USD
CAPITALCOM:DE40
FX:GBPJPY
A short overview of the instruments I am looking at for today, multi-timeframe analysis down to what I will be looking at for an entry. Enjoy!

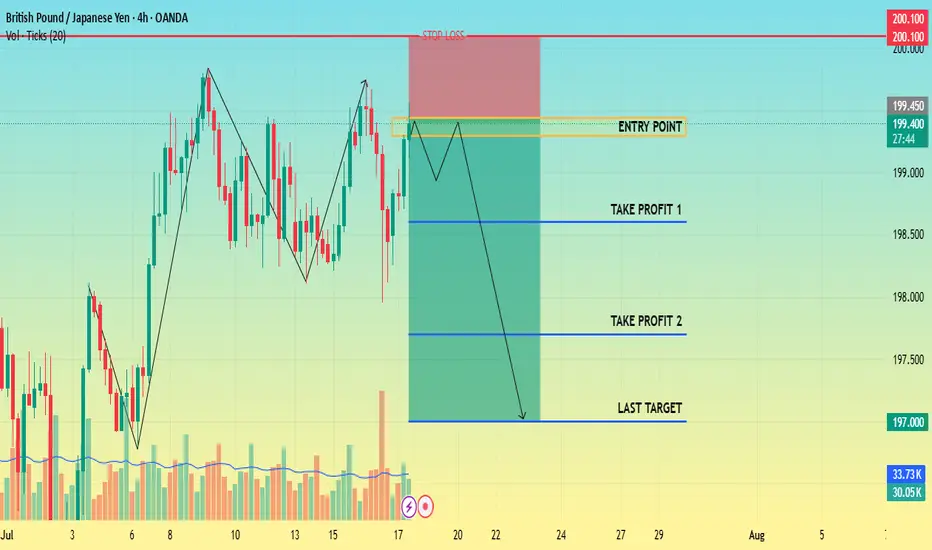
CHECK GBPJPY SIGNAL READ CAPTAIN📍 Trade Setup Overview
Trade Direction: Short (Sell)
Entry Point: Around 199.450
Stop Loss: Around 200.100
🎯 Target Levels
Take Profit 1:
198.500
Take Profit 2:
197.800
Last Target:
197.000
7.14 GBP/JPY 4H LIVE TRADE UPDATENow that the swing low has been tested and broken we should see this market heading higher
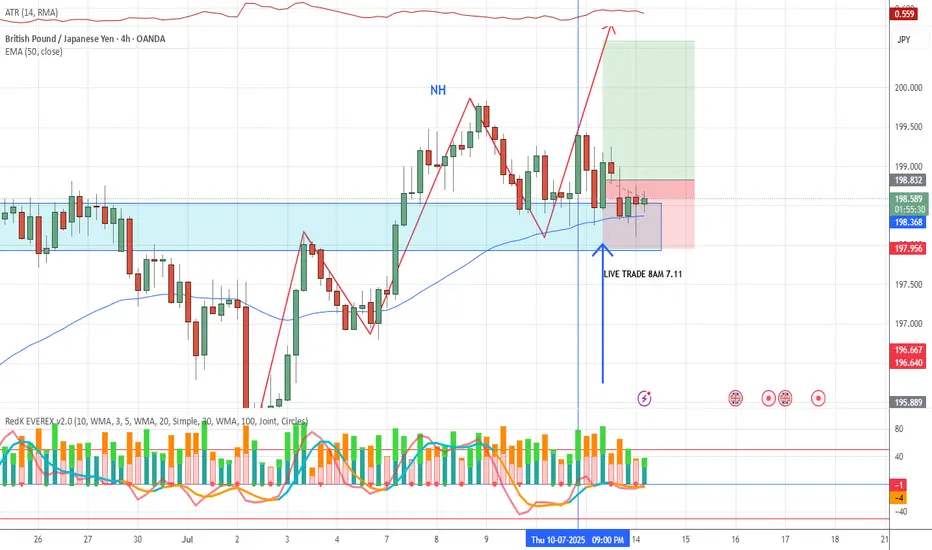
7.16 GBP/JPY LIVE TRADE UPDATE DAY 4We are waiting for a break and close above the previous swing high to confirm the uptrend continuation.

GBP/JPYNear the 200 psychological and very important level for institution TP Level i expect a very deep retracement here


GBPJPY SellThis currency pair is in a clear downtrend. The best idea is to sell at the moment of hitting the downtrend line.

GBPJPY 4H – Demand Zone Rejection | Bullish Continuation🏹 GBPJPY 4H – Demand Zone Rejection | Bullish Continuation
GBPJPY tapped into a key 4H demand zone with a strong rejection wick, respecting both horizontal support and trendline structure. With bullish momentum building, price is likely to push toward the psychological 200.000 level.
✅ Demand zone + trendline confluence
✅ Bullish rejection after liquidity sweep
✅ Clean 1:3+ RRR setup
✅ Clear HTF bullish structure
Strategy: TCB – Trend Phase (Pullback Entry)
Entry Zone: 198.800
Stop Loss: 198.370
Take Profit: 200.000
Checklist Score: ✅ 100% A+ setup
#GBPJPY #ForexSetup #SmartMoney #PriceActionTrading #DemandZone #TrendTrading #ForexAnalysis #TCBStrategy #LiquiditySweep #SwingTrade #JapaneseYen #BullishMomentum #ForexChart #TradingViewIdeas #GBPJPYAnalysis

GBP/JPY Quick trade on the 15 minTrending down into a order block. Medium Risk as HTF are in the middle of the range just above the order block
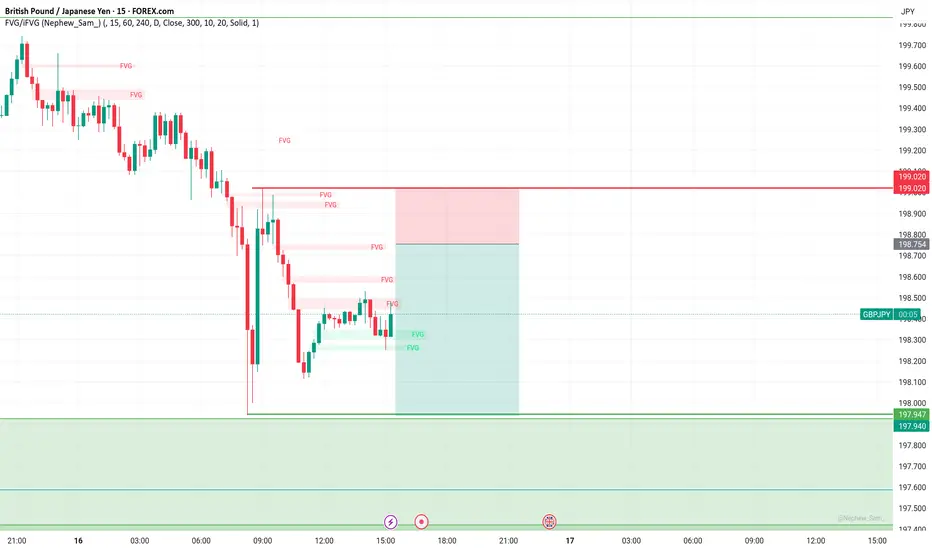
GBPJPY: floating at the top – is a drop being loaded?GBPJPY is hovering around 198.91 after an impressive rally, but now it's trapped between two key zones: 199.85 – a resistance level that keeps rejecting price, and 198.20 – a fragile support below. The price action reveals a tense sideways pattern, like a spring coiling up before release.
What’s concerning is that buyers have attempted to break above the high multiple times and failed – and each failure comes with weaker rebounds. With the Bank of England shifting toward a “pause” stance and the yen gaining mild support from rising risk-off sentiment, the market is starting to lean toward a correction.
If price breaks below 198.20, it could mark the beginning of a deeper slide back toward the lower boundary of the channel. Don’t be fooled by the silence – sometimes, calm is the precursor to a sharp fall.

GDPJPYUsing ICT concepts combined with the BTMM strategy, GBPJPY is currently showing a high-probability bullish signal.
Market Structure: Price has cleared liquidity from recent lows, indicating a potential smart money accumulation phase.
BTMM Timing: The pair is aligning with a Market Maker cycle, showing signs of a Phase 1 accumulation and potential move into Phase 2 (markup).
ICT Confluences:
Liquidity grab beneath the previous session low.
Price has returned to a fair value gap/imbalance zone.
Order block support is holding strongly.
If the bullish momentum sustains, we could see price push towards projected key levels (next liquidity pool above).
However, if price fails to hold this accumulation zone and breaks below the current structural low, we may see a collapse to deeper discount levels as indicated.
Bias: Bullish
Entry Zone: Around the discount order block
Targets: Next liquidity levels above
Invalidation: Break below the recent accumulation low
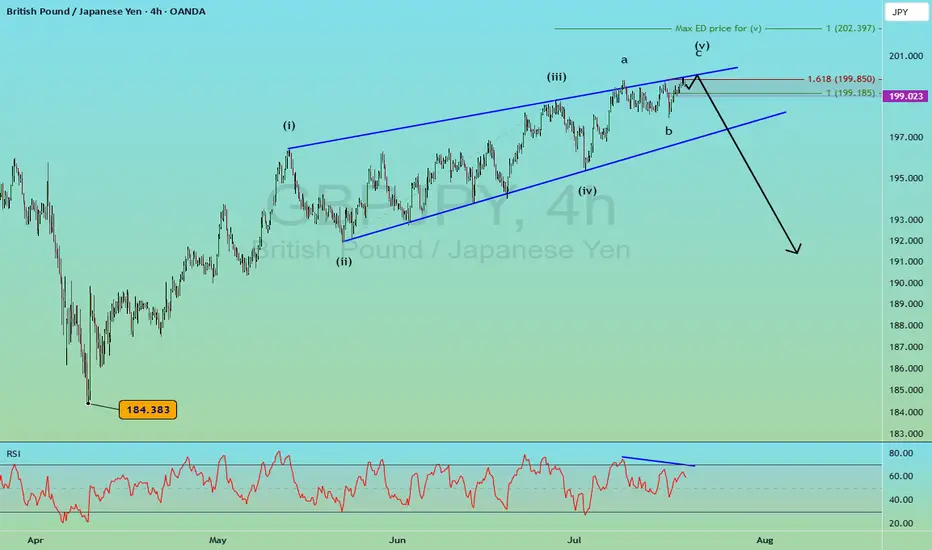
GBPJPY Large Reversal Pattern [Elliott Wave]Executive Summary:
GBPJPY shaping a diagonal pattern.
Large bearish reversal could push down to 184.
Above 202.40 voids the pattern as labeled.
I typically don't conduct Elliott wave analysis on cross pairs simply because they are the children of the two main currencies involved. GBPJPY is the child of GBPUSD and USDJPY.
With that said, I still scroll through charts looking for compelling patterns and GBPJPY caught my attention.
First, it's knocking on the door of 200...a nice round number.
Secondly, the rally from 184 in April to now appears to be a very mature Elliott wave ending diagonal pattern .
Diagonals shape in 5 waves. Remember, wave 3 cannot be the shortest of waves 1,3,5. Since wave 3 is shorter than wave 1, that means wave 5 cannot be longer than wave 3.
So we simply measure out wave 3 and apply it to the end of wave 4, and, voila, we have a maximum target for wave 5 at 202.40 .
That maximum target doesn't mean GBPJPY has to go that high, but this market is ripe for a large bearish turn. If GBPJPY does push above 202.40, then my wave labeling is incorrect.
Ending diagonals tend to be fully retraced which implies a decline back to 184 ... 1500 pips from today's price.
GBJPY may dance around in the 199 handle for a day or two.
A break below 199 could be an early warning signal of the bearish reversal. A break below the blue support trend line helps confirm the pattern.
If this bearish reversal takes hold, then GBPUSD or USDJPY likely experiences a large decline too.
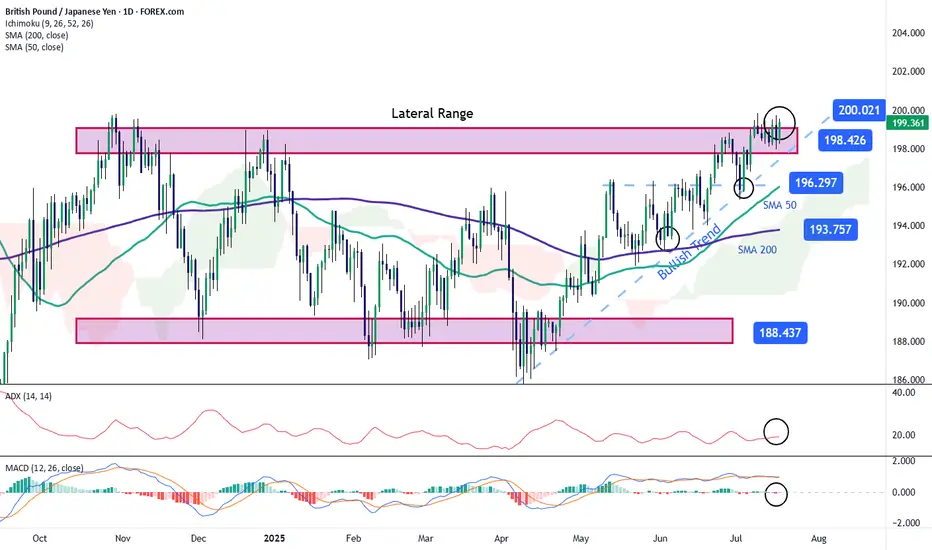
GBP/JPY: Pound Attempts to Break Out of a Broad Sideways RangeThe GBP/JPY pair has gained over 0.5% today in favor of the British pound, as the Japanese yen continues to weaken steadily. The recent escalation in the trade war, where potential 25% tariffs may begin to affect Japan in the short term, has contributed to the yen’s steady decline. For now, this remains one of the main catalysts behind the price movement, which is trending lower in the near term. As uncertainty surrounding the yen persists, buying pressure on GBP/JPY could become more significant.
Broad Sideways Range at Risk
Recent short-term bullish movements are beginning to test the upper boundary at 198.42, a key level within the broad sideways range that has dominated the chart in recent months. For now, the price could face a period of persistent neutrality as it tries to push through this upper barrier, which remains the most relevant resistance zone. If buying pressure holds steady over the coming sessions, the range could come under threat, potentially giving way to a more dominant and consistent bullish trend in the short term.
ADX
The ADX line is currently oscillating close to the 20 level, which typically indicates low average volatility over the past 14 sessions. This could be signaling a period of price consolidation, especially as the pair approaches current resistance zones.
MACD
The MACD histogram remains close to the zero line, suggesting a lack of clear direction in the short-term momentum of the moving averages. As long as this persists, it will likely reinforce the current neutral sentiment around resistance levels.
Key Levels:
200.00 – Tentative resistance zone, corresponding to the next psychological level to watch in the short term. Sustained price action above this level could confirm a breakout of the broad channel, paving the way for a dominant bullish trend.
198.42 – Nearby barrier, marking the upper boundary of the broad range. Sustained moves above this level could further reinforce the prevailing bullish bias.
196.297 – Key support level, marking the recent low. If selling pressure brings the price back to this area, the market could resume the broad sideways range seen in previous sessions.
Written by Julian Pineda, CFA – Market Analyst
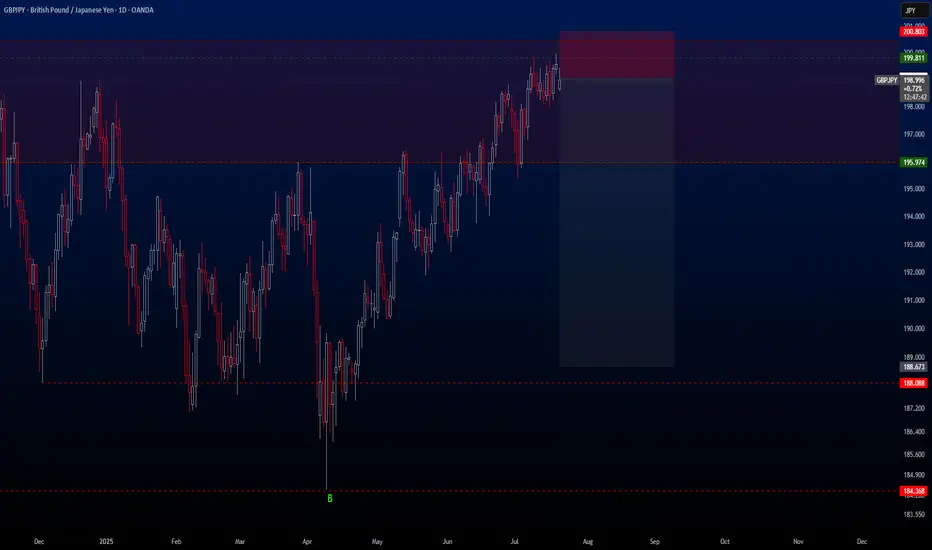
GBPJPYHello traders,
The holidays are over and we’re back to trading again! 🙂
Our first trade is on the **GBPJPY** pair. This setup is quite ideal for those thinking long-term. I’ve already activated this trade on my side.
🔍 **Trade Details**
✔️ **Timeframe**: D/W
✔️ **Risk-to-Reward Ratio**: 1:6
✔️ **Trade Direction**: Sell
✔️ **Entry Price**: 199.073
✔️ **Take Profit**: 188.673
✔️ **Stop Loss**: 200.803
🔔 **Disclaimer**: This is not financial advice. I’m simply sharing a trade I’ve taken based on my personal trading system, strictly for educational and illustrative purposes.
📌 Interested in a systematic, data-driven trading approach?
💡 Follow the page and turn on notifications to stay updated on future trade setups and advanced market insights.
GBPJPY - 1D SetupThe Japanese yen may get stronger for a while due to the weakening of the British Economy, which may lead to a pullback of the GBPJPY currency, and this seems to be a good trading opportunity in sells with a strict stop-loss. OANDA:GBPJPY
Note- This is my own view and not a financial advice as trading comes with high risk.
