GBPJPY SHORTGJ has been pushing up for a bit of time now on the higher TF and now the sellers are in a bit of control after the BOS on h4 TF, price is currently gaining momentum towards the supply area and i believe the sellers will take advantage and push the price further down. I personally will be looking to sell GJ from my AOI and see how it goes...
JPYGBP trade ideas
GBP/JPY Retests Supply Zone as Yen StrengthensGBP/JPY bounced from 195.3 and is testing resistance at 197.0, where a bearish fair value gap is located.
Stochastic shows rising momentum at 28.0, but institutional data favors the Yen, with increasing long contracts.
If 197.0 holds, the pair may retest 195.3, the previous day's low. The bearish outlook remains valid below the 197.8 resistance.

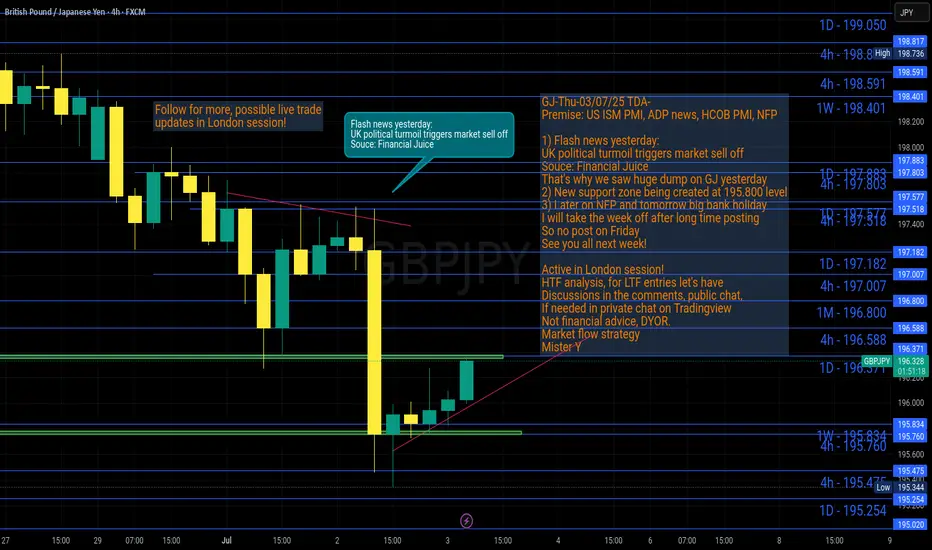
GJ-Thu-03/07/25 TDA-UK political turmoil triggers market selloffAnalysis done directly on the chart
Follow for more, possible live trades update!
I often share my live trades in Tradingview public chat in London session, stay tuned!
I don't give signals blindly, people should learn
and understand the skill.
Following blindly signals you won't know how to
manage the trade, lot size and replicate the move
over time.
That's why you need active real time discussions.
Trading is not get rich quick scheme!
Active in London session!
Not financial advice, DYOR.
Market Flow Strategy
Mister Y
GBPJPY H4 I Bearish Reversal Based on the H4 chart, the price is approaching our sell entry level at 196.93, a pullback resistance that aligns with the 50% Fib retracement.
Our take profit is set at 195.01, a pullback support.
The stop loss is set at 198.82, a swing high resistance.
High Risk Investment Warning
Trading Forex/CFDs on margin carries a high level of risk and may not be suitable for all investors. Leverage can work against you.
Stratos Markets Limited (tradu.com ):
CFDs are complex instruments and come with a high risk of losing money rapidly due to leverage. 63% of retail investor accounts lose money when trading CFDs with this provider. You should consider whether you understand how CFDs work and whether you can afford to take the high risk of losing your money.
Stratos Europe Ltd (tradu.com ):
CFDs are complex instruments and come with a high risk of losing money rapidly due to leverage. 63% of retail investor accounts lose money when trading CFDs with this provider. You should consider whether you understand how CFDs work and whether you can afford to take the high risk of losing your money.
Stratos Global LLC (tradu.com ):
Losses can exceed deposits.
Please be advised that the information presented on TradingView is provided to Tradu (‘Company’, ‘we’) by a third-party provider (‘TFA Global Pte Ltd’). Please be reminded that you are solely responsible for the trading decisions on your account. There is a very high degree of risk involved in trading. Any information and/or content is intended entirely for research, educational and informational purposes only and does not constitute investment or consultation advice or investment strategy. The information is not tailored to the investment needs of any specific person and therefore does not involve a consideration of any of the investment objectives, financial situation or needs of any viewer that may receive it. Kindly also note that past performance is not a reliable indicator of future results. Actual results may differ materially from those anticipated in forward-looking or past performance statements. We assume no liability as to the accuracy or completeness of any of the information and/or content provided herein and the Company cannot be held responsible for any omission, mistake nor for any loss or damage including without limitation to any loss of profit which may arise from reliance on any information supplied by TFA Global Pte Ltd.
The speaker(s) is neither an employee, agent nor representative of Tradu and is therefore acting independently. The opinions given are their own, constitute general market commentary, and do not constitute the opinion or advice of Tradu or any form of personal or investment advice. Tradu neither endorses nor guarantees offerings of third-party speakers, nor is Tradu responsible for the content, veracity or opinions of third-party speakers, presenters or participants.

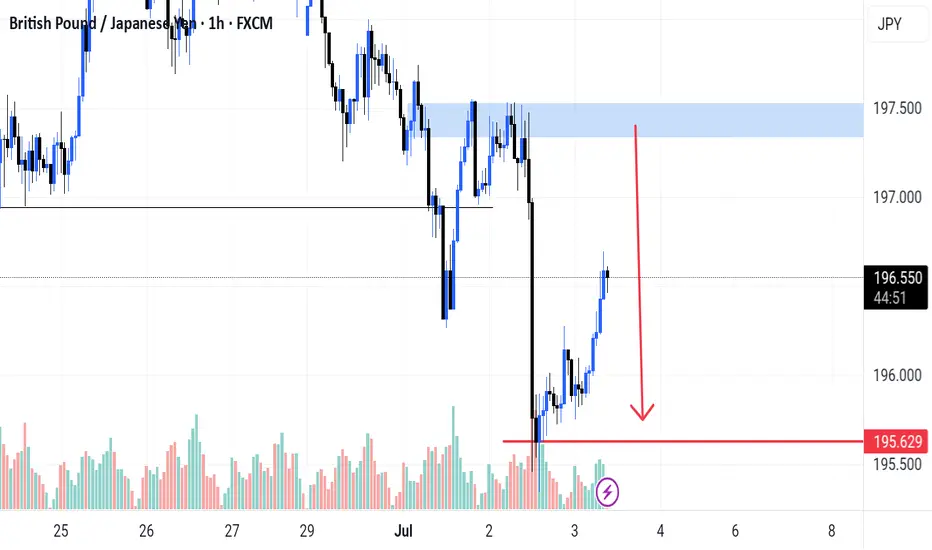
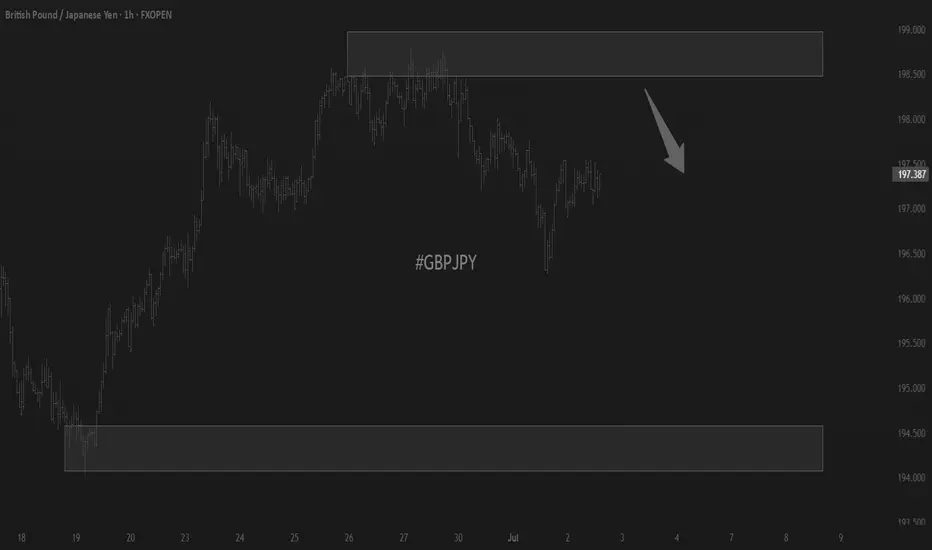
GBPJPY – Bearish Setup Within Uptrend ChannelGBPJPY is moving inside a larger uptrend channel on the 1-hour chart.
Price had been consolidating in a clear trade zone near the recent highs.
That trade zone support has now broken with strong bearish momentum.
This breakdown signals a potential short-term structure shift.
Sellers are stepping in below the trade zone, rejecting further upside.
Bias turns bearish while price stays under this broken level.
We’re now looking for continuation lower within the channel.
Key downside target identified at 194.00, near channel support.
This aligns with previous reaction levels and demand zones.
Plan:
1.Watch for retests of the broken zone for short opportunities.
2.Manage entries and risk carefully inside the channel.
3.Expect downside flow toward 194.00 if momentum holds.
4.Price action confirms break of support, favoring a move lower.
L ike, comment, share, and follow for more trading ideas.

Bullish countre pullbackI am expecting price to pullback deeper into the bearish range but when that is happening I need to see any violation of structure or institution sell pressure. Entry has already formed during the Asia session so for the new bullish counter pullback I need to find a fresh demand zone.

GBP/JPY Bears Eye Drop to 195GBP/JPY closed lower for a third day on Wednesday, with bearish momentum increasing thanks to political tensions in the UK and dovish comments from BOE voting members.
While the daily RSI (2) is oversold, there could still be room for a move to 195 over the near term. Its less than a day’s trading range away using recent volatility levels, and it also sits near the bullish trendline from the May low.
The 1-hour chart shows prices are drifting higher in an apparent corrective fashion, yet prices remain in the lower third of Wednesday’s range. I suspect bears will seek to fade into any pops higher in anticipation of another drop towards 195, near the daily S1 pivot, weekly S and rising trendline.
Should GBP/JPY drop to the lower target area, how prices react could provide clues over its potential to use the level as a springboard or break lower from that pivotal zone.
Market Analyst at City Index and Forex.com

Gbpjpy Short setupPrice has made it to the downside, so we expect a lower high print before the next sell

GBPJPY - BUYUS ADP Numbers came in worse than expected means economy contraction the real numbers look like they are flowing through now they can only fudge the numbers for so long
My opinion Trump has told them make sure the numbers look good
Revisions on Job openings have all been revised down over the last 4 months they lie through their teeth until the facts are so obvious even they have to give in with the lies.
Anyway all currencies reacted of course
GBP quite strongly across the board
GBP has been very strong
Trend is up long term
Classic Return to Previous Level if u ask me
Lets see

GBP/JPY Under Pressure After Failing to Test December HighGBP/JPY carves a series of lower highs and lows after failing to test the December high (198.96), and a close below the 195.70 (61.8% Fibonacci extension) to 196.60 (23.6% Fibonacci extension) region may push GBP/JPY back towards the June low (192.73).
Failure to defend the 192.40 (50% Fibonacci extension) to 193.50 (38.2% Fibonacci extension) zone may lead to a test of the May low (190.33), but the recent selloff in GBP/JPY may turn out to be temporary should it snap the bearish price series carried over from last week.
A breach above the December high (198.96) may lead to a test of the November high (199.56), with the next area of interest coming in around the October high (199.81).
--- Written by David Song, Senior Strategist at FOREX.com

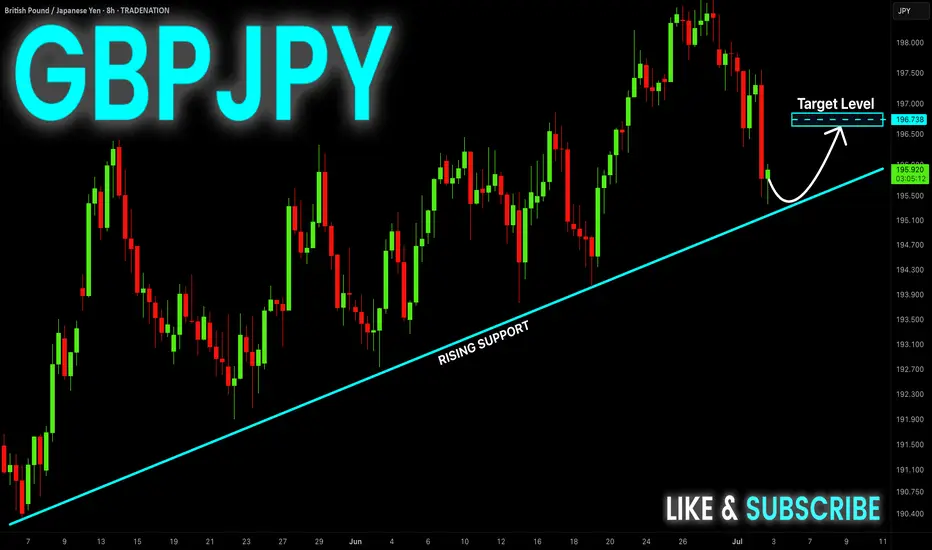
GBP-JPY Correction Ahead! Buy!
Hello,Traders!
GBP-JPY will soon make
A retest of the rising support
Line and as we are bullish
Biased we will be expecting
A local bullish correction
Buy!
Comment and subscribe to help us grow!
Check out other forecasts below too!
Disclosure: I am part of Trade Nation's Influencer program and receive a monthly fee for using their TradingView charts in my analysis.
skraaaaaa!check my previous post and you will see the before of this trade and a comprehensive explanation of my bias and analysis knowledge truly is power want learn SMC concept reach out to me and get a comprehensive understanding today

GBPJPY BUY SetupI'm expecting a reversal to the up side when price gets to my POI. Make sure to make your own research and apply a proper risk management

GBPJPY SHORT DAILY FORECAST Q3 D2 W27 Y25GBPJPY SHORT DAILY FORECAST Q3 D2 W27 Y25
Professional Risk Managers👋
Welcome back to another FRGNT chart update📈
Diving into some Forex setups using predominantly higher time frame order blocks alongside confirmation breaks of structure.
Let’s see what price action is telling us today! 👀
💡Here are some trade confluences📝
✅Daily Order block identified
✅4H Order Block identified
✅1H Order Block identified
🔑 Remember, to participate in trading comes always with a degree of risk, therefore as professional risk managers it remains vital that we stick to our risk management plan as well as our trading strategies.
📈The rest, we leave to the balance of probabilities.
💡Fail to plan. Plan to fail.
🏆It has always been that simple.
❤️Good luck with your trading journey, I shall see you at the very top.
🎯Trade consistent, FRGNT X

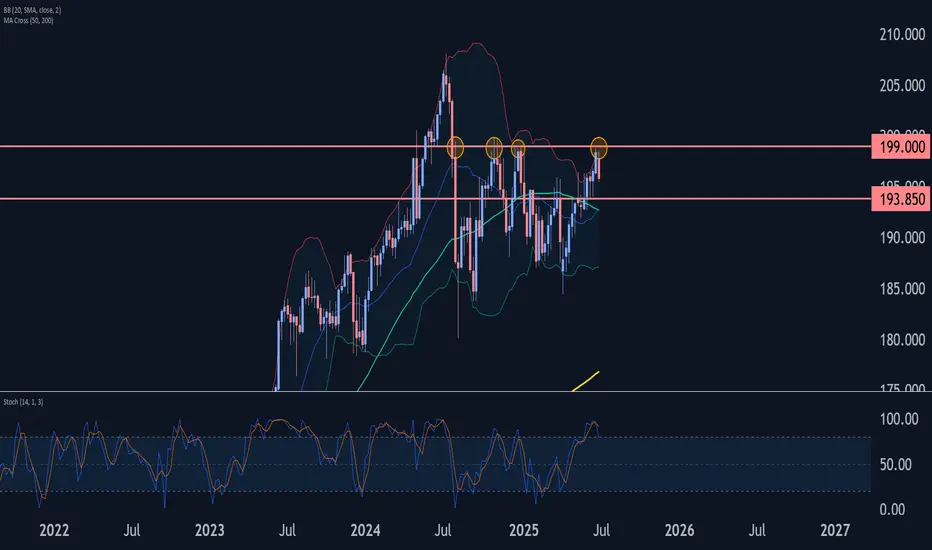
GBPJPY Wave Analysis – 2 July 2025- GBPJPY reversed from resistance zone
- Likely to fall to support level 193.85
GBPJPY currency pair recently reversed down from the resistance zone between the strong resistance level 199.000 (which has been reversing the price from last October) and the upper weekly Bollinger Band.
The downward reversal from this resistance zone stopped the C-wave of the previous ABC correction (2) from April.
Given the strength of the resistance level 199.000 and the overbought weekly Stochastic GBPJPY currency pair can be expected to fall to the next support level 193.85.
GJ idea - could all YEN pairs head down?We're looking at GJ apart of me is wanting to execute but then the A+ TRADER wants me to wait for a proper break to the downside. We see price down trending, creating LL's & LH's, now we just wait for price to break our CTL. We also see multiple bearish engulfings. Feeling good about this let's scale in lightly.

GBPJPY Short – Extended M Completion & Structural Break
Price formed an extended M pattern in premium territory, sweeping buyside liquidity at 197.473. A clean structural break followed the second peak, confirming bearish intent and shifting narrative downward. Entry was taken post-break, with a protective alert set at 197.613 to manage invalidation risk. Targeting 196.744—the upper third of the discount zone—this trade capitalizes on liquidity engineering, structure alignment, and session timing for a high-probability move toward sellside draw.
Trading balanceTrading balance The price of the asset has rebounded from the balance zone. With the prospect of growth into the resistance zone.
Potential buys on GBPJPYWaiting for price to retrace at the recent low, confirmation wicks and momentum to enter the market. Or break the recent high.

Correction It is expected that after some fluctuation and correction within the identified resistance and support areas, the correction trend will end and we will witness the beginning of an upward trend. A break of the support area will cause a continuation of the downward trend.

GBP/JPY) back bullish trend analysis Read The captionSMC trading point update
Technical analysis of GBP/JPY on the 2-hour timeframe, signaling a potential rally from a key support area. Here’s a breakdown of this analysis:
---
Technical Breakdown
1. Key Support Zone (Yellow Box):
Price has pulled back to a strong support level around 196.50–197.00.
This level previously acted as resistance and now flipped to support (classic support-resistance flip), marked by the green arrow.
2. EMA 200 as Dynamic Support:
The 200 EMA (~196.567) is just below the support zone, reinforcing the likelihood of a bullish bounce from this area.
3. Bullish Price Projection:
The chart suggests a bounce off this support zone with a projected move toward the target point at 200.132, indicating a +1.71% upside.
4. RSI Indicator (14):
RSI is at 43.47, approaching the oversold region but curving upward — supporting a potential reversal to the upside.
---
Forecasted Move
Expected Move: Bullish reversal from support, targeting 200.132.
The chart outlines a potential entry at current levels, with a bounce confirmed by price respecting the yellow support zone.
Mr SMC Trading point
---
Trading Idea Summary
Bias: Bullish
Entry Zone: Around 196.50–197.00
Stop-Loss: Below support zone (~196.00 or lower)
Take-Profit: 200.132
Confirmation: Bullish candlestick pattern or RSI crossover
plesse support boost 🚀 this analysis

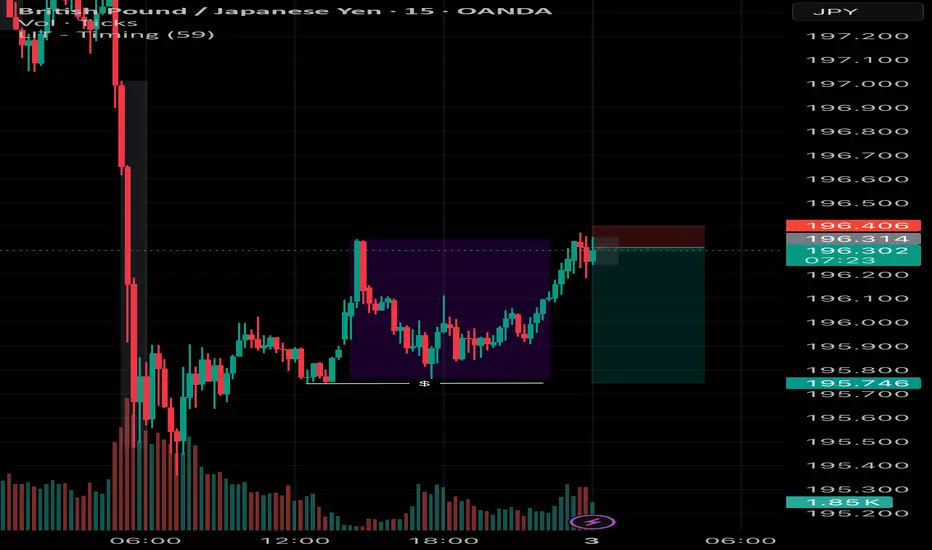
GBPJPY Long – Deep Sweep Reversal from 196.786 Sellside Liquidit
Price swept major sellside liquidity at 196.786, forming the deepest leg of a broader structural draw during London session. Entry followed a clean W pattern formation and bullish reaction from deep discount territory. This setup aligned with structure, liquidity engineering, and session timing. Trade captured a reversal opportunity with price lifting from the sweep zone and targeting EQ/premium within the intraday box.