GBP/JPY Consolidates After Pushing Above May HighGBP/JPY consolidates after pushing above the May high (196.41) earlier this week, but the pullback in the exchange rate may turn out to be temporary as it holds above the monthly low (192.73).
In turn, a move/close above the 195.70 (61.8% Fibonacci extension) to 196.60 (23.6% Fibonacci extension) region may lead to a test of the January high (198.26), with the next area of interest coming in around the December high (198.96).
However, lack of momentum to push/close the 195.70 (61.8% Fibonacci extension) to 196.60 (23.6% Fibonacci extension) region may push GBP/JPY back towards the monthly low (192.73), with a break/close below the 192.40 (50% Fibonacci extension) to 193.50 (38.2% Fibonacci extension) zone bringing the May low (190.33) on the radar.
--- Written by David Song, Senior Strategist at FOREX.com
JPYGBP trade ideas

GBP_JPY LOCAL SHORT|
✅GBP_JPY has been growing recently
And the pair seems locally overbought
So as the pair is approaching a horizontal resistance of 196.400
Price decline is to be expected
SHORT🔥
✅Like and subscribe to never miss a new idea!✅
Disclosure: I am part of Trade Nation's Influencer program and receive a monthly fee for using their TradingView charts in my analysis.

GBPJPY Strong rebound. Buy opportunity.The GBPJPY pair has been trading within an Ascending Triangle pattern. Today's geopolitics made the price form its latest Higher Low at the bottom of the pattern, which also coincided with a 4H MA200 (orange trend-line) test, and rebounded.
That was a clear buy signal on the 4H RSI Support that signaled the last three bottom buys. Our Target is the top of the pattern at 196.300.
-------------------------------------------------------------------------------
** Please LIKE 👍, FOLLOW ✅, SHARE 🙌 and COMMENT ✍ if you enjoy this idea! Also share your ideas and charts in the comments section below! This is best way to keep it relevant, support us, keep the content here free and allow the idea to reach as many people as possible. **
-------------------------------------------------------------------------------
Disclosure: I am part of Trade Nation's Influencer program and receive a monthly fee for using their TradingView charts in my analysis.
💸💸💸💸💸💸
👇 👇 👇 👇 👇 👇

possibility of correctionIt is expected that a trend change will take place in the current resistance range and we will witness the beginning of a downward trend. If the price consolidates above the resistance range, the continuation of the upward trend is likely.

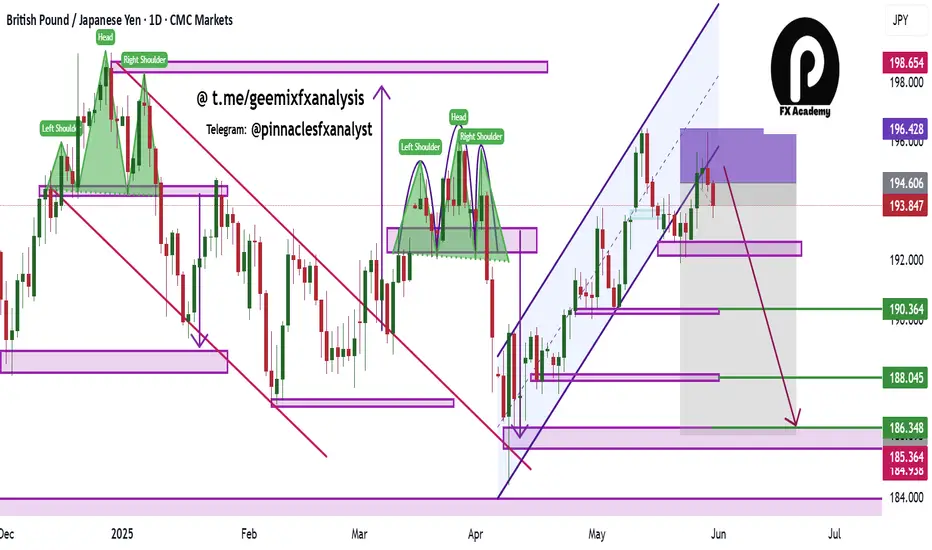
GBPJPY at a Turning Point: Triple Top Signals Potential DeclineGBPJPY at a Turning Point: Triple Top Signals Potential Decline
Fundamental Analysis:
GBP is showing signs of weakness against the Japanese Yen following the latest UK employment data. The UK unemployment rate rose to 4.6% for the three months ending in April, while the Claimant Count Change increased by 33.1K in May.
Meanwhile, hawkish expectations for the Bank of Japan (BoJ) continue to strengthen the Japanese Yen.
Technical Analysis:
GBPJPY has encountered strong resistance near the recent highs for the third time, increasing the likelihood of a decline, as seen on the chart. The price action suggests the formation of a triple top pattern, which could trigger a deeper drop from this zone.
Targets:
🎯 194.70 🎯 193.60 🎯 192.40
You may find more details in the chart!
Thank you and Good Luck!
❤️PS: Please support with a like or comment if you find this analysis useful for your trading day❤️
Disclosure: I am part of Trade Nation's Influencer program and receive a monthly fee for using their TradingView charts in my analysis.

GBPJPY SHORT FORECAST Q2 W24 D13 Y25GBPJPY SHORT FORECAST Q2 W24 D13 Y25
Professional Risk Managers👋
Welcome back to another FRGNT chart update📈
Diving into some Forex setups using predominantly higher time frame order blocks alongside confirmation breaks of structure.
Let’s see what price action is telling us today!
💡Here are some trade confluences📝
✅Daily order block
✅15' order block
✅Intraday breaks of structure
✅4H 50 EMA rejection
🔑 Remember, to participate in trading comes always with a degree of risk, therefore as professional risk managers it remains vital that we stick to our risk management plan as well as our trading strategies.
📈The rest, we leave to the balance of probabilities.
💡Fail to plan. Plan to fail.
🏆It has always been that simple.
❤️Good luck with your trading journey, I shall see you at the very top.
🎯Trade consistent, FRGNT X

GBPJPYI believe my analysis will help expose how the price moves in the market. It is clear that the price moves forming different patterns giving hints as to what we could expect next.
The price has been moving in an ascending channel, it got broken and retested, I believe the price will eventually fall towards my arrow head.
GBP/JPY trendGBP/JPY is trading within an ascending channel and has recently bounced strongly from the key support area around 193.77. As long as this level holds, the price is expected to push higher toward the resistance at 194.81 and potentially 195.45. A break below 193.77 would invalidate the bullish scenario and could indicate a shift to a more neutral or bearish structure.

GJ-Thu-12/06/25 TDA-GJ breaking 195.000 support levelAnalysis done directly on the chart
Follow for more, possible live trades update!
No strategy has 100% win rate, this is when
risk management comes in handy.
We are humans, we all make humans errors
if you are manual trading and executing the
trades.
Active in London session!
Not financial advice, DYOR.
Market Flow Strategy
Mister Y

GBPJPY follow the ascending channel selling from supply zoneGBPJPY Update – 1H Timeframe
Price is respecting the ascending channel and currently reacting from a key supply zone at 166.100. Sellers are stepping in!
🎯 Technical Targets: 🔻 1st Target: 195.000 – Major Demand Zone
🔻 2nd Target: 193.300 – Bullish Order Block / Demand Zone
Structure still bullish overall, but short-term correction in play.
💡 Smart money eyes the zones — are you ready?
👇 Don’t forget to:
💬 Comment your thoughts
❤️ Like if you caught the move
🔔 Follow for more real-time trade setups & market insights
Trade smart. Stay ahead.
— Livia 💋

GBP/JPY Bearish Pullback to Key Fibonacci LevelsGBP/JPY shows a strong bearish move followed by a consolidation near the 0.236–0.382 Fibonacci retracement zone. I’m monitoring this area closely as price retests the 0.5 (194.648) and 0.618 (194.855) Fibonacci levels — classic zones for bearish continuation setups.
This setup suggests that price may reject the 0.618 zone, especially if volume and candle structure confirm resistance. My trade idea is based on short entries near 0.5–0.618 with a potential continuation toward 193.33 (-0.25) and 192.68 (-0.618 extension).


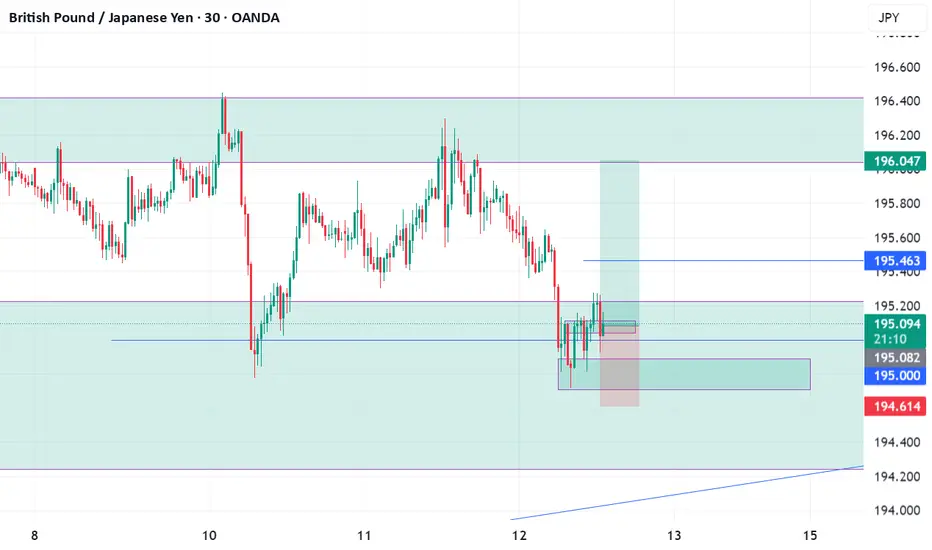
GBP/JPY - Triangle Breakout (12.06.2025)The GBP/JPY Pair on the M30 timeframe presents a Potential Selling Opportunity due to a recent Formation of a Triangle Breakout Pattern. This suggests a shift in momentum towards the downside in the coming hours.
Possible Short Trade:
Entry: Consider Entering A Short Position around Trendline Of The Pattern.
Target Levels:
1st Support – 194.34
2nd Support – 193.76
🎁 Please hit the like button and
🎁 Leave a comment to support for My Post !
Your likes and comments are incredibly motivating and will encourage me to share more analysis with you.
Best Regards, KABHI_TA_TRADING
Thank you.
Disclosure: I am part of Trade Nation's Influencer program and receive a monthly fee for using their TradingView charts in my analysis.

Update GJ June 12No sell confirmation yet. Until then, I'm scalping — 20 to 50 pips a day.
Structurally, a swing higher wouldn’t surprise me, but anything can happen. Keep monitoring the levels.
Notice how price respected the levels I mapped out in advance — these are not random lines.
Stay prepared. Anticipate with patience!
Gbpjpy sellA major downward move is expected from GBP/JPY. If the trendline is broken and the price exits the consolidation zone, it could drop to the 189 area. However, if the price stabilizes above 196.411, this analysis would not be valid.

GBPJPY – Golden Pocket Breakout SetupTimeframe: 1H | 🎯 Bias: Bullish Breakout
GBPJPY is testing a key Fibonacci retracement zone (0.5–0.618) from the recent impulse leg (194.00 → 196.195). This golden pocket sits inside strong demand and could launch the next leg higher.
🔍 Technical Confluence
Fib Support Zone: 195.270–195.447 (0.618–0.5)
Price Action: Consolidating near golden pocket, showing rejection wicks
Structure: Higher highs and higher lows intact
RSI: Resetting around 45–50, leaving room for momentum buildup
Next Resistance: 196.200 (previous high), then 197.300 and 198.500
🧠 Fundamental Confluence
GBP Strength Drivers:
BoE's "hawkish cut" tone — restrictive policy to fight sticky inflation
UK macro improving: upcoming GDP & labor data could surprise to the upside
Market pricing less aggressive easing compared to peers = GBP premium
JPY Weakness Factors:
COT RSI at 100% = overbought positioning
BoJ delays normalization to 2027
Risk-on flows (VIX ~16.7) reducing safe-haven demand
Macro Flows: Bullish NASDAQ + stable oil → support GBPJPY upside
Macro Themes:
Oil & NAS100 bullish = supports GBPJPY upside
Market unwinding defensive positions = bullish for GBPJPY
🛠 Trade Plan
📥 Entry Option 1: Buy on bullish reaction from 195.27–195.45 (Fib golden pocket)
📥 Entry Option 2: Break and close above 196.200 (confirmation entry)
🛑 Stop Loss: Below 195.00 (under Fib + recent structure)
🎯 TP1: 196.80
🎯 TP2: 198.00 (measured move)
📌 “Golden pockets don’t lie when fundamentals align.”

CHECK GBPJPY SIGNAL READ CAPTAINgbpjpy buy now ✅
entry point (195.150) (195.100)
TAKE PROFIT 1: (195.300)
TAKE PROFIT 2: (195.500)
LAST TARGET (195.650)
STOP LOSS (194.900)

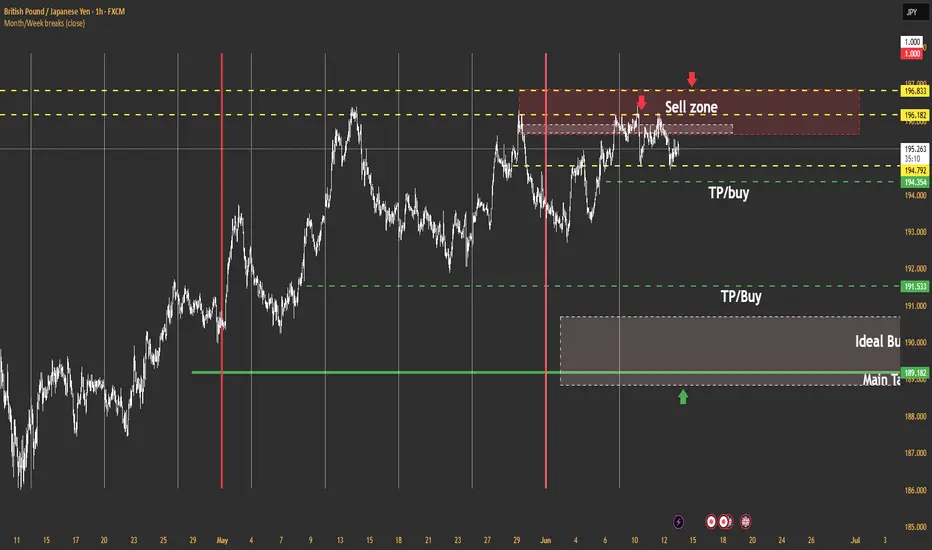
Lingrid | GBPJPY potential Extension after Bullish BreakoutOANDA:GBPJPY is consolidating just above the key support around 195.05 after bouncing from a higher low and failing to hold the recent breakout above PMH. The bullish structure remains intact within the upward channel, but the pair is currently lacking momentum. If price holds above 195.00 and forms a new bullish wave, a push toward 198.00 remains likely.
📈 Key Levels
Buy zone: 194.80–195.20
Buy trigger: bullish confirmation above 195.60
Target: 198.00
Sell trigger: break below 194.80 with strong volume
💡 Risks
Failure to hold 195 could shift structure to neutral
Extended range may lead to choppy conditions
Yen strength could trigger sudden reversals from resistance
Traders, if you liked this idea or if you have your own opinion about it, write in the comments. I will be glad 👩💻


MY PRICE ACTION IDEA 1. 4-Hour Chart:
○ You identify a clear uptrend (making HH and HL).
○ You mark a significant 4-hour Support Level where price has bounced strongly multiple times in the past.
○ Confluence: Strong uptrend + major support. Your bias is to buy.
2. 30-Minute Chart:
○ Price pulls back from a recent high and approaches your identified 4-hour support level.
○ As price touches the 4-hour support, a large Bullish Engulfing Bar forms and closes. The body of this candle completely engulfs the previous bearish candle.
○ Confluence: Price at 4H support + Bullish Engulfing Bar + aligns with 4H uptrend. This is your potential setup.
3. 5-Minute Chart:
○ After the 30-minute Bullish Engulfing Bar closes, you switch to the 5-minute chart.
○ You see that after the engulfing bar, the 5-minute chart has formed a new higher low and then broken above a short-term 5-minute resistance level, with a strong bullish 5-minute candle closing above it.
○ Entry: You enter a long trade immediately after the 5-minute confirmation candle closes.
○ Stop Loss: Place your stop loss just below the low of the 30-minute Bullish Engulfing Bar (or slightly below the 4-hour support).
○ Take Profit: Identify the next major 4-hour resistance level as your target.
○ Confluence: 30M signal confirmed by 5M structure break + tight stop loss placement.
GBPJPY Intraday Bearish sideways consolidationThe GBP/JPY currency pair continues to display a bearish outlook, in line with the prevailing downward trend. Recent price action suggests a corrective pullback, potentially setting up for another move lower if resistance holds.
Key Level: 196.50
This zone, previously a consolidation area, now acts as a significant resistance level.
Bearish Scenario (rejection at 196.50):
A failed test and rejection at 196.50 would likely resume the bearish momentum.
Downside targets include:
194.20 – Initial support
193.00 – Intermediate support
191.90 – Longer-term support level
Bullish Scenario (breakout above 196.50):
A confirmed breakout and daily close above 196.50 would invalidate the bearish setup.
In that case, potential upside resistance levels are:
197.50 – First resistance
198.30 – Further upside target
Conclusion
GBP/JPY remains under bearish pressure, with the 196.50 level acting as a key inflection point. As long as price remains below this level, the bias favors further downside toward the 194.20–191.90 region. However, a sustained break above 196.50 would shift sentiment bullish, targeting 197.50 and beyond. Traders should watch for price confirmation around 196.50 to assess the next move.
This communication is for informational purposes only and should not be viewed as any form of recommendation as to a particular course of action or as investment advice. It is not intended as an offer or solicitation for the purchase or sale of any financial instrument or as an official confirmation of any transaction. Opinions, estimates and assumptions expressed herein are made as of the date of this communication and are subject to change without notice. This communication has been prepared based upon information, including market prices, data and other information, believed to be reliable; however, Trade Nation does not warrant its completeness or accuracy. All market prices and market data contained in or attached to this communication are indicative and subject to change without notice.

GJ 6/10/25 APre-Analysis
1) Session Break (A took out NY)
2) Expecting? (Trend)
3) High Volume located at (End)
4) Leg being traded? (1)
5) Market digestion? (1hr)
6) Edge? (S1) higher TF is (1hr)
7) Edge Specifics? (S1H)
8) Continuation
9) Micro Timeframe (15min)
10) Class (B)

GBPJPY Uptrend and Bullish Continuation Patterns on H4 TFDespite price being in a daily resistance zone, GBPJPY is still showing strong signs of being bullish. I would caution against committing to any short positions - at least on a long term basis.
