GBP/JPY - Breakout Brewing📊 GBP/JPY – Breakout Imminent?
Price is testing key resistance at the top of the range within this ascending channel.
We’re now at a critical decision point:
📈 A clean breakout above this supply zone could send us flying toward the 198.945 target – aligning with the channel top.
📉 A rejection, however, could trigger a drop back into demand at 192.352, offering a solid buy zone for continuation.
🧠 Patience is key here — wait for confirmation. Either way, volatility is expected next. Be ready. 🚨
JPYGBP trade ideas

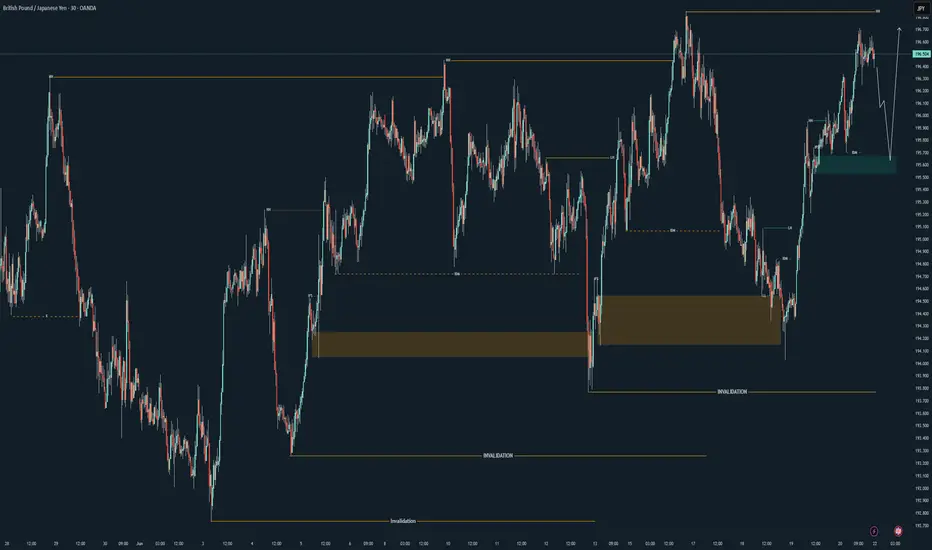
*GBPJPY Weekly Breakdown - Structure + PrecisionThis week, GJ moved exactly how it was supposed to—clean structure, proper mitigation, and follow-through.
Price respected the bullish flow all week, tapping into a refined 30M order block (green zone) before lifting off. That zone did its job—mitigated, held, and set the tone for the next leg up. No need to force anything here—just fundamentals and execution.
We’re still holding higher lows, and unless structure says otherwise, I’m expecting continuation next week with a clean break of those highs.
Simple reads. Clean execution.
This is how we do it. 😉
Bless Trading!
GBPJPY Bullish Move
Monthly Chart
Price respected the Major QP (190.00)
Price also formed a Triple Bottom
The previous monthly candle ended as a bullish engulfing
Short MAs are above Longer MAs and price is above both
Sentiment - Look for buys
Weekly Chart
Price found support at he weekly zone and made a bullish push
Price then sold off (retracement) and respected the 38.2 Fib Level and Minor AQ (192.5) before continuing the bullish trend
The price of the previous candle met resistance at the trend line & sold off but ultimately closed respecting the Minor QP (195.000).
This weeks candle found bullish support and closed bullish engulfing
Sentiment - Look for buys
Daily Chart
Price retraced and found support at the 50.0 Fib Level - confirming bullish trend continuation
Expecting price to continue bullish and test the 0.27 Fib, which also aligns with the Daily Supply Zone & Minor AQ (197.500).
Will look to enter long on lower time frame - 1H/2H
1 Hour Chart
Based on the RSI - a bearish divergence is present signaling some bearish pressure
This algins with the daily TF, as I am looking to enter long after a minor retracement on this timeframe.
Expecting to enter a long position near the 50.0-61.8 Fib area.

GBP-JPY Free Signal! Sell!
Hello,Tra ders!
GBP-JPY is retesting a
Horizontal resistance
Around 196.700 and
We will be expecting a
Bearish pullback so we
Can enter a short trade
With the Take Profit
Of 195.865 and the
Stop Loss of 196.887
Sell!
Comment and subscribe to help us grow!
Check out other forecasts below too!
Disclosure: I am part of Trade Nation's Influencer program and receive a monthly fee for using their TradingView charts in my analysis.

GBPJPY bllishFirst impulse after the correction in wave 2, the first impulse jumps, I expect a pullback to continue the upward trend

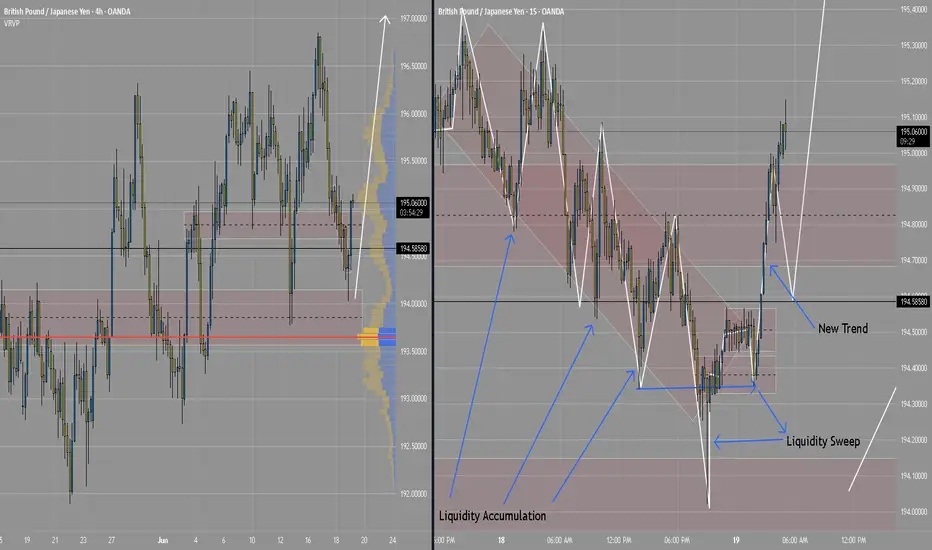
GJ longGJ is heading towards the weak highs but momentum is slowing down.
Therefore I'm expecting to grab some liquidity first before breaking the highs.
After breaking the highs I would expect a deeper mitigation before the continuation towards the newly created higher highs.

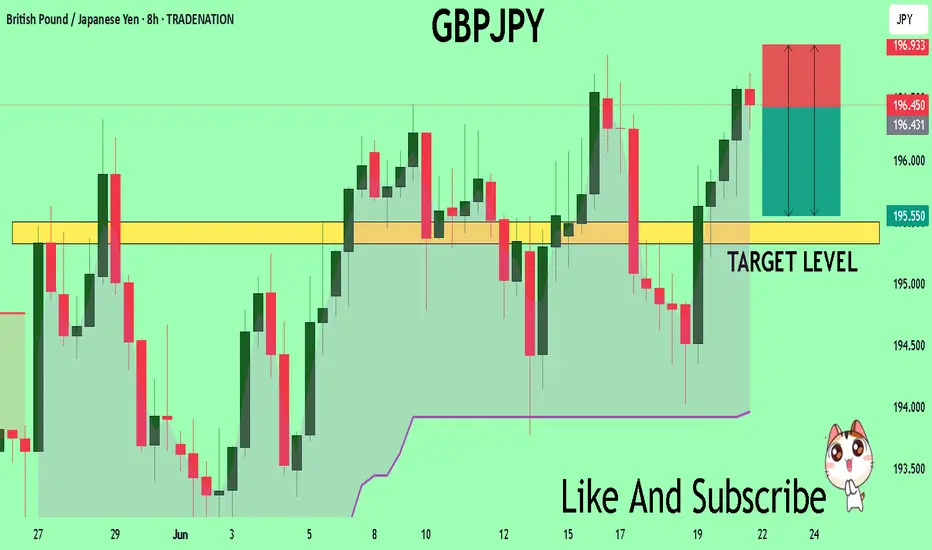
GBPJPY Massive Short! SELL!
My dear subscribers,
This is my opinion on the GBPJPY next move:
The instrument tests an important psychological level 196.43
Bias - Bearish
Technical Indicators: Supper Trend gives a precise Bearish signal, while Pivot Point HL predicts price changes and potential reversals in the market.
Target - 195.50
My Stop Loss - 196.93
About Used Indicators:
On the subsequent day, trading above the pivot point is thought to indicate ongoing bullish sentiment, while trading below the pivot point indicates bearish sentiment.
Disclosure: I am part of Trade Nation's Influencer program and receive a monthly fee for using their TradingView charts in my analysis.
———————————
WISH YOU ALL LUCK
Trading balanceTrading balance The price of the asset has rebounded from the balance zone. With the prospect of growth into the resistance zone.
GBPJPY Hello traders. A new buy opportunity has emerged on the GBPJPY pair. As you may have noticed, the pair has been rallying non-stop for the past few days, and even on the M15 and M30 charts, it hasn’t offered many pullback opportunities for entries. But it seems that opportunity is finally here. I’ve activated the trade and wanted to share it with you as well.
🔍 Trade Details
✔️ Timeframe: 15-Minute
✔️ Risk-to-Reward Ratio: 1:2.78
✔️ Trade Direction: Buy
✔️ Entry Price: 195.732
✔️ Take Profit: 196.145
✔️ Stop Loss: 195.588
🔔 Disclaimer: This is not financial advice. I’m simply sharing a trade I’ve taken based on my personal trading system, strictly for educational and illustrative purposes.
📌 Interested in a systematic, data-driven trading approach?
💡 Follow the page and turn on notifications to stay updated on future trade setups and advanced market insights.

GJ-Fri-20/06/25 TDA-Will weekly candle close above WR 195.834?Analysis done directly on the chart
Follow for more, possible live trades update!
Feedback from you guys:
1) Is daily posting really helpful or better focus on
less posts?
2) Is there any way to improve more the quality
of posts?
Comment down below, really appreciate the responses!
Active in London session!
Not financial advice, DYOR.
Market Flow Strategy
Mister Y

GBPJPY LONG & SHORT FORECAST Q2 W25 D20 Y25GBPJPY LONG & SHORT FORECAST Q2 W25 D20 Y25
Professional Risk Managers👋
Welcome back to another FRGNT chart update📈
Diving into some Forex setups using predominantly higher time frame order blocks alongside confirmation breaks of structure.
Let’s see what price action is telling us today!
💡Here are some trade confluences📝
✅Daily order block
✅15' order block
✅Intraday breaks of structure
✅4H Order block
🔑 Remember, to participate in trading comes always with a degree of risk, therefore as professional risk managers it remains vital that we stick to our risk management plan as well as our trading strategies.
📈The rest, we leave to the balance of probabilities.
💡Fail to plan. Plan to fail.
🏆It has always been that simple.
❤️Good luck with your trading journey, I shall see you at the very top.
🎯Trade consistent, FRGNT X

GBPJPYUnited Kingdom (GBP)
10-Year Gilt Yield:
4.50%–4.51% (June 19–20, 2025)
Bank of England Interest Rate:
As of June 19, 2025, the Bank of England (BoE) has held the official Bank Rate steady at 4.25%. This decision was made by a 6-3 majority vote of the Monetary Policy Committee (MPC) during its June meeting.
Key Points:
Current Interest Rate: 4.25% (held steady)
Inflation: UK annual inflation stood at 3.4% in May 2025, above the BoE’s 2% target but slightly easing from previous months.
Inflation Outlook: The BoE expects inflation to rise to about 3.7% in Q3 2025 before gradually declining next year.
Economic Growth: UK GDP growth remains weak, with some signs of a softening labor market and moderating wage growth.
Monetary Policy Stance: The BoE maintains a cautious, data-dependent approach, keeping rates restrictive to combat inflation but ready to adjust as economic conditions evolve.
Rate Cuts: Although the BoE held rates in June, markets and analysts widely expect the first rate cut to come in August 2025, with further cuts possible later in the year depending on inflation and growth data.
Geopolitical Risks: Rising tensions in the Middle East and uncertainties over global tariffs could add inflationary pressures, influencing future BoE decisions.
MPC adopted 4.25% (held steady at the June 2025 meeting)
Japan (JPY)
10-Year Japanese Government Bond Yield:
1.44%–1.45% (June 19–20, 2025)
Bank of Japan Interest Rate:
0.50% (unchanged as of May/June 2025)
Summary Table
Country 10Y Bond Yield Policy Interest Rate
United Kingdom 4.50%–4.51% 4.25%
Japan 1.44%–1.45% 0.50%
Interpretation for GBPJPY
The yield and interest rate differentials remain strongly in favor of the British pound. This supports GBPJPY on a fundamental basis, as higher UK yields and rates attract capital relative to Japan’s much lower rates.
The Bank of England is holding rates steady due to persistent inflation, while the Bank of Japan is also on hold but at a much lower level, reflecting Japan’s ongoing low inflation and growth outlook.
#GBPJPY

GBPJPY LONG & SHORT FORECAST Q2 W25 D20 Y25GBPJPY LONG & SHORT FORECAST Q2 W25 D20 Y25
Professional Risk Managers👋
Welcome back to another FRGNT chart update📈
Diving into some Forex setups using predominantly higher time frame order blocks alongside confirmation breaks of structure.
Let’s see what price action is telling us today!
💡Here are some trade confluences📝
✅Daily order block
✅15' order block
✅Intraday breaks of structure
✅4H Order block
🔑 Remember, to participate in trading comes always with a degree of risk, therefore as professional risk managers it remains vital that we stick to our risk management plan as well as our trading strategies.
📈The rest, we leave to the balance of probabilities.
💡Fail to plan. Plan to fail.
🏆It has always been that simple.
❤️Good luck with your trading journey, I shall see you at the very top.
🎯Trade consistent, FRGNT X

GBPJPY I Expect a Rally from the Buy Zone in the 1H Time FrameDescription:
I'm viewing the 195.116–194.845 range on GBPJPY as a strong buy zone. My target is 196.088. Once the trade setup becomes active or the target is reached, I’ll be sharing an update here. Stay tuned!
I meticulously prepare these analyses for you, and I sincerely appreciate your support through likes. Every like from you is my biggest motivation to continue sharing my analyses.
I’m truly grateful for each of you—love to all my followers💙💙💙

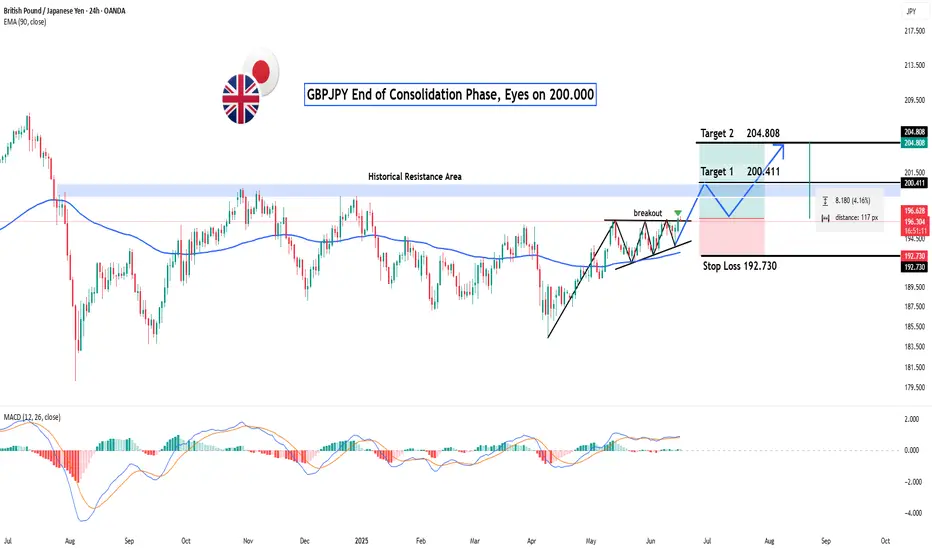
GBPJPY: End of Consolidation Phase, Eyes on 200.000?Hey Realistic Traders!
Could this be the beginning of a major bullish wave ?
Let’s Break It Down..
On the daily timeframe, GBPJPY has formed a Symmetrical Triangle Pattern, followed by a bullish breakout, a classic technical signal that typically marks the end of a consolidation phase and the start of a new bullish trend. This move is further confirmed by the appearance of a strong bullish candlestick, reflecting a surge in buying momentum.
Supporting this bullish scenario, the MACD indicator has also formed a bullish crossover, where the MACD line crosses above the signal line. This crossover is widely regarded as a momentum shift from bearish to bullish, strengthening the case for continued upward movement.
Given these technical signals, the price is likely to advance toward the first target at 200.411, with a potential extension to 204.808.
This bullish outlook remains valid as long as the price holds above the key stop-loss level at 192.730.
Support the channel by engaging with the content, using the rocket button, and sharing your opinions in the comments below.
Disclaimer: "Please note that this analysis is solely for educational purposes and should not be considered a recommendation to take a long or short position on OANDA:GBPJPY ".
Pound-yen might try again to break above ¥196So far, the yen hasn’t seen much demand as a haven amid the war between Israel and Iran. Some expectations indicate that the Bank of Japan might call for a single hike to 0.75% on 31 July while the Bank of England seems likely to cut to 4% in August. Regardless how rates move over the summer, it seems very likely that the differential in rates will shrink further by the end of the year.
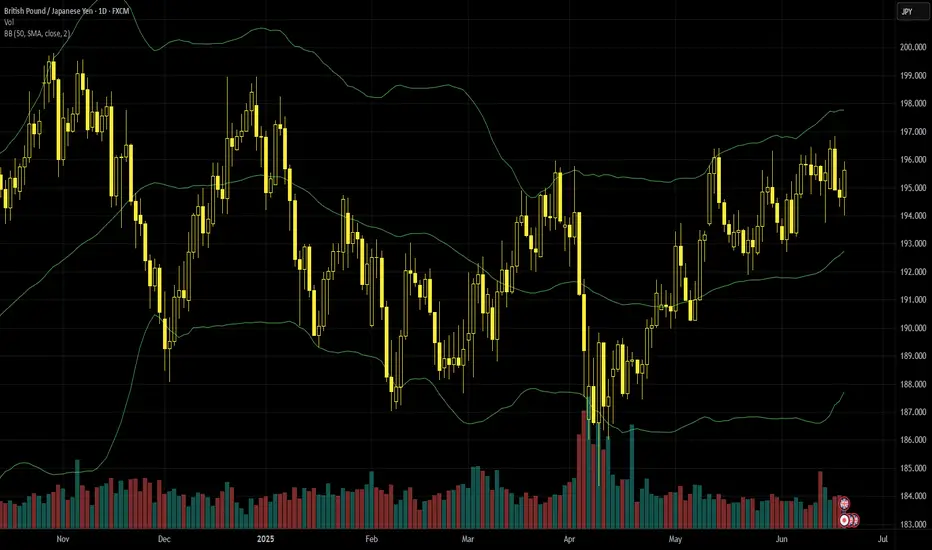
The false breakout on 16 and 17 June seems to strengthen the area of ¥196.50 as a possible resistance, but strong intraday gains on 19 June might suggest that there could be another attempt on this possible resistance soon. There’s no obvious trend on the daily chart but the weekly trend is clearly sideways. 18-19 June forms a near engulfing pattern, which could also suggest upward momentum to come.
Dynamic support might come from the value area between the 50 SMA from Bands and the 200 SMA. The latter has been tested repeatedly and unsuccessfully since last month. Given a relatively low ATR and volume, continuation within the range might be more likely than a sustained upward breakout, but that also depends on the general situation in markets. With no top data from either Britain or Japan until 11 July, traders will probably continue to watch news of tariffs and the Israeli-Iranian war.
This is my personal opinion, not the opinion of Exness. This is not a recommendation to trade.
GBPJPY Potential DownsidesHey Traders, in tomorrow's trading session we are monitoring GBPJPY for a selling opportunity around 195.600 zone, GBPJPY is trading in a downtrend and currently is in a correction phase in which in which it is approaching the trend at 195.600 support and resistance area.
Trade safe, Joe.


GBPJPY I Weekly CLS I Model 2 I H4 OB entry Hey, Market Warriors, here is another outlook on this instrument
If you’ve been following me, you already know every setup you see is built around a CLS Footprint, a Key Level, Liquidity and a specific execution model.
If you haven't followed me yet, start now.
My trading system is completely mechanical — designed to remove emotions, opinions, and impulsive decisions. No messy diagonal lines. No random drawings. Just clarity, structure, and execution.
🧩 What is CLS?
CLS is real smart money — the combined power of major investment banks and central banks moving over 6.5 trillion dollars a day. Understanding their operations is key to markets.
✅ Understanding the behavior of CLS allows you to position yourself with the giants during the market manipulations — leading to buying lows and selling highs - cleaner entries, clearer exits, and consistent profits.
📍 Model 1
is right after the manipulation of the CLS candle when CIOD occurs, and we are targeting 50% of the CLS range. H4 CLS ranges supported by HTF go straight to the opposing range.
"Adapt what is useful, reject what is useless, and add what is specifically your own."
— David Perk aka Dave FX Hunter ⚔️
👍 Hit like if you find this analysis helpful, and don't hesitate to comment with your opinions, charts or any questions.

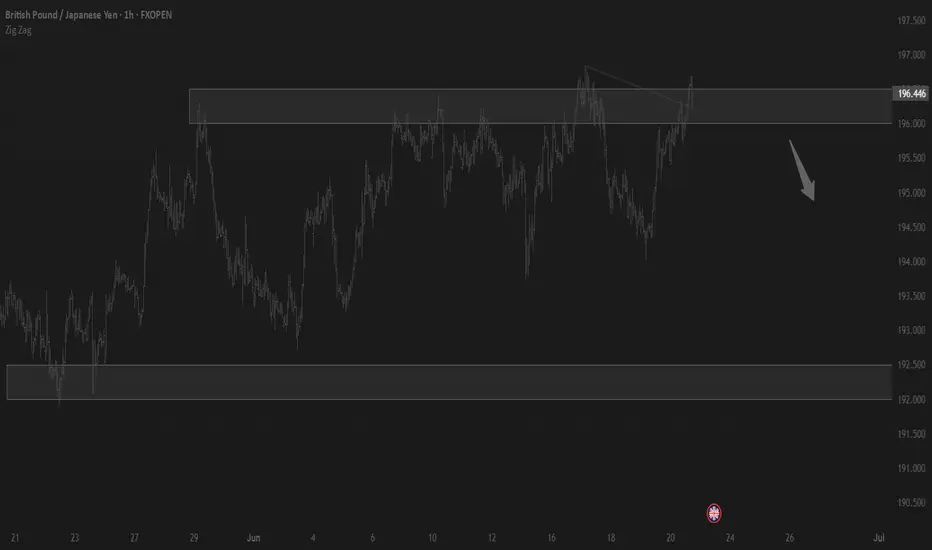
GBPJPY Bearish sideways consolidation capped at 109.50The GBP/JPY currency pair continues to display a bearish outlook, in line with the prevailing downward trend. Recent price action suggests a corrective pullback, potentially setting up for another move lower if resistance holds.
Key Level: 196.50
This zone, previously a consolidation area, now acts as a significant resistance level.
Bearish Scenario (rejection at 196.50):
A failed test and rejection at 196.50 would likely resume the bearish momentum.
Downside targets include:
194.20 – Initial support
193.00 – Intermediate support
191.90 – Longer-term support level
Bullish Scenario (breakout above 196.50):
A confirmed breakout and daily close above 196.50 would invalidate the bearish setup.
In that case, potential upside resistance levels are:
197.50 – First resistance
198.30 – Further upside target
Conclusion
GBP/JPY remains under bearish pressure, with the 196.50 level acting as a key inflection point. As long as price remains below this level, the bias favors further downside toward the 194.20–191.90 region. However, a sustained break above 196.50 would shift sentiment bullish, targeting 197.50 and beyond. Traders should watch for price confirmation around 196.50 to assess the next move.
This communication is for informational purposes only and should not be viewed as any form of recommendation as to a particular course of action or as investment advice. It is not intended as an offer or solicitation for the purchase or sale of any financial instrument or as an official confirmation of any transaction. Opinions, estimates and assumptions expressed herein are made as of the date of this communication and are subject to change without notice. This communication has been prepared based upon information, including market prices, data and other information, believed to be reliable; however, Trade Nation does not warrant its completeness or accuracy. All market prices and market data contained in or attached to this communication are indicative and subject to change without notice.

GJ-Thu-19/06/25 TDA-Eyes on BoE interest rate decisionAnalysis done directly on the chart
Follow for more, possible live trades update!
Focus on your trading time. If you have missed
a move but it wasnt in your trading time
then you haven't missed anything.
Active in London session!
Not financial advice, DYOR.
Market Flow Strategy
Mister Y

GBPJPYGBPJPY
New trade setup, strong bullish momentum price action has currently moved above the 195.00 handle price action has already created a liquidity sweep at key levels H4 timeframe is in an uptrend, H4 is clearly making higher highs and higher lows. If price action breaks above 195.30 I will look for a retest at that level to go long if price fails at 195.30 I will look for a retest around 194.80 as a possible long entry.
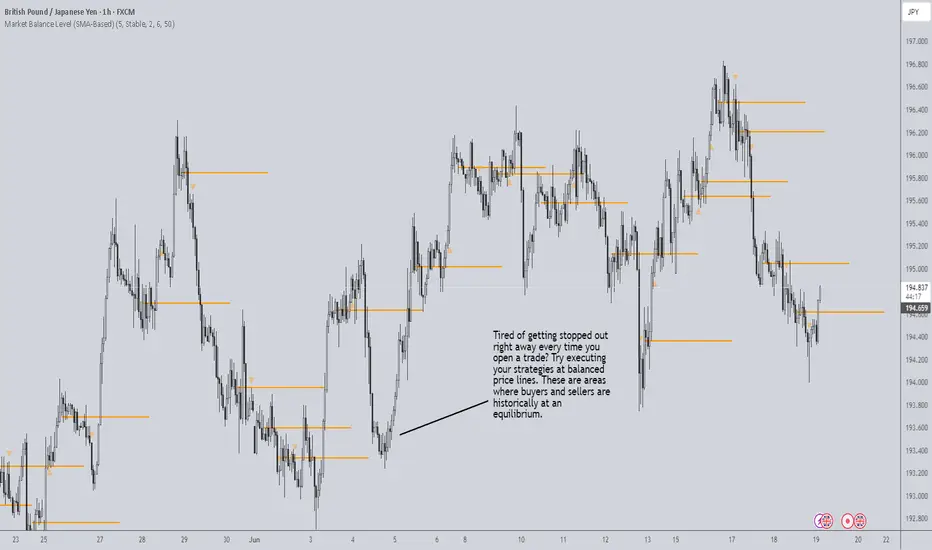
Liquidity, Herd Behavior, and the Importance of Market BalanceLiquidity can be one of the most frustrating aspects of trading. It often feels as though price is magnetically drawn to your stop loss the moment you place it. While this may seem intentional, it actually stems from a powerful psychological and structural force in the market: herd behavior .
No matter how unique your trading system may feel, chances are you're not the only one using it—or at least not the only one identifying the same key levels. Traders around the world are often taught similar risk management techniques, such as placing stop losses just beyond recent highs or lows. As a result, we unintentionally create liquidity pools —concentrated zones of clustered orders. This is the direct result of herd behavior : large groups of traders making similar decisions at the same levels.
As covered in our earlier publication, Redefining Trading Psychology , when stop losses or take-profit levels are hit, traders are forcibly exited from the market. If many traders are exiting simultaneously from the same level, it injects a burst of liquidity into the market. Market participants with large orders—like institutions or professional traders—rely on this liquidity to enter or exit positions without causing major slippage. Once these liquidity pockets are consumed, the market often stalls and enters consolidation .
These consolidation zones are more than just sideways price action; they are areas of equilibrium , where buying and selling pressure are balanced. No side dominates, and price fluctuates within a tight range. But equilibrium is temporary.
As momentum builds—either bullish or bearish—an imbalance emerges. This is typically driven by an excess of buyers or sellers overpowering the market. But momentum doesn’t last forever. Eventually, it fades, and the price reverts to a more balanced level—often retracing to a previous consolidation zone. These zones act as gravitational points that attract price back to them, offering traders a reliable reference for potential reversals or continuations.
Many traders get stopped out prematurely because they enter during imbalanced phases of the market—often as a result of following the herd. This creates unstable setups that are more likely to fail. The key to improving trade accuracy is to avoid reactive, herd-driven entries and instead focus on entering when the market has returned to a state of balance . Entering at the right moment—when the market is in balance—gives your trades a greater potential to move into profit quickly. This not only improves the quality of your entries but also increases the likelihood of success over time.
To support this approach, I’ve developed tools that help identify market balance and momentum shifts in real-time. Visit my TradingView profile, The_Forex_Steward , to access these indicators and gain deeper insights into timing entries with greater precision—away from the noise of the herd.