GBPJPY buy trade hit take profit Congrats to BALE_FX vips membrs
We hit take profit Wednesday last week ...
GBPJPY buy trade profit hit Congratulations to those of us that took this trade we just hit take profit now
JPYGBP trade ideas

GBPJPY Surges as Trade Tensions Weaken YenGBPJPY Surges as Trade Tensions Weaken Yen
GBPJPY remains firmly in a bullish trend, having broken through two key resistance levels.
The first breakout occurred at 196.80, followed by a decisive move above 198.75 on Monday, signaling accelerating bullish momentum.
On July 7, the White House issued a strong letter to Japan’s Prime Minister, expressing concerns over the trade deficit and announcing a 25% tariff on Japanese goods, effective August 1, 2025.
This development has added pressure on the yen, and the weakness could persist in the near term.
However, the situation is still unfolding. Trump is expected to send additional letters today, which could inject further volatility into the markets.
You may find more details in the chart!
Thank you and Good Luck!
PS: Please support with a like or comment if you find this analysis useful for your trading day

GBP/JPY - Potential TargetsDear Friends in Trading,
How I see it,
PIVOT @ 195.650
Psychological Resistance @ 200.000
1) Daily bull trend intact at this time
2) Resistance has the potential to force a correction
3) As long as price remains above PIVOT, bullish potential
remains high.
Keynote:
Monitor price action at your daily trend closely in case of a correction.
I sincerely hope my point of view offers a valued insight.
Thank you for taking the time to study my analysis.

GBPJPY - Multi-Year Short Update! In our last setup for GBPJPY, we identified a massive diagonal pattern, with price completing wave 4 and preparing for a multi-year drop into wave 5.
Since then, price has played out exactly as forecasted — we've seen a clean impulse lower for wave 1, followed by an ABC correction for wave 2, which looks to have now completed.
This sets the stage for the next major leg — wave 3 of 5 — which historically carries the most power and momentum.
📉 See monthly chart here:
📊 GBP/JPY Wave‑3 Trade Idea
Background:
We’ve completed wave 1 down and wave 2 up (ABC correction).
GBPJPY is now positioned to start a powerful wave 3 down — the most impulsive leg in an Elliott sequence.
🔍 Current Price Action:
Price is rejecting major resistance (previous wave A high + shaded zone)
Structure shows a completed 5-wave move up within C, suggesting exhaustion.
A clean ascending trendline (red) has formed under wave v — a break here signals the first confirmation.
Option 1 – Aggressive Entry:
- Trigger: Break and close below the red trendline (~198.00–197.80 zone) on the daily.
- Entry: On candle close below trendline
- Stop Loss: Above recent high ~199.80 and then breakeven once we move lower
Option 2 – Conservative Entry (preferred):
- Trigger: Trendline break + correction
- Entry: On bearish confirmation and then a correction to indicate further downside
- Stop Loss: Above recent high ~199.80 and then breakeven once we move lower
Take Profit Levels:
- TP1: 192
- TP2: 180
- TP3: 175
- Final Target: Trail for extended move toward wave (3) lows (could be 10,000+ pips over long term)
🔐 Invalidation:
Daily close back above 200.00 or impulsive rally beyond the pink resistance zone invalidates the short bias in the short term.
✅ Summary:
This is a high-conviction, structure-backed setup with:
- Wave count + Fib confluence
- Bearish structure at key resistance
- Confirmation-based trigger (trendline break + retest)
- Excellent long-term risk-to-reward profile
📂 Previous GBPJPY Setups (Track Record):
📌 Free Setup (Big Picture Outlook) – Multi-Year Shorts Incoming (Wave 4 Completion)
✅ Swing 1 – 1,200 Pips (VIP GBPJPY Long)
✅ Swing 2 – 1,000 Pips (VIP GBPJPY Short)
✅ Swing 3 – 1,100 Pips (VIP GBPJPY Short)
✅ Swing 4 – 700 Pips (VIP GBPJPY Short)

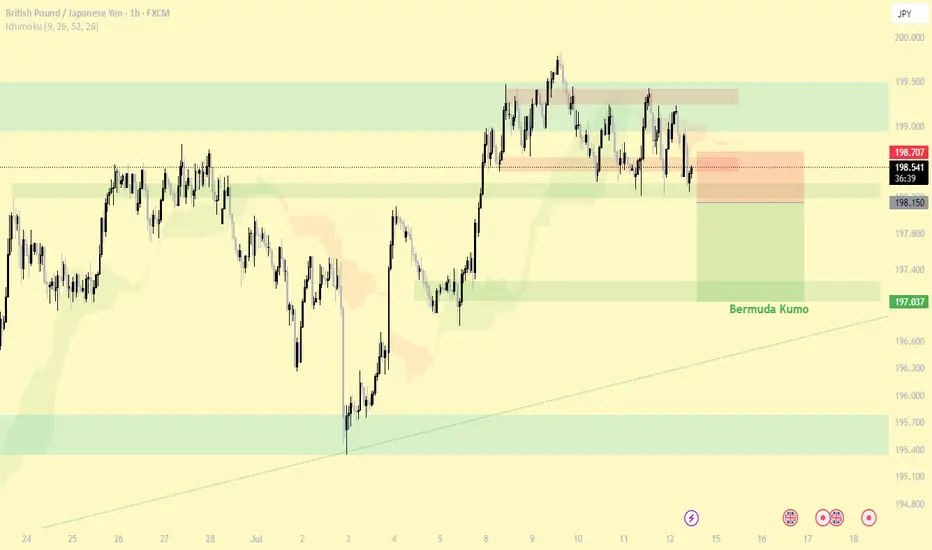
#GBP/JPY Monday 14 Jul 2025Reasons for entering the trade:
1- Breaking the last low of the high and the range area
2- Breaking the 4H support
3- Bermuda Kumo (4H)
Entry: 198.150
TP: 197.037
SL: 198.218
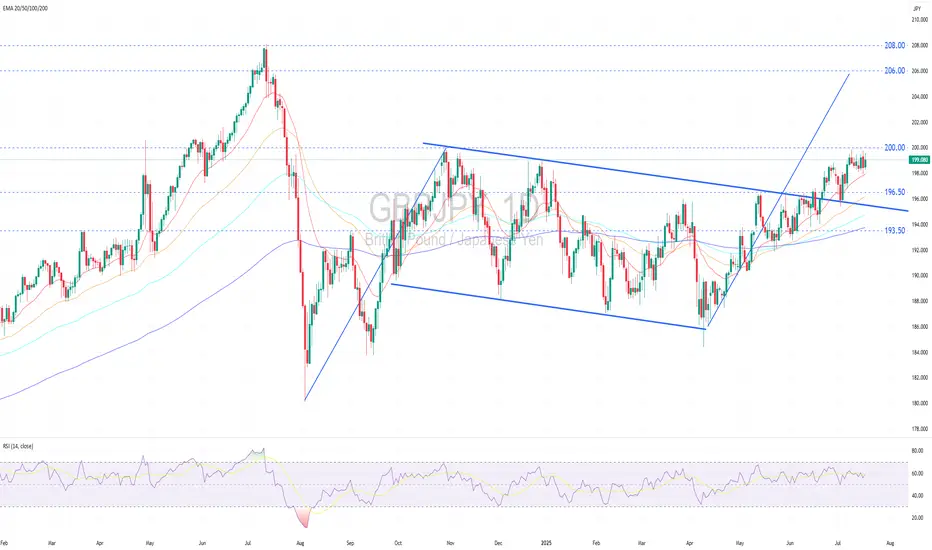
GBPJPY Remains in a Solid Uptrend.GBPJPY remains in a solid uptrend.
Technical Outlook:
GBPJPY remains in a firm uptrend, forming a series of higher highs and higher lows while holding above widening bullish EMAs, signaling strong bullish momentum.
Price is currently consolidating sideways near the recent peak, following a successful retest of the broken descending trendline, a classic bullish continuation setup.
No clear reversal signals have emerged, and the range-bound action suggests accumulation ahead of a potential upward breakout (above 200.00).
A decisive breakout above the psychological resistance at 200.00 would confirm a trend-following breakout, opening upside targets at 206.00 (flagpole projection) and potentially 208.00 (2024 high).
Near-term pullbacks may find support at 196.50 , the prior breakout zone, before resuming the uptrend.
Fundamental Outlook:
The pound is supported by higher-than-expected inflation data for June, with the UK’s Consumer Price Index (CPI) coming in at 3.6%, nearly twice the BoE target. This has led markets to expect that the BoE might delay or pause interest rate cuts at its upcoming meeting in August.
Moreover, the UK Prime Minister’s strong commitment to fiscal discipline has played a pivotal role in reinforcing investor confidence, thereby lending further support to the pound.
In contrast, the BoJ continues to adopt a cautious stance, keeping its policy rate at a relatively low at 0.50%. This conservative approach reflects the central bank’s intent to monitor the economic impacts of US tariff increases before any further action.
The BoJ’s low-rate policy sustains yen carry trades, driving capital outflows into higher-yielding US assets, mostly US treasury bonds, and intensifying downward pressure on the yen.
Analysis by: Krisada Yoonaisil, Financial Markets Strategist at Exness
Why election risk means yen volatility could rise this weekThe Japanese yen remains vulnerable ahead of Japan’s Upper House election on July 20.
Polls suggest the ruling LDP-Komeito coalition may lose its Upper House majority. Such an outcome would further weaken Prime Minister Shigeru Ishiba’s position, with his government already operating as a minority in the Lower House.
Adding to the pressure, the U.S. is set to impose 25% tariffs on Japanese goods from August 1—part of a broader protectionist push.
GBPJPY Broke trend line is likely to go downGBPJPY was trending up but recently has broken the trendline support and price is likely to go down after a retest.
GBPJPY - 1D SetupThe Japanese yen may get stronger for a while due to the weakening of the British Economy, which may lead to a pullback of the GBPJPY currency, and this seems to be a good trading opportunity in sells with a strict stop-loss. OANDA:GBPJPY
Note- This is my own view and not a financial advice as trading comes with high risk.

GBPJPY Will Grow! Buy!
Here is our detailed technical review for GBPJPY.
Time Frame: 1D
Current Trend: Bullish
Sentiment: Oversold (based on 7-period RSI)
Forecast: Bullish
The market is trading around a solid horizontal structure 198.531.
The above observations make me that the market will inevitably achieve 202.938 level.
P.S
The term oversold refers to a condition where an asset has traded lower in price and has the potential for a price bounce.
Overbought refers to market scenarios where the instrument is traded considerably higher than its fair value. Overvaluation is caused by market sentiments when there is positive news.
Disclosure: I am part of Trade Nation's Influencer program and receive a monthly fee for using their TradingView charts in my analysis.
Like and subscribe and comment my ideas if you enjoy them!

gbp/jpymultiple rejections from the key supply/resistance zone i dont see a reason why market wouldnt target the support/demand zone.

GBP JPY shorti was watching people analyses that I've arrived at an analyze for gbp jpy , the analyze was telling about gbp jpy going up buy i didn't follow , went on my chart and get my idea. the challenge is kinda funny lets see it will go up or down ...

GBP/JPY H4 | Yen weakness to persist?GBP/JPY is falling towards a pullback support and could potentially bounce off this level to climb higher.
Buy entry is at 197.98 which is a pullback support that aligns with the 38.2% Fibonacci retracement.
Stop loss is at 196.68 which is a level that lies underneath a swing-low support and the 61.8% Fibonacci retracement.
Take profit is at 199.75 which is a swing-high resistance.
High Risk Investment Warning
Trading Forex/CFDs on margin carries a high level of risk and may not be suitable for all investors. Leverage can work against you.
Stratos Markets Limited (tradu.com ):
CFDs are complex instruments and come with a high risk of losing money rapidly due to leverage. 63% of retail investor accounts lose money when trading CFDs with this provider. You should consider whether you understand how CFDs work and whether you can afford to take the high risk of losing your money.
Stratos Europe Ltd (tradu.com ):
CFDs are complex instruments and come with a high risk of losing money rapidly due to leverage. 63% of retail investor accounts lose money when trading CFDs with this provider. You should consider whether you understand how CFDs work and whether you can afford to take the high risk of losing your money.
Stratos Global LLC (tradu.com ):
Losses can exceed deposits.
Please be advised that the information presented on TradingView is provided to Tradu (‘Company’, ‘we’) by a third-party provider (‘TFA Global Pte Ltd’). Please be reminded that you are solely responsible for the trading decisions on your account. There is a very high degree of risk involved in trading. Any information and/or content is intended entirely for research, educational and informational purposes only and does not constitute investment or consultation advice or investment strategy. The information is not tailored to the investment needs of any specific person and therefore does not involve a consideration of any of the investment objectives, financial situation or needs of any viewer that may receive it. Kindly also note that past performance is not a reliable indicator of future results. Actual results may differ materially from those anticipated in forward-looking or past performance statements. We assume no liability as to the accuracy or completeness of any of the information and/or content provided herein and the Company cannot be held responsible for any omission, mistake nor for any loss or damage including without limitation to any loss of profit which may arise from reliance on any information supplied by TFA Global Pte Ltd.
The speaker(s) is neither an employee, agent nor representative of Tradu and is therefore acting independently. The opinions given are their own, constitute general market commentary, and do not constitute the opinion or advice of Tradu or any form of personal or investment advice. Tradu neither endorses nor guarantees offerings of third-party speakers, nor is Tradu responsible for the content, veracity or opinions of third-party speakers, presenters or participants.

GBPJPY RangingGBPJPY is still in the range. For this range we can trade between the zones drawn. It has taken previous day high already. There is S&R level and supply zone if gets buyer push and crosses previous week high we may expect further bullish momentum. Till now we can trade between zones if we see any bullish signs.

#GPBJPY bearish in 15Mwe have a downtrend line \
sell position @198.45
with clear stop @ 198.75
first target is 198.30
and next target is 197.40
we make the trilling stop after first part close

$GJ (GBPJPY) 1HPrice is currently forming a descending triangle pattern, with clear lower highs and a horizontal support zone.
Trendline resistance is actively being respected.
Liquidity is likely building below the horizontal support zone.
A false breakout or sweep above the trendline followed by rejection could trigger institutional distribution.
As long as the descending trendline holds, and no bullish BOS occurs, the structure remains bearish. Look for price to accumulate short positions before expansion.

GBPJPYGBP/JPY is currently trading at 199.535, providing a potential short opportunity from elevated levels.
2. The ideal sell zone lies between 199.500 – 199.700, where price shows signs of rejection.
3. A downside move could test the first support (previous resistance flipped) at 199.000.
4. Further weakness may lead to a drop toward 198.500, the next key demand zone.
5. A break below 198.000 would act as a strong confirmation of bearish momentum.
6. Place a stop-loss above 200.300, as a move above this level would invalidate the sell setup.
7. Price action shows signs of exhaustion after recent bullish runs, hinting at a potential reversal.
8. Selling pressure near the psychological 200.00 level adds to bearish bias.
9. Monitor lower timeframes for bearish engulfing candles or breakdown patterns below 199.00.
10. Below 200.300, the trade favors the bears, aiming for targets down to 198.000 or lower.

Trading balanceTrading balance The price of the asset has rebounded from the balance zone. With the prospect of growth into the resistance zone.
STEAL THIS TRADE! GBP/JPY Long Setup(Thief Trader’s Secret Plan)💰 Thief Trader’s GBP/JPY Heist Alert – Stealthy Long Setup Loading!
🌍 Greetings, Profit Raiders!
Hola, Konnichiwa, Ni Hao, Privyet, Hallo, Bonjour!
📢 Attention Market Bandits & Chart Pirates—the GBP/JPY Beast is ripe for plunder! Time to execute the next Thief Trader Masterplan.
🎯 Entry Zone – Loot the Dip!
Current price = Open vault. Fire longs now or snipe pullbacks (15M/30M charts recent swing low level).
Pro Thief Move: Stack buy limits near swing lows/highs. Chart alerts = your secret weapon. 🔫
🛑 Stop Loss – Guard the Treasure!
Swing Thieves: Hide SL below 2H swing low of candle wick @ (~197.000).
Day Raiders: Adjust SL to your risk size & order count. No free rides!
🎯 Profit Target – Escape with the Cash!
Take the 202.000 bag or exit early if momentum fades.
🔪 Scalpers vs. Swingers – Choose Your Weapon!
Scalpers (Quick Strikes): Longs only. No distractions.
Swing Traders (Patient Hunters): Trail stops & lock in gains.
🌪️ Market Pulse – Bullish Winds Blowing!
Price battling MA Resistance? No panic. Bulls still rule thanks to:
Fundamentals + Macro Trends
COT Data + Sentiment Shift
Quant Scores & Intermarket Alignments
(Check Linnkss for the full heist blueprint.)
⚠️ News Trap Warning!
Upcoming high-impact events? Freeze trades or tighten stops. Trailing SL = your escape route.
🚨 Join the Thief Trading Crew!
Like 👍 or Boost 🚀 this idea to fuel our next raid.
Thief Trader Tactics = Daily Market Domination. Your support keeps the heists alive! 💰❤️
🤑 Stay Locked In – The Next Big Score is Coming…
Timing is everything. Watch the charts. Strike hard. Exit smarter.

British Pound / Japanese Yen (GBP/JPY) 4-Hour Chart Analysis4-hour performance of the British Pound against the Japanese Yen (GBP/JPY) via OANDA data. The current price is 199.352, reflecting a 0.129 (0.06%) increase. The chart highlights a recent upward trend, with key support levels around 198.107 and 198.994, and resistance near 200.415. A breakout above the recent high is indicated, suggesting potential for further gains.

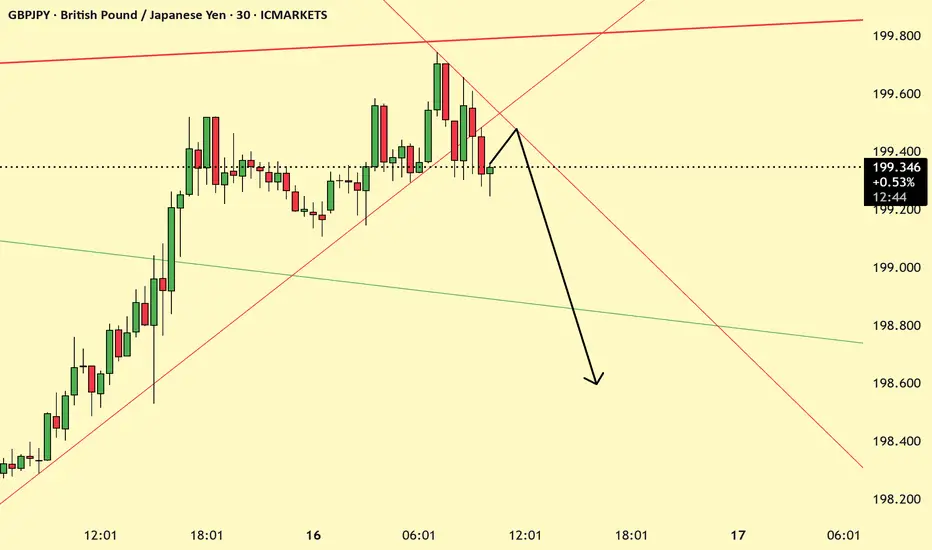
Lingrid | GBPJPY possible Pullback From Psychological LevelThe price perfectly fulfilled my last idea . FX:GBPJPY is testing the upper boundary of the resistance zone near the psychological 200.000 mark after a strong bullish impulse. Price is showing early signs of rejection from the red trendline and horizontal resistance, suggesting potential for a corrective move. If confirmed, a drop toward the 197.600–197.000 region becomes likely, aligning with the lower bound of the rising channel. A break below this level could expose deeper downside toward the 195.5 support.
📉 Key Levels
Sell trigger: confirmed rejection from 200.000 with bearish engulfing
Sell zone: 200.50–200.00 (key resistance zone and trendline touch)
Target: 197.600
Invalidation: sustained close above 200.500 flips structure bullish
💡 Risks
Strong bullish continuation above 200.000 would invalidate short setup
Yen weakness from BOJ policy shifts could drive GBPJPY higher
Support at 197.600 may cause bounce and false breakout scenarios
If this idea resonates with you or you have your own opinion, traders, hit the comments. I’m excited to read your thoughts!

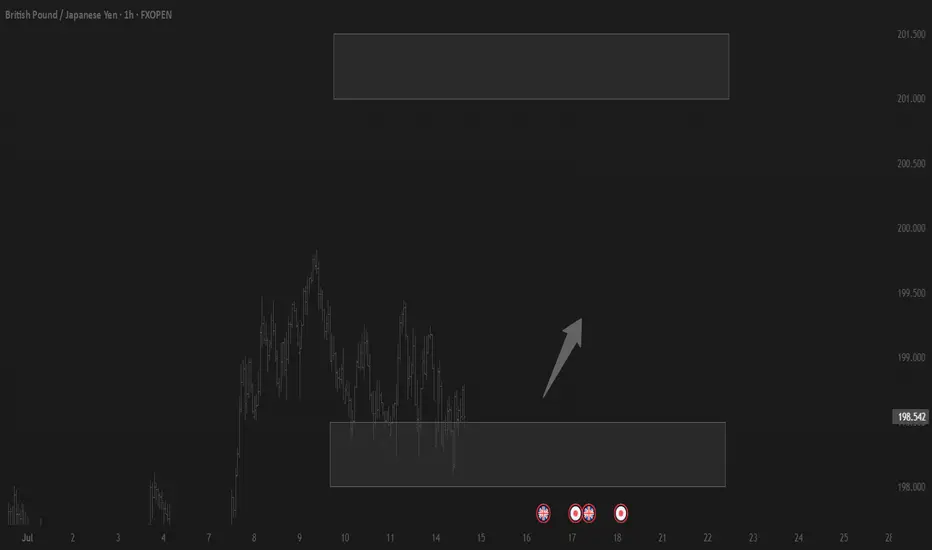
Guppy - Long TradeExpecting a bearish move down and then a strong reversal at the levels displayed!
Happy Trading!

Long gbpjpyYou can buy Gbpjpy now or play it safe and wait until price comes to entry level which is the current today's high by using buystops
