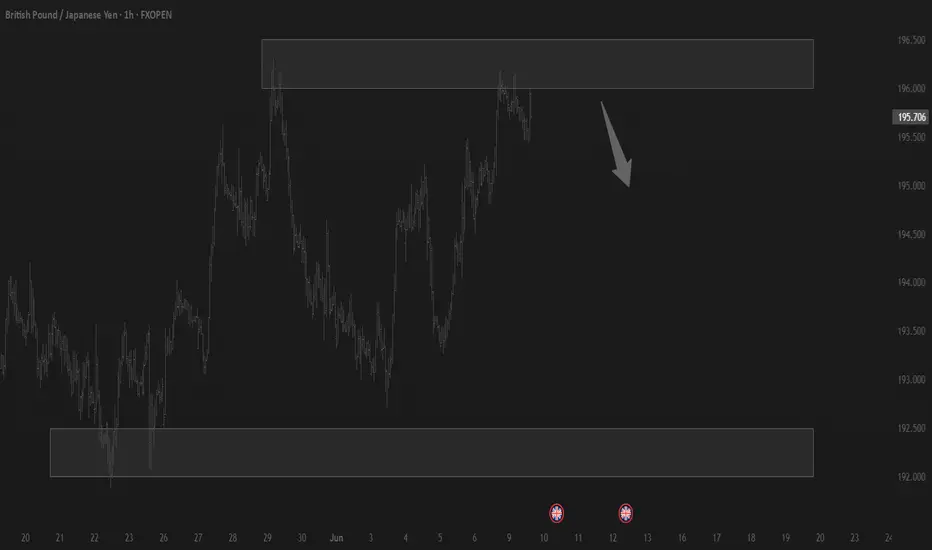
GJ-Tue-10/06/25 TDA-Claimant count change negative, GJ down!Analysis done directly on the chart
Follow for more, possible live trades update!
To understand if you are really for the long term trading
your mindset should not be if I make losses
I can always fund another account again or buy new challenges
but it shifts to how can I protect my capital so I will lose less
and in the future avoiding to make same mistakes?
Active in London session!
Not financial advice, DYOR.
Market Flow Strategy
Mister Y
JPYGBP trade ideas


possibility of uptrendIt is expected that a corrective trend will form to the specified support levels. Then there is a possibility of a trend change and the upward trend will continue.
If the price breaks through the support range, the continuation of the downward trend will be likely.

GBPJPY Might Start A CorrectionAfter weeks of rising, GBPJPY is showing signs of fatigue.
The AD line shows that the bulls are unable to drive the price upwards despite great efforts, while a liquidity zone awaits at the bottom with the Wick.
For this reason, it may make sense to take a short position with the aim of clearing the wick's liquidity.

GBPJPYDaily 4H / bullish
Price engages in overlapping parts of FVG. I see a reaction from the 4H FVG. I missed the entry and am waiting for a retracement in the 15-minute overlapping part as well.

Trading balanceTrading balance The price of the asset has rebounded from the balance zone. With the prospect of growth into the resistance zone.
GBPJPY Hello Traders,
There is a potential Buy opportunity on the pair, and I’d like to share it with you.
The setup provides an ideal buying condition, and I’ve configured the trade with a Risk-to-Reward Ratio of 1:2.
According to my personal entry model — which includes three different rating levels (a-b-c) — this setup has received the highest rating, which increases the likelihood of a successful outcome based on historical performance.
🔍 Trade Details
✔️ Timeframe: 15-Minute
✔️ Risk-to-Reward Ratio: 1:2
✔️ Trade Direction: Buy
✔️ Entry Price: 195.654
✔️ Take Profit: 196.179
✔️ Stop Loss: 195.391
🔔 Disclaimer: This is not financial advice. I’m simply sharing a trade I’ve taken based on my personal trading system, strictly for educational and illustrative purposes.
📌 Interested in a systematic, data-driven trading approach?
💡 Follow the page and turn on notifications to stay updated on future trade setups and advanced market insights.

GBPJPY Will Move Lower! Sell!
Here is our detailed technical review for GBPJPY.
Time Frame: 15h
Current Trend: Bearish
Sentiment: Overbought (based on 7-period RSI)
Forecast: Bearish
The market is approaching a significant resistance area 195.681.
Due to the fact that we see a positive bearish reaction from the underlined area, I strongly believe that sellers will manage to push the price all the way down to 193.757 level.
P.S
Overbought describes a period of time where there has been a significant and consistent upward move in price over a period of time without much pullback.
Disclosure: I am part of Trade Nation's Influencer program and receive a monthly fee for using their TradingView charts in my analysis.
Like and subscribe and comment my ideas if you enjoy them!

USDJPY and GBPJPY Analysis todayHello traders, this is a complete multiple timeframe analysis of this pair. We see could find significant trading opportunities as per analysis upon price action confirmation we may take this trade. Smash the like button if you find value in this analysis and drop a comment if you have any questions or let me know which pair to cover in my next analysis.

bullish move after finding support on an overlap with fair valuewe can see potential bulls stepping in, as we are at a very strong bullish level bullish arguments have stacked up against the bears

GBPJPY eyes breakout with 450 pip potentialGBPJPY is testing key resistance at 196.43 in an ascending triangle. A breakout could trigger a 450+ pip move. EURJPY and Dow Jones show similar setups, adding confluence.
This content is not directed to residents of the EU or UK. Any opinions, news, research, analyses, prices or other information contained on this website is provided as general market commentary and does not constitute investment advice. ThinkMarkets will not accept liability for any loss or damage including, without limitation, to any loss of profit which may arise directly or indirectly from use of or reliance on such information.

GJ-Mon-9/06/25 TDA-Daily resistance tapped 196.096Analysis done directly on the chart
Follow for more, possible live trades update!
Price tapped daily resistance 196.096 and
currently rejecting ahead of this week multiple
red news folders (UK claimant count change,
USD CPI, PPI).
Active in London session!
Not financial advice, DYOR.
Market Flow Strategy
Mister Y

gbpjpy sell signal. Don't forget about stop-loss.
Write in the comments all your questions and instruments analysis of which you want to see.
Friends, push the like button, write a comment, and share with your mates - that would be the best THANK YOU.
P.S. I personally will open entry if the price will show it according to my strategy.
Always make your analysis before a trade

GBPJPYGBP/JPY Sell Trade Setup – Technical Analysis
🔽 Entry Zone: 195.890 – 196.000
🔒 Stop Loss: 196.700 (Above recent resistance zone)
🎯 Target Levels:
195.00 – First Target (Minor support area)
194.00 – Second Target (Key price reaction zone)
193.00 – Final Target (Major support and potential bounce area)
GBP/JPY is showing signs of weakness near the psychological resistance around 196.00, with bearish price action suggesting a potential reversal. This level coincides with previous highs and a supply zone where sellers have previously stepped in.
A breakdown below 195.800 could confirm short-term bearish continuation, targeting deeper levels as momentum builds to the downside. The setup offers a favorable risk-to-reward ratio, with tight risk control above the resistance zone.

GBPJPY: Bullish As Long As 195 Hold As SupportI'm looking to buy GJ after a small retracement or breakout entry...
POI 195.2-195.4 which has a 50 and 62 fib confluence.
If no retracement, I will be looking for a breakout entry above 196.2
Let's wait and let the market come to us. Set those price alerts!

GBPJPY UPDATE!!Good day traders, I am back again with an update and this time it's on GBP/JPY. On the 1st of June I posted a setup but I mentioned that I will explain it later because I will be able to make my point clearer and easy to understand.
When this setup was posted I had that daily order block in mind, only because I needed to see it revisit the order block for the last time before price could make a run for that internal liquidity resting inside an unfilled FVG(BISI). We can also use that thought as confluence when looking for short term reversals or partial exits. Just by taking a look on the chart I posted again I will put it in the description below, you can see in the sell side of the chart we have a lot of equal lows and ICT teaches us that price looks for relative lows/equal lows and old lows.
On the daily TF price is currently inside a bearish order block and what we do not wanna see is price going over the wick of that wick of a candle that was booked on the 29th of May. We are also inside the premium zone of the wick meaning we can expect to run from there to our objectives below. As always my first objective is always the internal liquidity and that is only because that internal liquidity are my LTF | Highs/Lows.
On the 4H price is inside a balanced price range again that's in my favour meaning I have to note it. ICT teaches that we always wanna trade towards the direction where all our PD arrays are lining up and in this case, it's in the sellside, I believe we are in the starting phase of ICT's sell model.
My name is Teboho Matla but you...you don't know me yet!!

GBPJPY: Weekly OverviewHello Traders,
Everything is clear in the chart. the yellow line is a HTF resistance.
********************************************************
The indicated levels are determined based on the most reaction points and the assumption of approximately equal distance between the zones.
Some of these points can also be confirmed by the mathematical intervals of Murray.
You can enter with/without confirmation. IF you want to take confirmation you can use LTF analysis, Spike move confirmation, Trend Strength confirmation and ETC.
SL could be placed below the zone or regarding the LTF swings.
TP is the next zone or the nearest moving S&R, which are median and borders of the drawn channels.
*******************************************************************
Role of different zones:
GREEN: Just long trades allowed on them.
RED: Just Short trades allowed on them.
BLUE: both long and short trades allowed on them.
WHITE: No trades allowed on them! just use them as TP points

gbpjpyWe have a double top.
If the bottom breaks and the trend line breaks, there is a strong possibility of selling.
Another possibility is that there is serious resistance in the one-hour timeframe. If it cannot break, there is a possibility of falling from that area if the trend line breaks.

GBPJPY - Major Resistance Zone Threatens Further UpsideThe GBP/JPY 4-hour chart reveals the pair is approaching a critical resistance zone around the 196.00-196.50 level, marked by the upper boundary of the highlighted rectangular area, which represents a significant technical ceiling that has been tested multiple times over the past month. This resistance level coincides with previous swing highs and appears to be acting as a formidable barrier to further upside progress, suggesting that traders should exercise heightened caution as selling pressure is likely to intensify in this area. The pair's recent rally from the May lows around 190.50 has been impressive, but the multiple rejections from this upper resistance zone indicate that institutional sellers may be positioned to defend these levels aggressively. Given the historical significance of this resistance area and the potential for profit-taking after the substantial advance, market participants should be prepared for increased volatility and possible reversal signals as the pair approaches or tests this key technical barrier, making risk management particularly crucial at current levels.
Disclosure: I am part of Trade Nation's Influencer program and receive a monthly fee for using their TradingView charts in my analysis.

GBPJPYGBP/JPY Current 10-Year Bond Yield and Interest Rate Differential (June 2025)
1. Japan 10-Year Government Bond Yield
As of early June 2025, the Japan 10-year government bond yield is approximately 1.50% to 1.52%.
The yield rose by about 18 basis points in May 2025, closing near 1.50%, influenced by global yield increases, Moody’s US credit downgrade, and reduced BoJ purchases of super-long bonds.
The Bank of Japan maintains a very accommodative monetary policy with a policy rate around 0.50%, and the yield curve control program continues to cap longer-term yields, though with some recent volatility.
2. UK 10-Year Government Bond Yield (Gilt)
While the exact current UK 10-year gilt yield is not explicitly in the search results, typical recent yields for UK 10-year bonds have been around 3.5% to 4.0% in mid-2025, reflecting tighter monetary policy by the Bank of England amid inflation concerns.
The Bank of England’s policy rate is higher than Japan’s, around 4.5% to 5.0%, consistent with the higher gilt yields.
3. Interest Rate Differential
Using approximate yields:
UK 10-year gilt yield: ~3.75% (midpoint estimate)
Japan 10-year JGB yield: ~1.50%
The 10-year bond yield differential (UK minus Japan) is roughly:
3.75%−1.50%=2.25%
This positive differential indicates UK bonds offer significantly higher yields than Japanese bonds, reflecting the divergent monetary policies and economic conditions.
Summary Table
Metric United Kingdom (GBP) Japan (JPY) Differential (GBP - JPY)
10-Year Government Bond Yield ~3.5% - 4.0% ~1.50% ~2.25%
Policy Interest Rate ~4.5% - 5.0% ~0.50% ~4.0%
Implications for GBP/JPY
The higher UK bond yields relative to Japan suggest a carry advantage for GBP over JPY, encouraging investors to hold GBP assets funded by low-yielding JPY.
According to uncovered interest rate parity (UIP), this yield gap implies the GBP should depreciate against JPY by about 2.25% annually to offset the higher returns, but in practice, GBP/JPY movements also depend on risk sentiment, growth outlook, and central bank policies.
The yen’s safe-haven status and BoJ’s yield curve control can dampen yield-driven moves, while the UK’s inflation and policy tightening support higher yields and GBP strength.
#GBPJPY

SELL GBPJPY (9 June Analysis)A simple straightforward setup for this coming week can be seen here on GBPJPY. The main structure is a double top. Price has been traveling within a channel forming the right top, I expect price to decline during Asia session this evening.

GBPJPY TRADING ROADMAP 09 - 13 JUNI 2025📈 GBPJPY TRADING ROADMAP
Trading Plan & Market Outlook
The GBPJPY pair is currently in a bullish trend and is now testing the Supply Zone between 195.796 – 197.538.
If price manages to break out and hold above this zone, there's potential for further upside towards the next Supply Zone at 198.798.
🔹 Key Zones:
Demand Zone (Support): 192.345 – 190.817
→ Acts as trend support and risk management threshold
Current Supply Zone (Resistance): 195.796 – 197.538
→ Being tested now
Next Supply Target (if breakout occurs): 198.798
🔹 Trading Outlook:
As long as price stays above 190.817, the bullish structure remains intact
A confirmed breakout above 197.538 could signal continuation to 198.798
Watch for price action confirmation before entering any trades near resistance zones
⚠️ DISCLAIMER ON
This content is for educational purposes only and does not constitute financial advice.
Trading involves significant risk and may not be suitable for all investors.
Always perform your own analysis and apply proper risk management strategies.

GBPJPY1. Japan 10-Year Government Bond Yield
As of early June 2025, the Japan 10-year government bond yield is approximately 1.50% to 1.52%.
The yield rose by about 18 basis points in May 2025, closing near 1.50%, influenced by global yield increases, Moody’s US credit downgrade, and reduced BoJ purchases of super-long bonds.
The Bank of Japan maintains a very accommodative monetary policy with a policy rate around 0.50%, and the yield curve control program continues to cap longer-term yields, though with some recent volatility.
The Bank of England’s policy rate is higher than Japan’s, around 4.5% to 5.0%, consistent with the higher gilt yields.
2. Interest Rate Differential
Using approximate yields:
UK 10-year gilt yield: ~3.75% (midpoint estimate)
Japan 10-year JGB yield: ~1.50%
The 10-year bond yield differential (UK minus Japan) is roughly:
3.75%−1.50%=2.25%
This positive differential indicates UK bonds offer significantly higher yields than Japanese bonds, reflecting the divergent monetary policies and economic conditions.
Summary Table
Metric United Kingdom (GBP) Japan (JPY) Differential (GBP - JPY)
10-Year Government Bond Yield ~3.5% - 4.0% ~1.50% ~2.25%
Policy Interest Rate ~4.5% - 5.0% ~0.50% ~4.0%
Implications for GBP/JPY
The higher UK bond yields relative to Japan suggest a carry advantage for GBP over JPY, encouraging investors to hold GBP assets funded by low-yielding JPY.
According to uncovered interest rate parity (UIP), this yield gap implies the GBP should depreciate against JPY by about 2.25% annually to offset the higher returns, but in practice, GBP/JPY movements also depend on risk sentiment, growth outlook, and central bank policies.
The yen’s safe-haven status and BoJ’s yield curve control can dampen yield-driven moves, while the UK’s inflation and policy tightening support higher yields and GBP strength
#gbpjpy
