Bullish bounce?GBP/JPY is falling towards the support level which is a pullback support that is slightly above the 100% Fibonacci projection and could bounce from this level to our take profit.
Entry: 191.97
Why we like it:
There is a pullback support level that is slightly above the 100% Fibonacci projection.
Stop loss: 190.39
Why we like it:
There is a pullback support level that lines up with the 138.2% Fibonacci extension.
Take profit: 196.27
Why we like it:
There is a pullback resistance level.
Enjoying your TradingView experience? Review us!
Please be advised that the information presented on TradingView is provided to Vantage (‘Vantage Global Limited’, ‘we’) by a third-party provider (‘Everest Fortune Group’). Please be reminded that you are solely responsible for the trading decisions on your account. There is a very high degree of risk involved in trading. Any information and/or content is intended entirely for research, educational and informational purposes only and does not constitute investment or consultation advice or investment strategy. The information is not tailored to the investment needs of any specific person and therefore does not involve a consideration of any of the investment objectives, financial situation or needs of any viewer that may receive it. Kindly also note that past performance is not a reliable indicator of future results. Actual results may differ materially from those anticipated in forward-looking or past performance statements. We assume no liability as to the accuracy or completeness of any of the information and/or content provided herein and the Company cannot be held responsible for any omission, mistake nor for any loss or damage including without limitation to any loss of profit which may arise from reliance on any information supplied by Everest Fortune Group.
JPYGBP trade ideas

GBP/JPY💰Symbol: { GBP/JPY }
🟩Price: { 194.574 }
🟥Stop: { 195.381 }
1️⃣profit: { 194.018 }
2️⃣profit: { 193.119 }
3️⃣profit: { 192.029 }
📊Check your chart before entering.
🚨Check before use to make sure there is no important news.🚨

WAITING FOR A TRIANGLE BREAKOUT Monitoring a 4H time frame on GBPJPY, we're nearing on a breakout only that we need to keep an eye whether it will be at the top or bottom.
If it happens at top, we shall have a bullish trend and if bottom, bearish.
Any idea concerning what have written hear is highly welcome.

GBPJPY - Short Term Sell Trade Update!!!Hi Traders, on May 14th I shared this idea "GBPJPY - Looking To Sell Pullbacks In The Short Term"
I expected to see pullbacks and further continuation lower until the strong resistance zone holds. You can read the full post using the link above.
Pullback and push lower happened as per the plan!!!
If you enjoy this idea, don’t forget to LIKE 👍, FOLLOW ✅, SHARE 🙌, and COMMENT ✍! Drop your thoughts and charts below to keep the discussion going. Your support helps keep this content free and reach more people! 🚀
-------------------------------------------------------------------------------------------------------------------
Disclosure: I am part of Trade Nation's Influencer program and receive a monthly fee for using their TradingView charts in my analysis.

GBP JPY BUYI made the post a bit late, I get in a n earlier entry and closed TP 1 and as we can see price is aiming a bit higher since it has broke Asian high and there are a lot of FVG that are left untouched.

GJ-Wed-4/06/25 TDA-GJ strong push, will it continue?Analysis done directly on the chart
Follow for more, possible live trades update!
Trading is not easy, there are so many factors,
variants that influence the price movement.
Generally when big moves happen, it is caused
by big news, important speeches, flash news.
Markets don't move randomly, it's really important
to understand why price had this particular move,
at that specific time and ask why.
Not financial advice, DYOR.
Market Flow Strategy
Mister Y

GBPJPY H4 | Bearish Fall Based on the H4 chart, the price has just reacted off our sell entry level at 194.99, a pullback resistance that aligns with the 61.8% Fib retracement.
Our take profit is set at 193.38 a pullback support.
The stop loss is set at 196.42, a swing high resistance.
High Risk Investment Warning
Trading Forex/CFDs on margin carries a high level of risk and may not be suitable for all investors. Leverage can work against you.
Stratos Markets Limited (tradu.com ):
CFDs are complex instruments and come with a high risk of losing money rapidly due to leverage. 63% of retail investor accounts lose money when trading CFDs with this provider. You should consider whether you understand how CFDs work and whether you can afford to take the high risk of losing your money.
Stratos Europe Ltd (tradu.com ):
CFDs are complex instruments and come with a high risk of losing money rapidly due to leverage. 63% of retail investor accounts lose money when trading CFDs with this provider. You should consider whether you understand how CFDs work and whether you can afford to take the high risk of losing your money.
Stratos Global LLC (tradu.com ):
Losses can exceed deposits.
Please be advised that the information presented on TradingView is provided to Tradu (‘Company’, ‘we’) by a third-party provider (‘TFA Global Pte Ltd’). Please be reminded that you are solely responsible for the trading decisions on your account. There is a very high degree of risk involved in trading. Any information and/or content is intended entirely for research, educational and informational purposes only and does not constitute investment or consultation advice or investment strategy. The information is not tailored to the investment needs of any specific person and therefore does not involve a consideration of any of the investment objectives, financial situation or needs of any viewer that may receive it. Kindly also note that past performance is not a reliable indicator of future results. Actual results may differ materially from those anticipated in forward-looking or past performance statements. We assume no liability as to the accuracy or completeness of any of the information and/or content provided herein and the Company cannot be held responsible for any omission, mistake nor for any loss or damage including without limitation to any loss of profit which may arise from reliance on any information supplied by TFA Global Pte Ltd.
The speaker(s) is neither an employee, agent nor representative of Tradu and is therefore acting independently. The opinions given are their own, constitute general market commentary, and do not constitute the opinion or advice of Tradu or any form of personal or investment advice. Tradu neither endorses nor guarantees offerings of third-party speakers, nor is Tradu responsible for the content, veracity or opinions of third-party speakers, presenters or participants.

GBPJPY
Buying GBP/JPY now at 193.157 provides a well-reasoned entry with multiple technical and fundamental factors in support. The upward targets (193.5, 194.0, 194.5) are realistic, and the stop loss at 192.000 is well-placed to manage risk. This setup offers a clear, high-probability opportunity in the forex market.
Excellent Risk-to-Reward Ratio
With entry at 193.157, stop loss at 192.000, and a third target at 194.500, the potential reward significantly outweighs the risk.
Price Action Suggests Continued Upside
The pair is trading above key moving averages (e.g., 50 and 200 SMA), showing sustained buyer interest and momentum.
Volume Supports the Move
Recent volume spikes during upward moves suggest strong institutional buying, a bullish confirmation.
No Major Resistance Until 194.50
Technical analysis shows limited resistance zones between the current level and 194.500, leaving room for upward continuation.

gbpjpy sell signal. Don't forget about stop-loss.
Write in the comments all your questions and instruments analysis of which you want to see.
Friends, push the like button, write a comment, and share with your mates - that would be the best THANK YOU.
P.S. I personally will open entry if the price will show it according to my strategy.
Always make your analysis before a trade

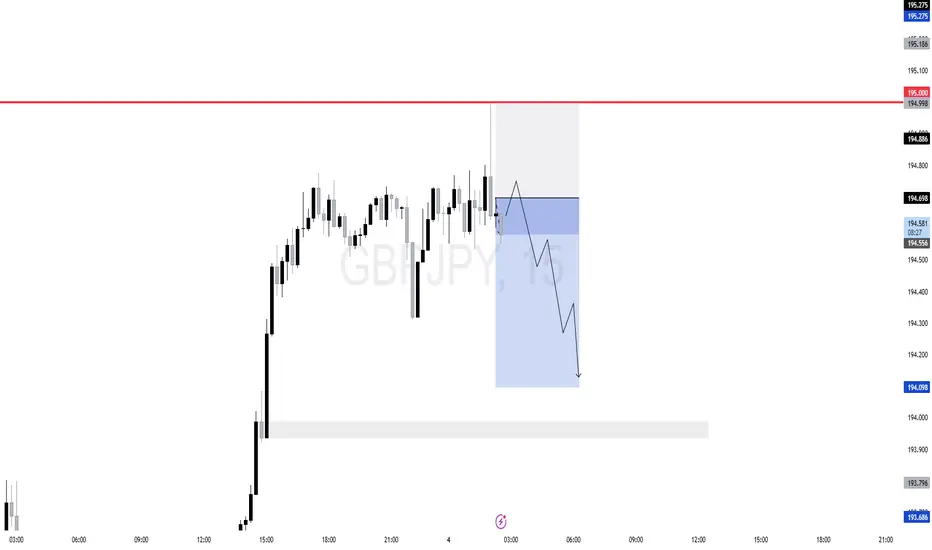
GBPJPY 15-min chart setup✅ What I Like:
Liquidity Sweep at 195.000: Price ran buy-side liquidity above a clear psychological level and showed signs of rejection — classic manipulation.
FVG + Premium Retracement: The short setup aligns with an entry around the 0.618–0.75 retracement zone of the recent leg up, which is also inside a fair value gap.
Timing
🔻 Concerns:
Momentum: The bullish impulse leading to 195.000 was strong. If no displacement confirms the move down, price may consolidate or go higher.
No Strong Break of Structure Yet: To validate full bearish intent, I'd prefer to see a solid break below a recent short-term low (market structure shift).
Potential bullish rise?GBP/JPY has reacted off the pivot and could rise to the 145% Fibonacci resistance.
Pivot: 194.43
1st Support: 193.80
1st Resistance: 195.61
Risk Warning:
Trading Forex and CFDs carries a high level of risk to your capital and you should only trade with money you can afford to lose. Trading Forex and CFDs may not be suitable for all investors, so please ensure that you fully understand the risks involved and seek independent advice if necessary.
Disclaimer:
The above opinions given constitute general market commentary, and do not constitute the opinion or advice of IC Markets or any form of personal or investment advice.
Any opinions, news, research, analyses, prices, other information, or links to third-party sites contained on this website are provided on an "as-is" basis, are intended only to be informative, is not an advice nor a recommendation, nor research, or a record of our trading prices, or an offer of, or solicitation for a transaction in any financial instrument and thus should not be treated as such. The information provided does not involve any specific investment objectives, financial situation and needs of any specific person who may receive it. Please be aware, that past performance is not a reliable indicator of future performance and/or results. Past Performance or Forward-looking scenarios based upon the reasonable beliefs of the third-party provider are not a guarantee of future performance. Actual results may differ materially from those anticipated in forward-looking or past performance statements. IC Markets makes no representation or warranty and assumes no liability as to the accuracy or completeness of the information provided, nor any loss arising from any investment based on a recommendation, forecast or any information supplied by any third-party.

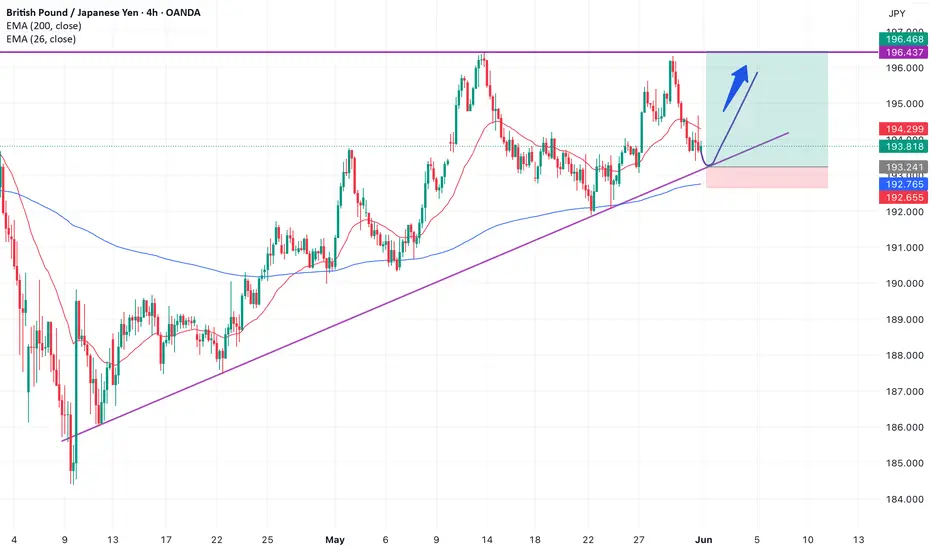
Gbp/jpy analysis According to the chart, we can see that the trend is upward, and we should wait until the price reaches the trendline before buying. It is important to set a stop below the blue line, which represents the 200 EMA."
Update GJ 1H June 3rd. Buy/SellPrice bounced around 192.50 — waited for confirmation and entered a buy (200+ pips profit). Now I'm watching the 1H. For a new buy opportunity, I’ll wait until tomorrow morning. In the meantime, I’ve placed a sell limit order at 195.15.
Knowing how the market moves, where price wants to go, and which levels it reacts to — that’s my skill. But anticipating it… that’s my true specialty.
Remember: the market is always right!


GBPJPY What Next? BUY!
My dear subscribers,
This is my opinion on the GBPJPY next move:
The instrument tests an important psychological level 193.34
Bias - Bullish
Technical Indicators: Supper Trend gives a precise Bullish signal, while Pivot Point HL predicts price changes and potential reversals in the market.
Target - 194.37
About Used Indicators:
On the subsequent day, trading above the pivot point is thought to indicate ongoing bullish sentiment, while trading below the pivot point indicates bearish sentiment.
Disclosure: I am part of Trade Nation's Influencer program and receive a monthly fee for using their TradingView charts in my analysis.
———————————
WISH YOU ALL LUCK

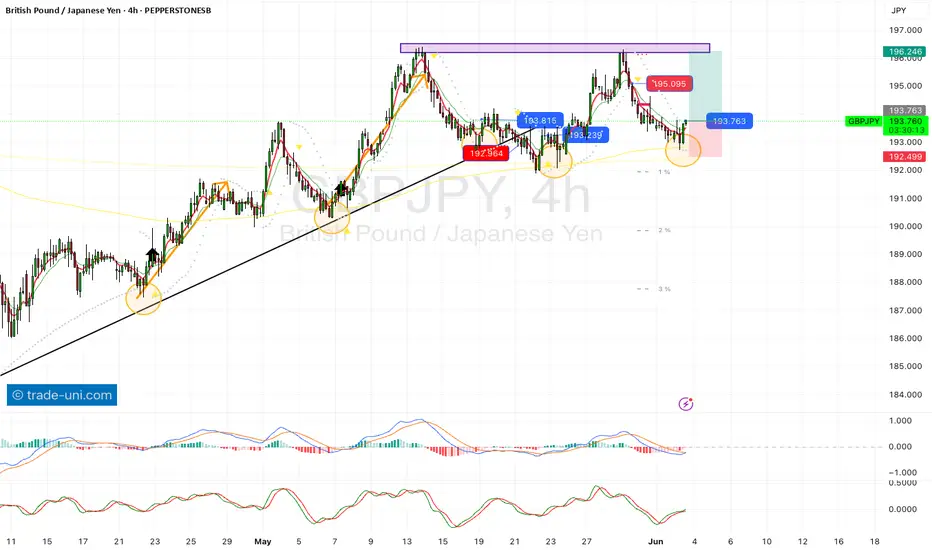
TRADE UNI - BUY GBPJPYWe duplicate a pattern that has worked before with a nice 2:1 risk/reward ratio long trade.
GBPJPY 1H Analysis – Bullish Breakout from Ending Diagonal + AO Pair: GBP/JPY
Timeframe: 1H
Structure: Wave 5 Ending Diagonal + Bullish Divergence on AO
Hi traders! Here’s an update on GBPJPY from the 1H chart.
After a strong bearish move, price formed a falling wedge (ending diagonal) pattern, indicating exhaustion in the downtrend. This pattern completed with a final Wave 5 that showed significant weakness — and here’s the key signal:
🔍 Bullish Divergence Spotted
While price made a new lower low (Wave 5), the Awesome Oscillator (AO) printed a higher low. This classic bullish divergence hints that bearish momentum is fading and a potential reversal is in play.
📈 Breakout Confirmation
Price has now broken above the wedge and the 1.0 Fibonacci level (~193.67), confirming the breakout and early bullish momentum. We’re currently seeing price pushing up with strong momentum candles.
🎯 Potential Targets Based on Fibonacci Extensions:
• 1.618 – 194.60 (first resistance / TP1)
• 2.618 – 195.35 (TP2)
• 4.236 – 196.45 (extended TP3 if trend continues)
🛑 Key Support:
• 193.00 zone – ideally price should stay above this level to maintain bullish bias.
🧠 Summary:
• Falling wedge (ending diagonal) completed as Wave 5
• AO bullish divergence signals weakening sell pressure
• Breakout confirmed above 193.70
• Watching for continuation toward 194.60 and 195.30+
📌 I’ll be watching for a potential pullback above 193.70 for a high-probability reentry opportunity. Always manage your risk and trade what you see.
Let me know your thoughts in the comments below! 📥
#GBPJPY #ForexAnalysis #PriceAction #ElliottWave #AO #Breakout #Fibonacci #TechnicalAnalysis #Wave5

LONG ON GBP/JPYGJ has given us a double bottom at a major demand level.
I am looking to catch over 100 pips on GJ to the previous high.


GJ sell signalIAM looking forward to short GJ temporary from the zone I mapped out. It's not a financial advise but base on my knowledge of market trends and liquidity. Do well to follow me.

YEN WEAKENS ON UEDA’S DOVISH CAUTION;WHILE GBPJPY SLIDES TO
During governor Kazuo Ueda’s speech on Tuesday, he emphasized that the central bank would raise interest rates once it is convinced enough that economic and price growth will re-accelerate after a period of stagnation.
He further signaled the central bank will continue to taper its huge bond buying even after an existing plan running through March expires, underscoring its resolve to stay on course for a slow but steady withdrawal of ultra-easy policy.
The Bank governor further highlighted the challenges posed by higher U.S. tariffs, which could reduce exports, hamper corporate profits, and impact wage growth and consumer sentiment. Despite headline inflation reaching 4.6% in April, above the BOJ's 2% target the central bank maintains low interest rates at 0.50%, expecting food price inflation to ease.
Ueda's remarks led to a depreciation of the yen, as markets interpreted his cautious stance as a sign that immediate rate hikes are unlikely. As at the time of writing, the yen is down by 0.08%, and the GBP by 0.14%.
TECHNICAL VIEW:
From technical perspective, GBPJPY remains in a short-term downtrend on the 2-hour chart. The pair is currently trading at 193.16 and down by 0.07% as at 02:25PM GMT+4. Meanwhile, the pair found support near 192.56, with the RSI hovering around 38.6. The emergence of a bearish hidden divergence suggests there may still be further downside potential. If the bearish momentum continues, technicians expect price to tank further with potential target around 192.56, 191.88 and then 190.86. On the flipside, a bullish rally would likely usher in potential targets around 193.86, 194.65 and 196.18 according to analysts. Break out of these levels are possible.

GBPJPY is in the Down TrendHello Traders
In This Chart GBPJPY HOURLY Forex Forecast By FOREX PLANET
today GBPJPY analysis 👆
🟢This Chart includes_ (GBPJPY market update)
🟢What is The Next Opportunity on GBPJPY Market
🟢how to Enter to the Valid Entry With Assurance Profit
This CHART is For Trader's that Want to Improve Their Technical Analysis Skills and Their Trading By Understanding How To Analyze The Market Using Multiple Timeframes and Understanding The Bigger Picture on the Charts

