My View On GBP/JPYWhy I think the tops in
Elliott Wave Structure Completed
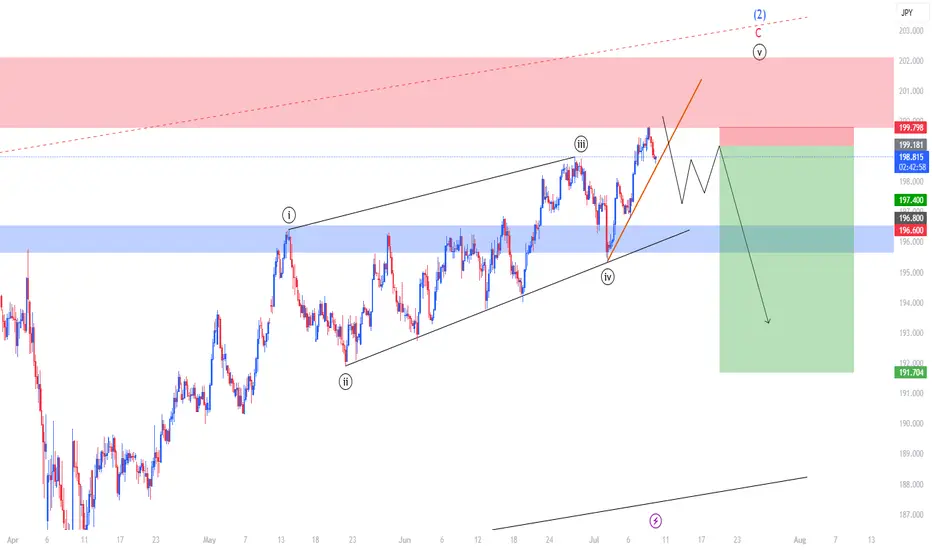
We’re now at the conclusion of a 5‑wave impulse (i→v) that tops off within wave (1), followed by an A‑B‑C corrective sequence. Wave C peaks right inside a major supply zone — classic exhaustion of bullish momentum.
Resistance & Trendline Rejection
Price hit a red supply/resistance area, tested it, and has already broken back below the short‑term upward trendline. That break is a reliable early signal that the uptrend is losing steam.
Bearish Continuation Pattern Forming
The drawn schematic suggests a sequence of lower highs is setting up—then a break toward the blue support zone near 196.60–197.40. All signs point to a deeper correction or even a fresh downtrend for wave (3).
Technical Confluence at Wave (2)
Wave (2) ends within multiple layers of resistance: a price zone, a wave count, and a rising wedge. Combined, this quadruple confluence is a textbook reversal scenario.
Macro factors support a top:
Central bank divergence is flattening
Yen may rebound on global uncertainty
Sterling faces domestic fragility
JPYGBP trade ideas
GBPJPY is in the Down Trend From Resistance LevelHello Traders
In This Chart GBPJPY HOURLY Forex Forecast By FOREX PLANET
today GBPJPY analysis 👆
🟢This Chart includes_ (GBPJPY market update)
🟢What is The Next Opportunity on GBPJPY Market
🟢how to Enter to the Valid Entry With Assurance Profit
This CHART is For Trader's that Want to Improve Their Technical Analysis Skills and Their Trading By Understanding How To Analyze The Market Using Multiple Timeframes and Understanding The Bigger Picture on the Charts

GBPJPY Ascending Channel
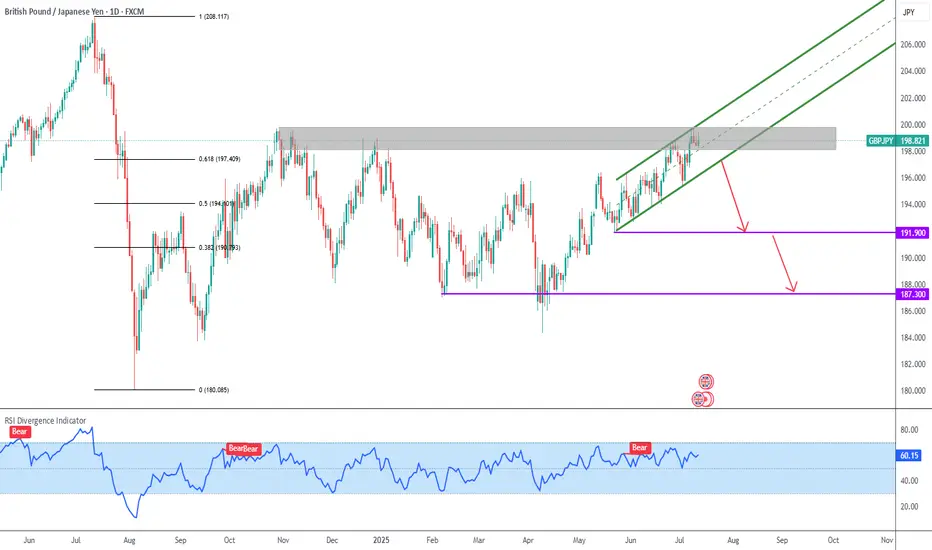
The grind to the upside is losing strength, and I´m waiting for a break of the green ascending channel to the downside.
Initial targets are the base of the ascending channel (at 191.900) and close to the recent pivot low (at 187.300)
GBP/JPY – Channel Break and Bearish Rejection
🔹 3H Chart by PULSETRADESFX
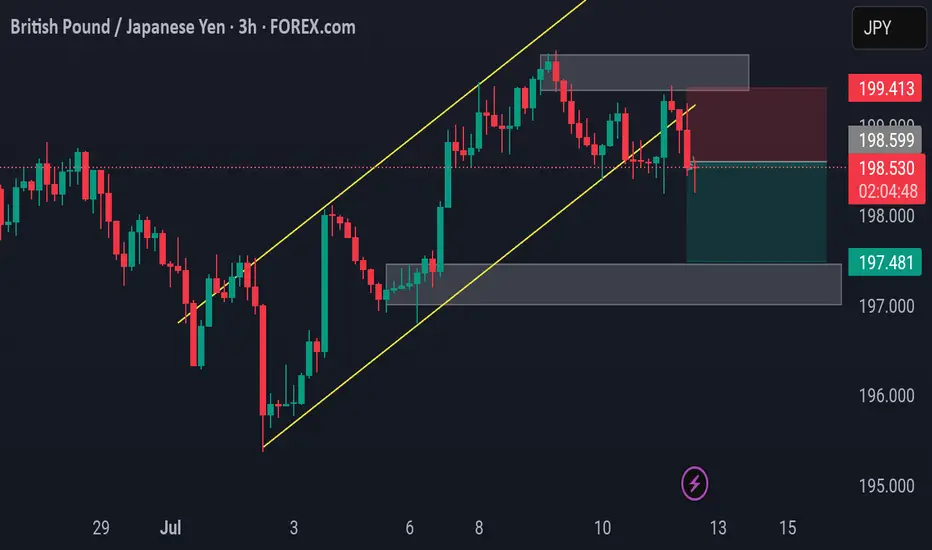
After a strong bullish trend within a rising channel, GBP/JPY has now broken structure to the downside. Price rejected the resistance zone around 198.599 – 199.413, followed by a sharp bearish candle close beneath the ascending trendline support.
This signals a shift in market sentiment, with sellers taking control and aiming for the next demand level at 197.481.
📌 Trade Breakdown:
Entry: 198.536
Stop Loss: 199.413 (Above supply)
Target: 197.481 (Major demand zone)
A classic break-retest-drop setup is in play here. Unless price reclaims 199.00+ with volume, this short bias remains valid.
---
✅ Key Confluences:
Rising channel break
Supply zone rejection
Bearish momentum confirmation
Risk-to-reward > 1:2 setup
📅 July 11, 2025
📊 Forex.com Feed via TradingView
#GBPJPY #ForexAnalysis #PriceAction #BearishSetup #SupplyZone #TechnicalAnalysis #TradingView #PULSETRADESFX
GBPJPY Forecast (4H Chart) SELL!Price rejected the 199.2 resistance and is now retesting the supply zone (~198.6). Lower highs forming, signaling potential downside continuation.
🔮 Forecast: Bearish
📍 Signal: Sell below 198.600
🎯 TP: 194.900
⛔ SL: 200.050

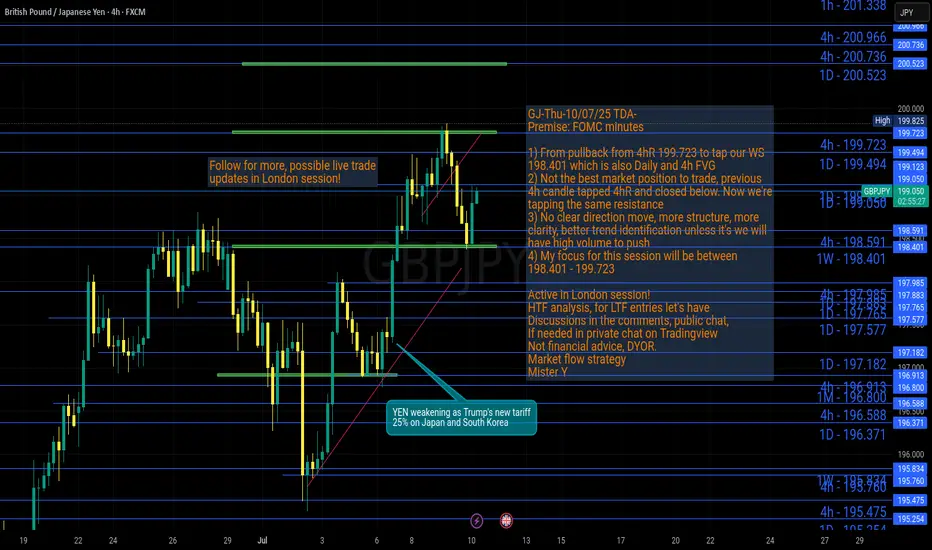
GJ-Thu-10/07/25 TDA-GJ pull back,good support created.Now what? Analysis done directly on the chart
Follow for more, possible live trades update!
I often share my live trades in Tradingview public chat in London session, stay tuned!
Houses aren't built over night, it takes brick by brick, one step at a time.
Same for trading, one step at a time. You make mistakes, you learn, you improve.
You make more mistakes, you learn more, you should improve more.
If it's easy, everyone will do it realistically.
Premise:
A simple idea plan (like Tradingview public posts) won't describe everything.
No one can predict how market will move, it's always good to react to how it moves.
It gives an idea of how price might move, but no one come from FUTURE.
So I always encourage people to openly and actively discuss in real time.
For example discussing on Tradingview public chat (and more).
I don't give signals blindly, people should learn
and understand the skill.
Following blindly signals you won't know how to
manage the trade, where precisely put sl and tp,
lot size and replicate the move over time.
That's why you need active real time discussions.
Trading is not get rich quick scheme!
Active in London session!
Not financial advice, DYOR.
Market Flow Strategy
Mister Y
GBP/JPY Rising Within Ascending Channel – Target in SightGBP/JPY is currently moving within an ascending channel, where price action is forming higher highs and higher lows. This pattern indicates a steady uptrend.
At the moment, the pair is approaching the upper boundary (resistance line) of the channel. Based on the current momentum and structure, we expect the price to continue its upward movement and test the upper trendline.
This upper line serves as our near-term target, where we may look to take profit or reassess the trade setup. As long as the price remains within the channel and respects the trendline structure, the bullish bias remains intact.

GBPJPY Profit TakingGBPJPY has given strong bullish momentum and hit swing high on previous day currently the traders are taking profit and GBPJPY is giving a pullback. We can see from the picture that there is fair value gap and demand zones. The possible move for GBPJPY will be to hit demand zones and again follow the same bullish momentum.

SHORT ON GBP/JPYGJ currently has broken a strong low of a rising wedge pattern (which is a bearish reversal pattern.
I am waiting for price to hit the supply zone before entering for a sell.
So a sell limit order will need to placed at the supply zone to take advantage of this opportunity.

GBPJPYGBPJPY price is near the major resistance zone 200.186. If the price cannot break through the 200.186 level, it is expected that the price will go down. Consider selling the red zone
🔥Trading futures, forex, CFDs and stocks carries a risk of loss.
Please consider carefully whether such trading is suitable for you.
>>GooD Luck 😊
❤️ Like and subscribe to never miss a new idea!

GBPJPY SHORT (swing)This is a trade setup based on a **Bearish Butterfly Harmonic Pattern**. The pattern meets all the key Fibonacci criteria for validity. Specifically, the AB leg retraces 80.8% of XA, which is close to the ideal 78.6% level and is considered acceptable, especially since it closed with a wick. The BC leg retraces 37.5% of AB, which is within the standard range of 38.2% to 88.6%. The CD leg extends 127% of XA, which is the minimum required for a valid Butterfly pattern, and also extends 252% of BC, which falls within the acceptable range of 161.8% to 261.8%.
What makes this setup stronger is that the Potential Reversal Zone (PRZ) at point D coincides with a **major resistance level**, adding significant technical confluence to the area. This increases the probability of a market reaction or reversal from that zone.
However, no entry will be taken immediately upon price reaching the PRZ. A trade will only be initiated **after the appearance of a confirmed reversal candlestick pattern** at or near the D point, such as a bearish engulfing.
This ensures that we enter with confirmation and not just based on pattern completion.

Another Home Run Trade? Risky & Conservative ApproachesFollowing up a MASSIVE win on the OANDA:EURJPY we may now have a similar trading opportunity setting up on the OANDA:GBPJPY
The premise is the same for this one as we're looking at a potential violation of structure followed by a Bullish continuation setup.
In this video, we'll look at where we think price can extend to, what needs to happen before we can make that prediction, and both a risky and conservative technique to get involved in the move.
Please let me know how you would approach this setup!
Akil

GBPJPY Will Fall!
HI,Traders !
#GBPJPY has retested a
Horizontal resistance level
Of 198.903 so we are
Locally bearish biased
And from the resistance we
We will be expecting a
Local bearish correction !
Comment and subscribe to help us grow !

GBPJPY: Bearish Forecast & Outlook
Looking at the chart of GBPJPY right now we are seeing some interesting price action on the lower timeframes. Thus a local move down seems to be quite likely.
Disclosure: I am part of Trade Nation's Influencer program and receive a monthly fee for using their TradingView charts in my analysis.
❤️ Please, support our work with like & comment! ❤️

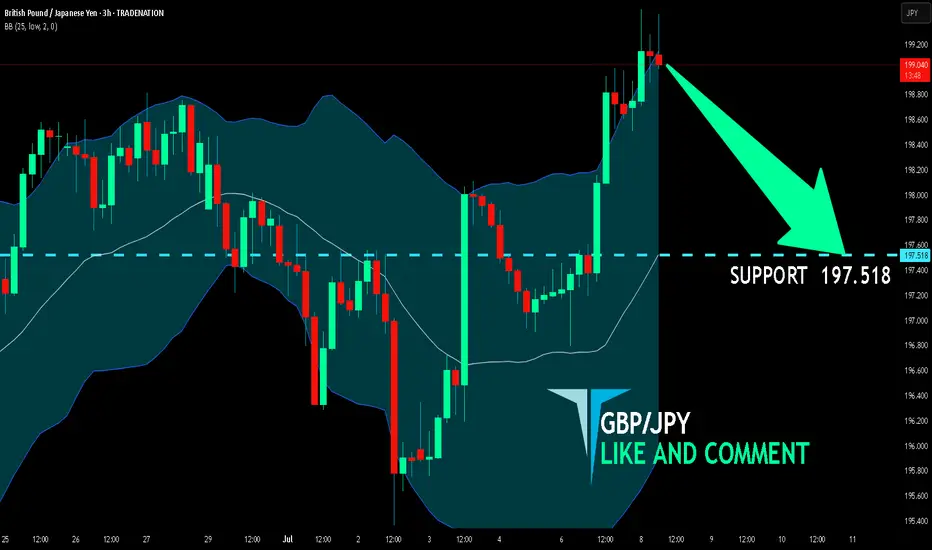
GBP/JPY SELLERS WILL DOMINATE THE MARKET|SHORT
Hello, Friends!
Previous week’s green candle means that for us the GBP/JPY pair is in the uptrend. And the current movement leg was also up but the resistance line will be hit soon and upper BB band proximity will signal an overbought condition so we will go for a counter-trend short trade with the target being at 197.518.
Disclosure: I am part of Trade Nation's Influencer program and receive a monthly fee for using their TradingView charts in my analysis.
✅LIKE AND COMMENT MY IDEAS✅
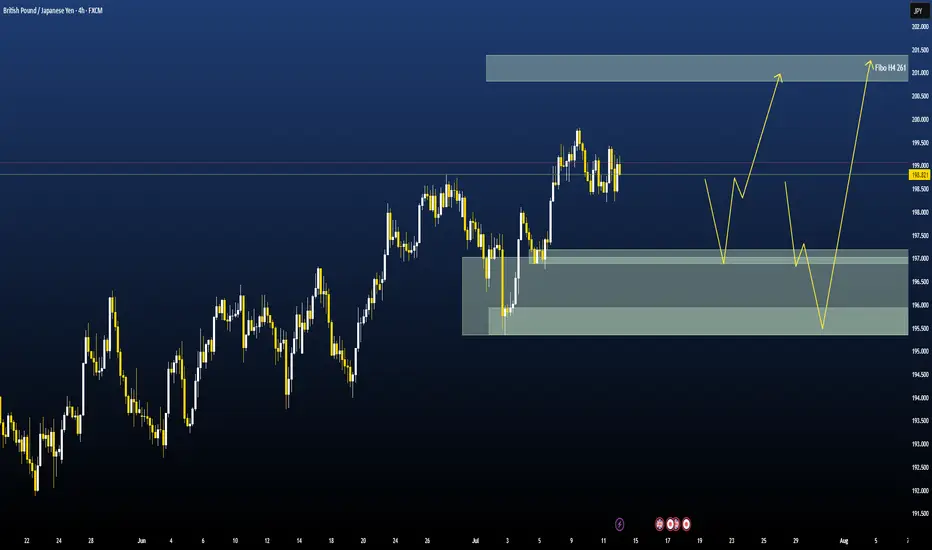
GBPJPY High Probability of a Bearish CorrectionThe trend is no doubt bullish here. But in the event that the current H1 demand is violated, there is a high probability of a retest or pullback to an H4 demand zone before the bullish trend resumes.

GJ-Wed-09/07/25 TDA-Asian push, price hit our 4hR 199.723Analysis done directly on the chart
Follow for more, possible live trades update!
I often share my live trades in Tradingview public chat in London session, stay tuned!
When you have a specific trading time during the day,
it's can be frustrating when moves happen outside of
your trading time. But remember this is part of the game,
we will never catch every single move on the chart.
Don't force the entries, learn to get used to it.
Premise:
A simple idea plan (like Tradingview public posts) won't describe everything.
No one can predict how market will move, it's always good to react to how it moves.
It gives an idea of how price might move, but no one come from FUTURE.
So I always encourage people to openly and actively discuss in real time.
For example discussing on Tradingview public chat (and more).
I don't give signals blindly, people should learn
and understand the skill.
Following blindly signals you won't know how to
manage the trade, where precisely put sl and tp,
lot size and replicate the move over time.
That's why you need active real time discussions.
Trading is not get rich quick scheme!
Active in London session!
Not financial advice, DYOR.
Market Flow Strategy
Mister Y

GBPJPY Elliott Wave AnalysisHello friends
We are witnessing the formation of a complete Elliott wave pattern on the GBPJPY chart. These waves from 1 to 5 are quite clear and you can even count their subwaves (especially the microwaves of the main wave 3). Now wave 5 is completing and moving inside an ascending channel.
At the moment, the microwaves of the 5th wave have not been completed, so we expect the price to grow within this channel. The minimum growth is up to 200.00, of course, it can grow even more.
But after the completion of the 5th wave, with the breakdown of the trend line drawn below and a return to it, we can expect the price to fall to the specified support. The first support is 196.00. Of course, the price decrease in the 5th wave is always accompanied by divergence and a decrease in the slope of the chart, as you can see that the slope of wave 5 is much lower than wave 3.
Good luck and be profitable.

GBPJPY Sweet ProfitsThe Key Levels that I shared previously for GBPJPY are drawn carefully by observing the market behavior previously. I suggest look at that key levels and plan your trades accordingly. I took the trade on the key levels I drawn. It gave me 1:2.85 . These key levels represent the behavior of the market.

BuyTrend Line Break
Previous High Break
Order Point
London Session
Previous Week High Break
Head And Shoulder Pattern

GBPJPY – Correction Pressure Is Building UpGBPJPY is still trading within a well-defined ascending channel on the H4 chart. However, recent signals suggest a potential short-term correction. The price has repeatedly rejected the upper boundary of the channel and is now forming a distribution pattern with lower highs. The FVG zone near 200.400 may act as a short-term take-profit area before price pulls back toward the support zone around 198.400, which also aligns with the lower trendline.
Additionally, the upcoming UK GDP data this week could strongly impact GBP. If the data comes in weaker than expected, downside pressure may intensify and reinforce the developing correction scenario. Traders should monitor price action around 198.400 for confirmation of the pullback.

GBPJPY sitting at resistance – Is a drop to 193.360 likely?GBPJPY is sitting right at a key daily resistance zone. This is a level where it has struggled to break through and reversed strongly to the downside. So this makes it definitely one to monitor, especially if you’re eyeing potential short setups.
If we start seeing signs that the price is getting rejected here: like long wicks, strong bearish candles, it could be the early indication of another move lower. My focus is on a moderate drop toward the 193.360 area, similar to what we’ve seen in past pullbacks. Nothing too dramatic, just a simple downside play if sellers step in again.
But if we get a strong breakout? That changes everything: it would hint that bulls are taking full control. This area is pretty important and could give us a better idea of where price is headed next.
Just sharing my thoughts on support and resistance, this isn’t financial advice. Always confirm your setups and manage your risk properly.
Disclosure: I am part of Trade Nation's Influencer program and receive a monthly fee for using their TradingView charts in my analysis.
