GBPJPY H1 I Bullish RiseBased on the H1 chart analysis, we can see that the price is falling toward our buy entry at 196.80, which is a pullback support that aligns closely with the 50% Fib retracement.
Our take profit will be at 198.09, an overlap resistance level.
The stop loss will be placed at 195.39, a swing low support.
High Risk Investment Warning
Trading Forex/CFDs on margin carries a high level of risk and may not be suitable for all investors. Leverage can work against you.
Stratos Markets Limited (tradu.com ):
CFDs are complex instruments and come with a high risk of losing money rapidly due to leverage. 63% of retail investor accounts lose money when trading CFDs with this provider. You should consider whether you understand how CFDs work and whether you can afford to take the high risk of losing your money.
Stratos Europe Ltd (tradu.com ):
CFDs are complex instruments and come with a high risk of losing money rapidly due to leverage. 63% of retail investor accounts lose money when trading CFDs with this provider. You should consider whether you understand how CFDs work and whether you can afford to take the high risk of losing your money.
Stratos Global LLC (tradu.com ):
Losses can exceed deposits.
Please be advised that the information presented on TradingView is provided to Tradu (‘Company’, ‘we’) by a third-party provider (‘TFA Global Pte Ltd’). Please be reminded that you are solely responsible for the trading decisions on your account. There is a very high degree of risk involved in trading. Any information and/or content is intended entirely for research, educational and informational purposes only and does not constitute investment or consultation advice or investment strategy. The information is not tailored to the investment needs of any specific person and therefore does not involve a consideration of any of the investment objectives, financial situation or needs of any viewer that may receive it. Kindly also note that past performance is not a reliable indicator of future results. Actual results may differ materially from those anticipated in forward-looking or past performance statements. We assume no liability as to the accuracy or completeness of any of the information and/or content provided herein and the Company cannot be held responsible for any omission, mistake nor for any loss or damage including without limitation to any loss of profit which may arise from reliance on any information supplied by TFA Global Pte Ltd.
The speaker(s) is neither an employee, agent nor representative of Tradu and is therefore acting independently. The opinions given are their own, constitute general market commentary, and do not constitute the opinion or advice of Tradu or any form of personal or investment advice. Tradu neither endorses nor guarantees offerings of third-party speakers, nor is Tradu responsible for the content, veracity or opinions of third-party speakers, presenters or participants.
JPYGBP trade ideas

GBPJPY SHORT DAILY FORECAST Q3 D4 W27 Y25GBPJPY SHORT DAILY FORECAST Q3 D4 W27 Y25
Professional Risk Managers👋
Welcome back to another FRGNT chart update📈
Diving into some Forex setups using predominantly higher time frame order blocks alongside confirmation breaks of structure.
Let’s see what price action is telling us today! 👀
💡Here are some trade confluences📝
✅Daily Order block identified
✅4H Order Block identified
✅1H Order Block identified
🔑 Remember, to participate in trading comes always with a degree of risk, therefore as professional risk managers it remains vital that we stick to our risk management plan as well as our trading strategies.
📈The rest, we leave to the balance of probabilities.
💡Fail to plan. Plan to fail.
🏆It has always been that simple.
❤️Good luck with your trading journey, I shall see you at the very top.
🎯Trade consistent, FRGNT X

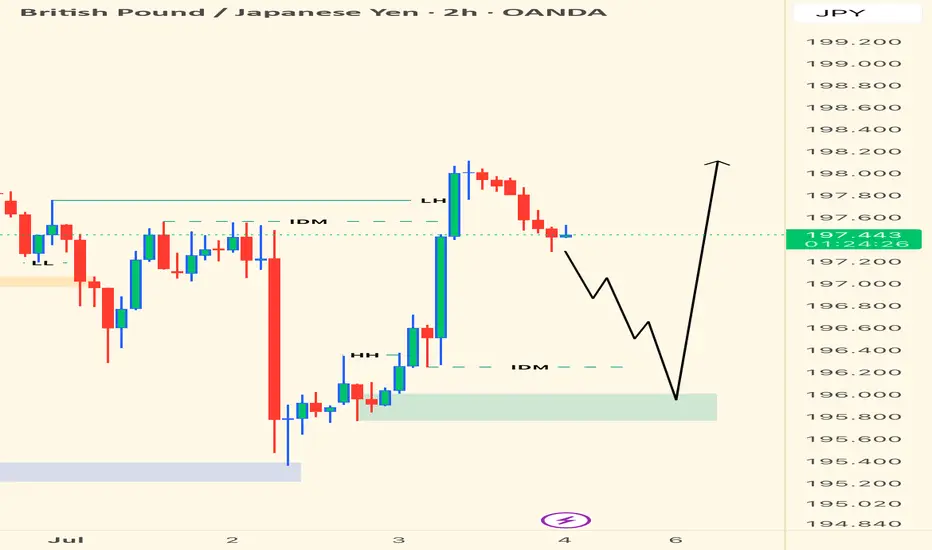
GBPJPY - Bullish Bias • Waiting to Execute from LTFPair: GBPJPY
Bias: Bullish
HTF Overview (2H): Price delivered the sweep I was patiently waiting for—textbook clean across multiple timeframes. The market has now tapped into the deeper range where real interest lies.
LTF Confirmation: All I need now is a structure shift + inducement on the 5M/1M to step in. I only move when the market shows its hand.
Entry Zone: Green zone marked on chart—expecting LTF sweep + shift before executing.
Targets: Short-term target is near the previous structure high around 198.200+.
Mindset Note: This setup has been cooking all week. Now the prep is done, I just need precision. Watching like a hawk. When it confirms—I strike.
Bless Trading!
GBPJPY Sell- Go for short term sell
- potentially go lower
- Refine entry with smaller SL for better RR, if your strategy allow
A Message To Traders:
I’ll be sharing high-quality trade setups for a period time. No bullshit, no fluff, no complicated nonsense — just real, actionable forecast the algorithm is executing. If you’re struggling with trading and desperate for better results, follow my posts closely.
Check out my previously posted setups and forecasts — you’ll be amazed by the high accuracy of the results.
"I Found the Code. I Trust the Algo. Believe Me, That’s It."

GBP/JPY) back bullish trend analysis Read The captionSMC trading point update
Technical analysis of GBP/JPY on the 2-hour timeframe, signaling a potential rally from a key support area. Here’s a breakdown of this analysis:
---
Technical Breakdown
1. Key Support Zone (Yellow Box):
Price has pulled back to a strong support level around 196.50–197.00.
This level previously acted as resistance and now flipped to support (classic support-resistance flip), marked by the green arrow.
2. EMA 200 as Dynamic Support:
The 200 EMA (~196.567) is just below the support zone, reinforcing the likelihood of a bullish bounce from this area.
3. Bullish Price Projection:
The chart suggests a bounce off this support zone with a projected move toward the target point at 200.132, indicating a +1.71% upside.
4. RSI Indicator (14):
RSI is at 43.47, approaching the oversold region but curving upward — supporting a potential reversal to the upside.
---
Forecasted Move
Expected Move: Bullish reversal from support, targeting 200.132.
The chart outlines a potential entry at current levels, with a bounce confirmed by price respecting the yellow support zone.
Mr SMC Trading point
---
Trading Idea Summary
Bias: Bullish
Entry Zone: Around 196.50–197.00
Stop-Loss: Below support zone (~196.00 or lower)
Take-Profit: 200.132
Confirmation: Bullish candlestick pattern or RSI crossover
plesse support boost 🚀 this analysis

GJ Potentially BearishHi there,
We take another look at GJ. I see an ascending channel pattern with GBP/JPY trading within parallel trendlines. The pair respected both the upper and lower boundaries of this bullish channel, with the current price action showing consolidation near the upper resistance around 198.20 levels.
🎙️ **Key Support and Resistance Levels**
We have critical levels at the time of this writing as following:
- **Immediate Support**: 197.30 (61.8% Fibonacci retracement level) and 196.434 (38.2% Fibonacci retracement)
- **Major Support**: 194.0 37 representing the main channel support
- **Resistance**: 198.80 acting as the primary obstacle.
- **Extended Target**: 199.55 as the next potential bullish objective
**Wave Structure Analysis**
We have ABC wave pattern, with the pair seeming to have completed a Wave (C) bullish rally and now forming a temporary retracement. The current consolidation suggests the pair is "catching its breath" before a breakout.
## 🎲 Some Fundamental Highlights Appealing to Bullish Bias:
**1. Bank of England's Cautious Easing Stance**
BoE Governor Bailey has signaled a "gradual and careful" approach to monetary policy, pointing to sticky inflation concerns while acknowledging a softening labor market with over 100,000 fewer payrolled workers in May. This measured approach is keeping the British Pound supported near year-to-date highs.
**2. Bank of Japan's Divided Policy Response**
The BoJ remains cautious despite rising inflationary pressures, with Governor Ueda maintaining a data-dependent approach. While hawkish board member Naoki Tamura suggests "decisive" rate hikes may be needed, the central bank's measured pace at just 0.5% rates keeps the Yen defensive against stronger currencies.
**3. Inflation Dynamics Favoring GBP**
Japan's Consumer Price Index has surged due to higher food and energy costs, yet the BoJ's hesitant response contrasts with the BoE's more proactive stance on inflation management. This divergence in central bank responses to inflation is supporting GBP strength against the Yen.
**4. Upcoming Japanese Economic Data Releases**
Key Japanese economic indicators are scheduled for release, including June Tokyo CPI, May Unemployment Rate, and Retail Trade data. These releases could provide clarity on the BoJ's future policy direction and potentially impact the Yen's performance against the Pound.
Happy Trading,
K.
Not trading advice.

skraaaaaa!check my previous post and you will see the before of this trade and a comprehensive explanation of my bias and analysis knowledge truly is power want learn SMC concept reach out to me and get a comprehensive understanding today

GBPJPY BUY SetupI'm expecting a reversal to the up side when price gets to my POI. Make sure to make your own research and apply a proper risk management

GBPJPY SHORT DAILY FORECAST Q3 D2 W27 Y25GBPJPY SHORT DAILY FORECAST Q3 D2 W27 Y25
Professional Risk Managers👋
Welcome back to another FRGNT chart update📈
Diving into some Forex setups using predominantly higher time frame order blocks alongside confirmation breaks of structure.
Let’s see what price action is telling us today! 👀
💡Here are some trade confluences📝
✅Daily Order block identified
✅4H Order Block identified
✅1H Order Block identified
🔑 Remember, to participate in trading comes always with a degree of risk, therefore as professional risk managers it remains vital that we stick to our risk management plan as well as our trading strategies.
📈The rest, we leave to the balance of probabilities.
💡Fail to plan. Plan to fail.
🏆It has always been that simple.
❤️Good luck with your trading journey, I shall see you at the very top.
🎯Trade consistent, FRGNT X

GJ idea - could all YEN pairs head down?We're looking at GJ apart of me is wanting to execute but then the A+ TRADER wants me to wait for a proper break to the downside. We see price down trending, creating LL's & LH's, now we just wait for price to break our CTL. We also see multiple bearish engulfings. Feeling good about this let's scale in lightly.

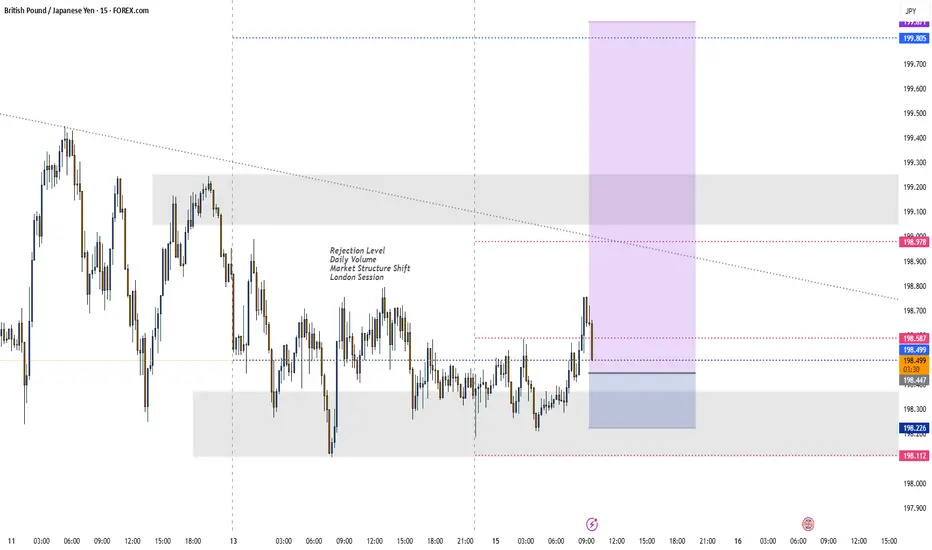
GBP/JPY Shifts to Bearish Trend – Key Levels to MonitorGBP/JPY Shifts to Bearish Trend – Key Levels to Monitor
The GBP/JPY pair has entered a confirmed bearish trend structure, with the formation of a lower low signaling increasing selling pressure. This technical development suggests the currency pair may continue its downward trajectory in upcoming trading sessions, presenting potential shorting opportunities for traders.
Bearish Confirmation
The recent lower low formation serves as a classic technical confirmation of bearish momentum. This pattern indicates sellers are successfully pushing prices below previous support levels, establishing a new downward trajectory. The breakdown follows what appears to be exhaustion of the prior bullish trend, with bears now taking control of market direction.
Downside Targets
The pair now eyes potential support levels at:
- 196.300 (immediate target)
- 194.300 (secondary objective)
These levels may provide temporary support, but a decisive break below could accelerate the decline. Traders should watch for potential bearish continuation patterns or reversal signals around these zones.
Key Resistance
The 198.900 level now stands as critical resistance. Any corrective rallies toward this zone:
- May attract fresh selling pressure
- Could offer potential short entry opportunities
- Would need to be decisively broken to invalidate the bearish outlook
Market Considerations
Several factors could influence GBP/JPY's movement:
- Bank of England vs. Bank of Japan policy divergence
- Risk sentiment in global markets
- UK economic data releases
Trading Strategy
With the bearish structure confirmed, traders might consider:
- Short positions on rallies toward resistance
- Tight stop-losses above 198.900
- Profit-taking near support levels
The bearish outlook remains valid unless price reclaims and sustains above the 198.900 resistance level. As always, proper risk management is essential when trading this volatile currency pair.

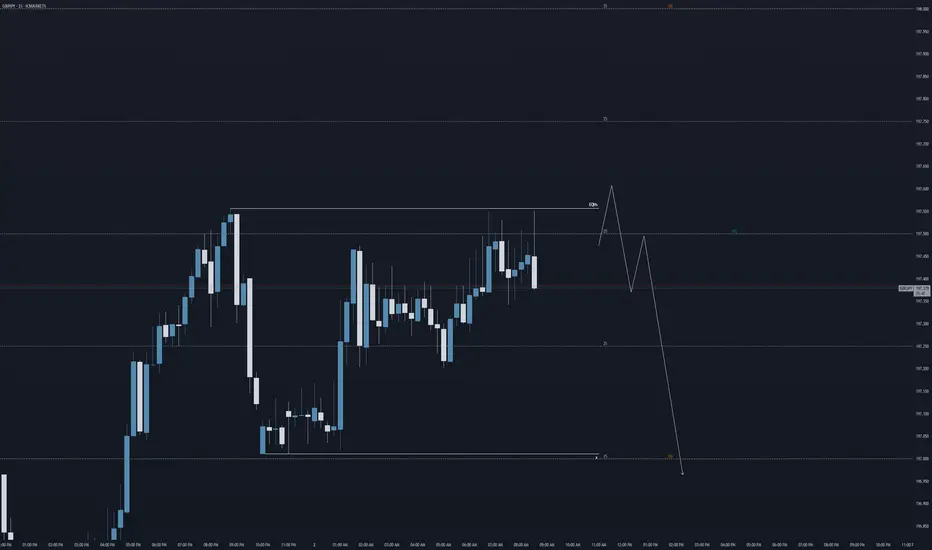
GJ: 50 pip bear leg forecastHi everyone,
I'm forecasting a 50 pip bearish leg on GBPJPY from 197.5 down to 197.0
Looking at price to sweep the highs first (liquidity sweep), before then waiting for the right confirmations to take it lower... IF the price says so.
Kind regards,
Aman | SMC Wolf FX
1-1 student onboarding is currently open (website in my signature & profile)
TCB Checklist Score: 95%🧠 TCB Strategy Breakdown:
This is a textbook example of a TCB Flow setup:
🔹 Trend Phase
The market had been in a strong bullish trend leading into the end of June, topping near 198.800. That bullish impulse set the directional context — the market is overall bullish on the higher timeframe.
Even though price pulled back from those highs, no structural break to the downside occurred. So we still treat the overall flow as bullish.
🔹 Countertrend Phase
From the highs, price began a clean descending channel — the typical correction we look for. It wasn’t random chop — it had defined boundaries, touchpoints, and aligned with the psychology of a cooling market before the next push.
The countertrend ended with a false breakdown below 197.00, quickly rejecting off the 196.850 support zone. That created the final “spring” setup to trap early sellers.
🔹 Breakout Phase
We then get the breakout — price slices through the countertrend channel and closes strongly above it, just above 197.350–197.500 — which also acted as an earlier support–turned–resistance zone. That dual confluence makes this breakout high probability.
The best part? After the breakout, price dipped back into the zone, gave a clean retest wick, and showed bullish rejection — our TCB-style entry trigger.
🧭 Why This Trade Stands Out:
✅ Structure is clear — trend, pullback, breakout all line up visually
✅ No conflicting zones — clean path to TP (198.627)
✅ Risk–Reward solid — SL below last reaction low, TP back to major resistance
✅ Session timing — breakout happening around NY session, ideal for momentum
Clean TCB structure unfolding:
🔹 Trend Phase: Bullish move into 198.800 zone
🔹 Countertrend: Descending channel formed from highs
🔹 Breakout: Price broke above the countertrend channel with confluence at 197.35–197.50 support
✅ TCB Checklist Score: 95%
🎯 Entry: 197.50
🛡️ SL: 196.95
🏁 TP: 198.627
📈 R-Multiple: Projected 2.25R
NY session momentum could push this clean breakout toward target.
Trade the Flow. Master the Market – #TCBFlow

Can the pound-yen maintain its uptrend?Fundamental:
BoE Governor Bailey signaled potential rate cuts ahead, with markets expecting a 0.25% rate cut in Aug. Political uncertainty persists as UK PM Starmer scaled back on welfare reforms amid a party rebellion, adding to fiscal caution. Trade tensions intensified as US President Trump threatened new tariffs on Japan and demanded greater agricultural access.
Technicals:
GBPJPY retreated from recent highs following a break above the ascending channel's upper bound. If GBPJPY rebounds from the support at 196.50, the price could extend its rally to the psychological resistance at 200.00. Conversely, a break below 196.50 could prompt a decline to the following support at 193.80.
By Li Xing Gan, Financial Markets Strategist Consultant to Exness

GBP/JPY Best Place To Buy Very Clear , Let`s Get This 200 Pips !Here is my 4H T.F Chart and if we check we will see that we have a very good support area very near the price now and we have already a good breakout and the price never retest the broken res and new supp so i`m waiting the price to retest it and give me any bullish price action and then we can buy it and targeting from 100 to 200 pips . and if we have a daily closure below my support then this idea will not be valid .

GBPJPY is in the Down Trend From Resistance LevelHello Traders
In This Chart GBPJPY HOURLY Forex Forecast By FOREX PLANET
today GBPJPY analysis 👆
🟢This Chart includes_ (GBPJPY market update)
🟢What is The Next Opportunity on GBPJPY Market
🟢how to Enter to the Valid Entry With Assurance Profit
This CHART is For Trader's that Want to Improve Their Technical Analysis Skills and Their Trading By Understanding How To Analyze The Market Using Multiple Timeframes and Understanding The Bigger Picture on the Charts

GBPJPY Technical Outlook – July 15, 2025Looking for Impulse up!
GBPJPY has broken out of a classic bullish flag pattern on the 4H chart, signaling a potential continuation of the recent upside momentum. The breakout follows a strong impulse move from the 197.50 area, followed by a brief descending consolidation. Price has now closed above the flag structure, suggesting buyers are regaining control. A short pullback toward the breakout zone is possible before further upside toward the buy-side liquidity near 201.000. Equal highs are also resting just below this level, providing additional confluence for the upside target. As long as price holds above the 198.50–198.80 support area, the bullish outlook remains intact.
This analysis is intended for educational purposes only.
Learn & Earn!
Wave Trader Pro

7.15 GBP/JPY LIVE TRADE UPDATEThis is day 3 on this trade. Classic 123 pullback into S/R followed by an engulfing candle, there was a signal on the chart earlier but volume/momentum did not line up so we waited for all indicators to align before hitting the "go" button. We always wait for a new high/low before considering price action as being in a true pullback. We also use the volume indicator alot and rely heavily on it, volume shows the interest this pair has atm. We will keep watching, it should have plenty of room to hit our 2:1 R/R target. What target do you normally go for?

GBPJPY Will Grow! Buy!
Here is our detailed technical review for GBPJPY.
Time Frame: 1D
Current Trend: Bullish
Sentiment: Oversold (based on 7-period RSI)
Forecast: Bullish
The market is trading around a solid horizontal structure 198.531.
The above observations make me that the market will inevitably achieve 202.938 level.
P.S
The term oversold refers to a condition where an asset has traded lower in price and has the potential for a price bounce.
Overbought refers to market scenarios where the instrument is traded considerably higher than its fair value. Overvaluation is caused by market sentiments when there is positive news.
Disclosure: I am part of Trade Nation's Influencer program and receive a monthly fee for using their TradingView charts in my analysis.
Like and subscribe and comment my ideas if you enjoy them!


Falling Wedge Formation Ive been bullish on GBPJPY for a couple weeks now and I still believe that it has more upside potential. Here we have a Falling Wedge Formation. we have 4 touches on our pattern already and just waiting for a break and retest to enter again. I am currently in a position based of the retest price gave of the previous resistance (circled on chart). Lets see how it goes.

GBPJPY CONTINUATIONTechnically:
Printing bullish flag
Retrace from 0.382 fib level.
Retest the resistance which became support.
Scenario 1 is based on support became resistance
Scenario 2 based on bullish flag breakout of pole
