JPYGBP trade ideas

GJ Bullish Shift After Daily FVG MitigationHello Traders,
Hope everyone is having a fantastic week!
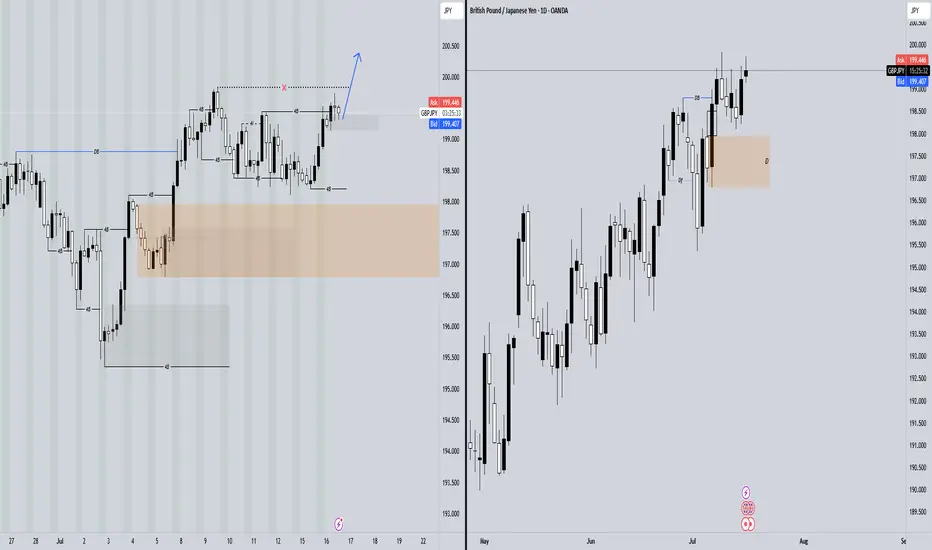
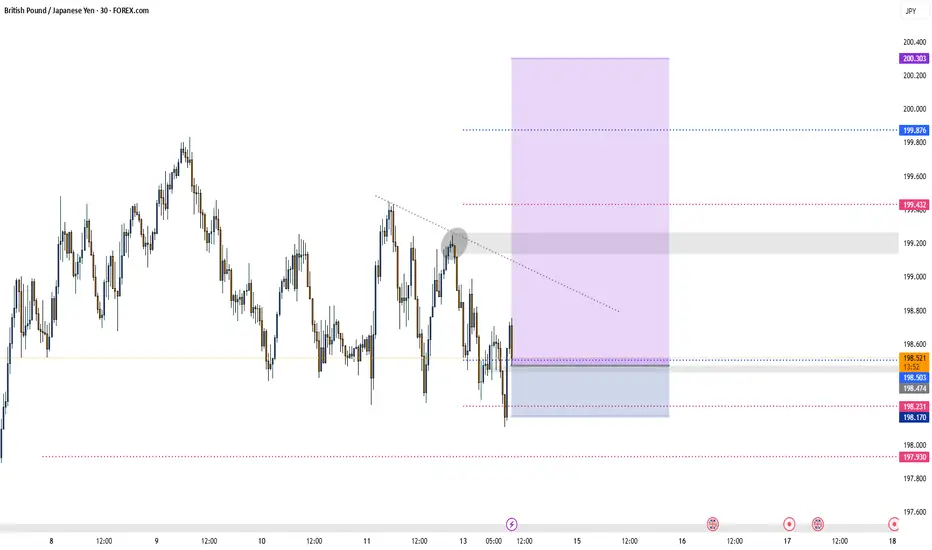
Today on GBPJPY, price has shifted the 4-hour swing structure to bullish following the mitigation of the daily Fair Value Gap (FVG)—a strong sign of a change in character (CHoCH). From this point, price may aim for the daily weak buy-side liquidity (BSL). Use your lower time frames (LTF) to identify bullish patterns that support this long trade setup.
7.15 GBP/JPY LIVE TRADE UPDATEThis is day 3 on this trade. Classic 123 pullback into S/R followed by an engulfing candle, there was a signal on the chart earlier but volume/momentum did not line up so we waited for all indicators to align before hitting the "go" button. We always wait for a new high/low before considering price action as being in a true pullback. We also use the volume indicator alot and rely heavily on it, volume shows the interest this pair has atm. We will keep watching, it should have plenty of room to hit our 2:1 R/R target. What target do you normally go for?


Falling Wedge Formation Ive been bullish on GBPJPY for a couple weeks now and I still believe that it has more upside potential. Here we have a Falling Wedge Formation. we have 4 touches on our pattern already and just waiting for a break and retest to enter again. I am currently in a position based of the retest price gave of the previous resistance (circled on chart). Lets see how it goes.

GBPJPY CONTINUATIONTechnically:
Printing bullish flag
Retrace from 0.382 fib level.
Retest the resistance which became support.
Scenario 1 is based on support became resistance
Scenario 2 based on bullish flag breakout of pole

GBPJPY (SHORT)
GBPJPY broker the trendline and went to resistance level.
Jpy has been weak for 6months (1st half of year) now it will gain strength and jpy pairs to sell.
WHY: It summer holidays so tourist are traveling to Japan strengthening it currency Value.

GBPJPY: Downside Pressure Increasing - Sell Opportunity!GBPJPY is showing clear signs of weakness, currently trading around 198.620. If it breaks and holds below 198.300, the bearish trend will be confirmed, with the next potential target at 192.000.
Upcoming key economic news from the UK (inflation, retail sales) and Japan (BOJ policy) will be decisive. Prioritize selling strategies, monitor news closely, and manage risk tightly.
GBPJPY AccumulatingGBPJPY is building liquidity. We can see it around these zones. So trading between the zones will be wonderful. We can not say anything about the direction of GBPJPY right now because it is oscillating between the zones. The clear picture can be trade zones for scalping. No any potential move seen here.

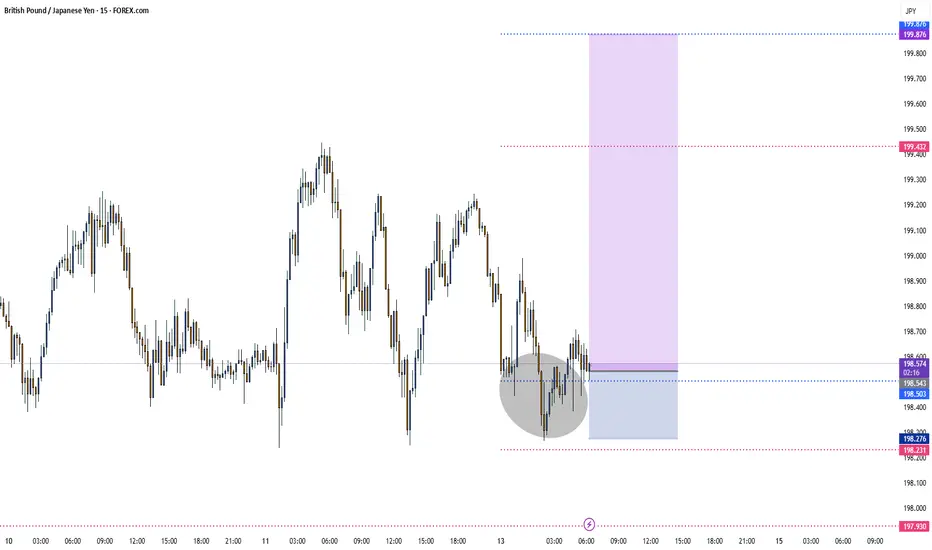
GBP/JPY is currently trading around 198.384, presenting a potentGBP/JPY is currently trading around 198.384, presenting a potential buy opportunity.
2. The immediate buy zone lies between 198.200 – 198.400, offering a favorable risk-reward entry.
3. First resistance is observed at 199.000, which could act as a near-term profit target.
4. A stronger resistance zone sits at 199.500, representing the next bullish hurdle.
5. A key breakout confirmation will be seen if price pushes above 199.800, signaling bullish continuation.
Place your stop-loss below 197.500, as a break below this level would invalidate the bullish setup.
7. The current setup suggests buyers are stepping in near 198.300, respecting the recent support base.
8. Momentum may build up toward 199.00+ if GBP remains strong or JPY weakens further.
9. Price consolidation above 198.50 would strengthen bullish conviction ahead of the breakout zone.
10. Overall, GBP/JPY remains bullish above 197.500, with upside potential toward 199.800 in the short term.


GBPJPY SELLView live British Pound / Japanese Yen chart to track latest price changes. Trade ideas, forecasts and market news are at your disposal as well.

gbpjpy long Hi, I am a bit late but the probabilities are long because the daily trend is bullish and also in a good zone to buy on the level on the image ,of course you need to enter only after your entry pattern has been formed

GBPJPY Swing Trade Setup, Sell, Short SetupA Good RR setup, wait for the entry, when price reaches the poi, look for any weakness ltf and then take trade, we are taking trade on 1hr, so for entry look for 5m tf. I will update the trade status where to take or not!

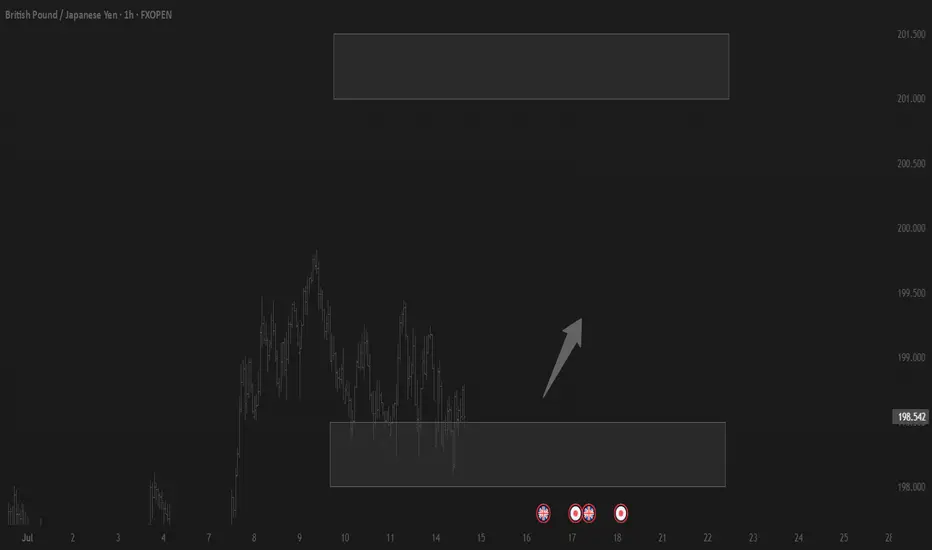
Trading balanceTrading balance The price of the asset has rebounded from the balance zone. With the prospect of growth into the resistance zone.
GBPJPY long Idea In HTF we can clearly see that GJ is in an uptrend, so after having done the last expansion, I am waiting for the retracement to the 50% Fibo zone where by coincidence there is an OB, the price will probably reject in that zone and later "attracted" by the OB which has a FVG in the 70.5% Fibo zone (which I call the "Gold Zone"), the price can retract to that zone and then continue with its uptrend.

GBPJPY SellThis currency pair is in a clear downtrend. The best idea is to sell at the moment of hitting the downtrend line.

BUYTrend Line Break
Previous Day Volume
Rejection Point
Untapped Order Point
Asian Session
High Structure Swing
GJ Counter Pullback Likely to Daily DemandHello Traders,
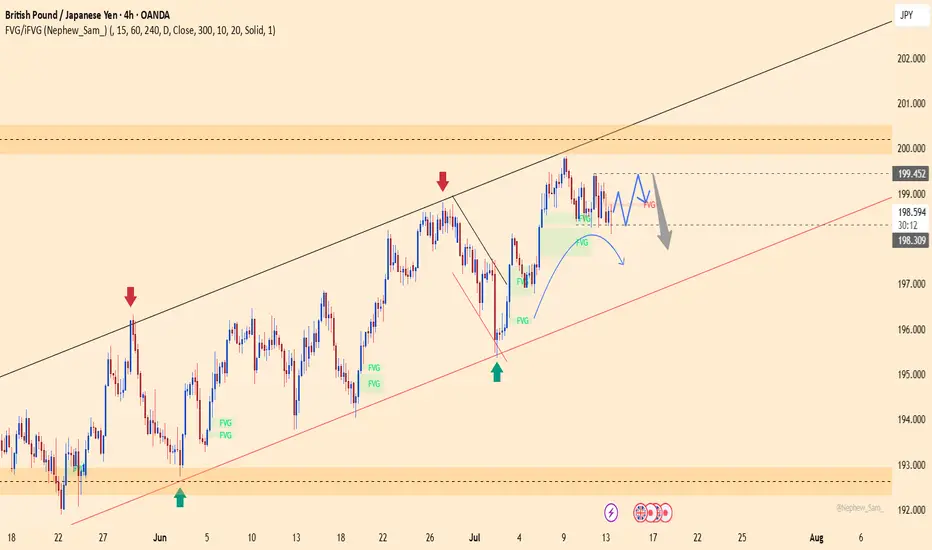
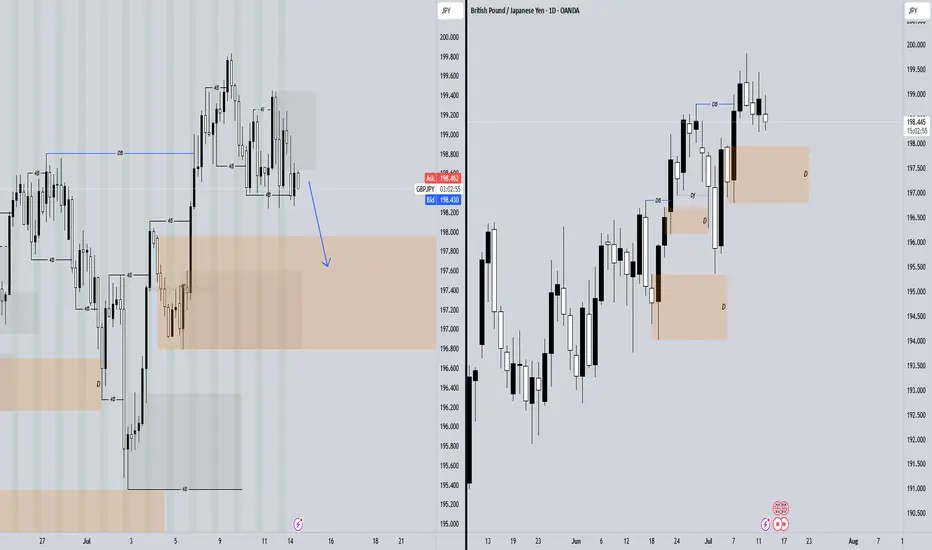
On GJ, price remains in a daily counter-trend pullback phase. This has just been confirmed by a 4-hour break and close below the weak swing low (LL). To stay aligned with the overall bullish trend, I’m expecting a deeper pullback into the daily demand zone before price resumes its upward movement.
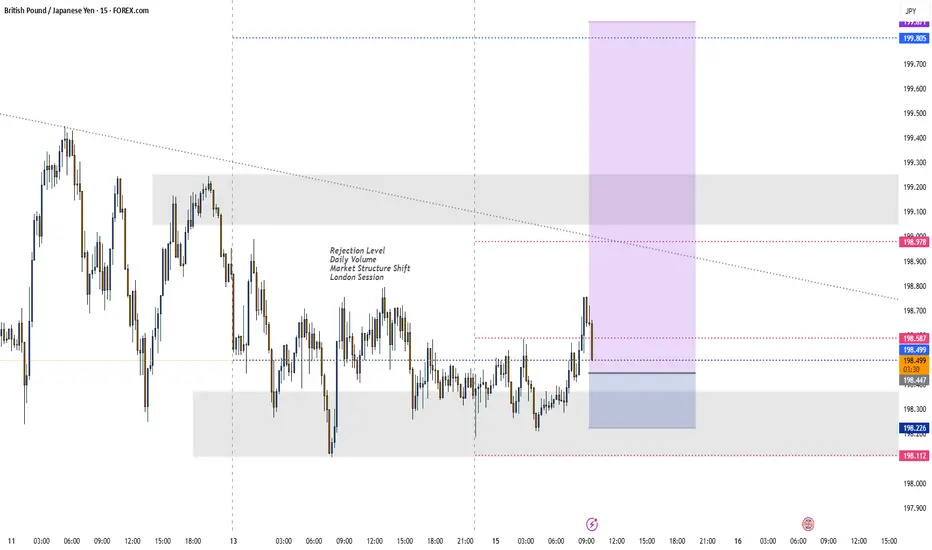
BUYTrend Line Break
Previous Day Volume
Rejection Point
Untapped Order Point
London Session
High Structure Swing
Gbpjpy long outlookReviewing past price moevembt . Looks like support is holding and can potentially break out of reisistance area and contour moving foaled. Still early… what do you guys think?

BUYTrend Line Break
Previous Day Volume
Rejection Point
Untapped Order Point
Asian Session
High Structure Swing
