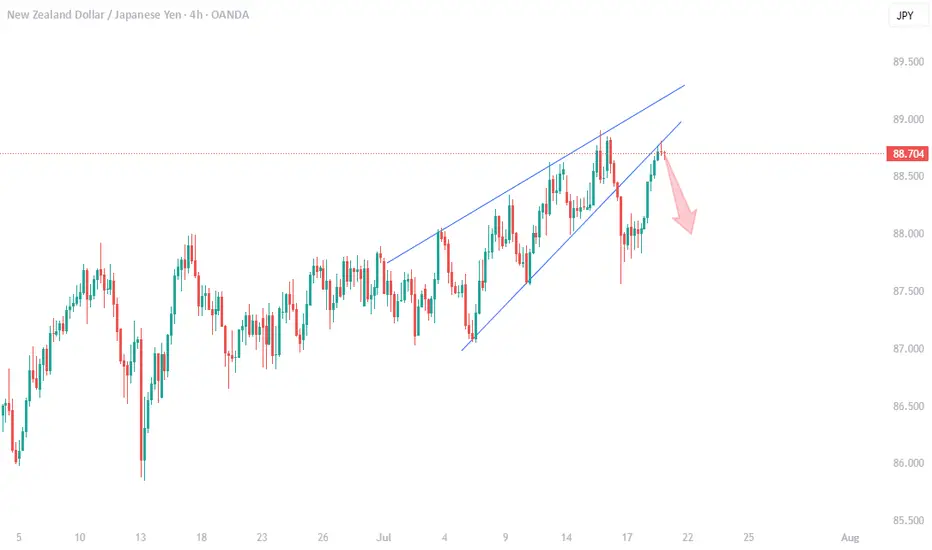
NZDJPY Massive sell coming up ahead.Theres a high probability of a sell on NZDJPY after the retest on H4
Related currencies
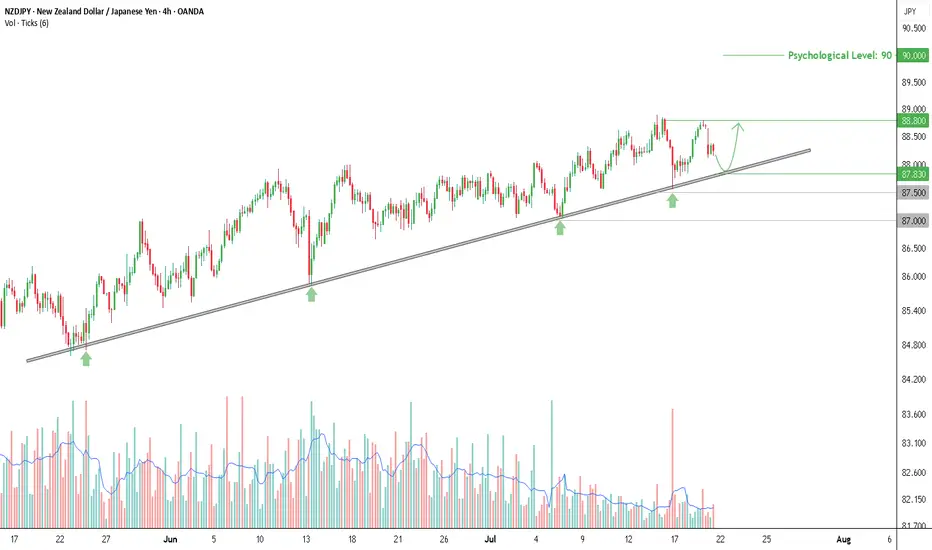
NZD_JPY RISING SUPPORT AHEAD|LONG|
✅NZD_JPY went down from
The resistance just as I predicted
In my previous analysis but now
The pair is approaching a rising
Support line from where we will
Be expecting a local bullish rebound
LONG🚀
✅Like and subscribe to never miss a new idea!✅
Disclosure: I am part of Trade Nation's Inf

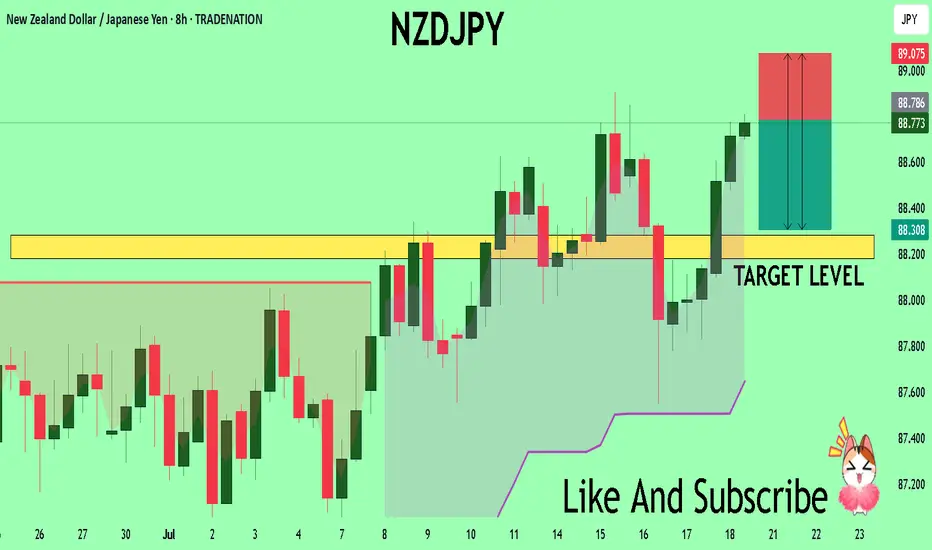
NZDJPY: Long Trade Explained
NZDJPY
- Classic bullish setup
- Our team expects bullish continuation
SUGGESTED TRADE:
Swing Trade
Long NZDJPY
Entry Point - 87.616
Stop Loss - 87.361
Take Profit - 88.064
Our Risk - 1%
Start protection of your profits from lower levels
Disclosure: I am part of Trade Nation's Influenc

Buy Opportunity on NZDJPY, Testing Trendline with Rising VolumeThe NZDJPY chart on the 4-hour timeframe shows a consistent uptrend pattern, supported by a well-respected ascending trendline that has been tested multiple times since late May 2025. Rebounds from this trendline are marked by green arrows on the chart, indicating a strong reaction zone. Each time p

NZD_JPY SHORT FROM RESISTANCE|
✅NZD_JPY is going up now
But a strong resistance level is ahead at 88.900
Thus I am expecting a pullback
And a move down towards the target of 88.572
SHORT🔥
✅Like and subscribe to never miss a new idea!✅
Disclosure: I am part of Trade Nation's Influencer program and receive a monthly fee

NZD_JPY PULLBACK EXPECTED|SHORT|
✅NZD_JPY has been growing recently
And the pair seems locally overbought
So as the pair has approached
A horizontal resistance of 88.900
Price fall is to be expected
SHORT🔥
✅Like and subscribe to never miss a new idea!✅
Disclosure: I am part of Trade Nation's Influencer program and rec

NZD-JPY Resistance Ahead! Sell!
Hello,Traders!
NZD-JPY is trading in an
Uptrend but the pair is locally
Overbought so after the pair
Hits the horizontal resistance
Level of 88.900 we will be
Expecting a local bearish
Move down
Sell!
Comment and subscribe to help us grow!
Check out other forecasts below too!
Disclosure:

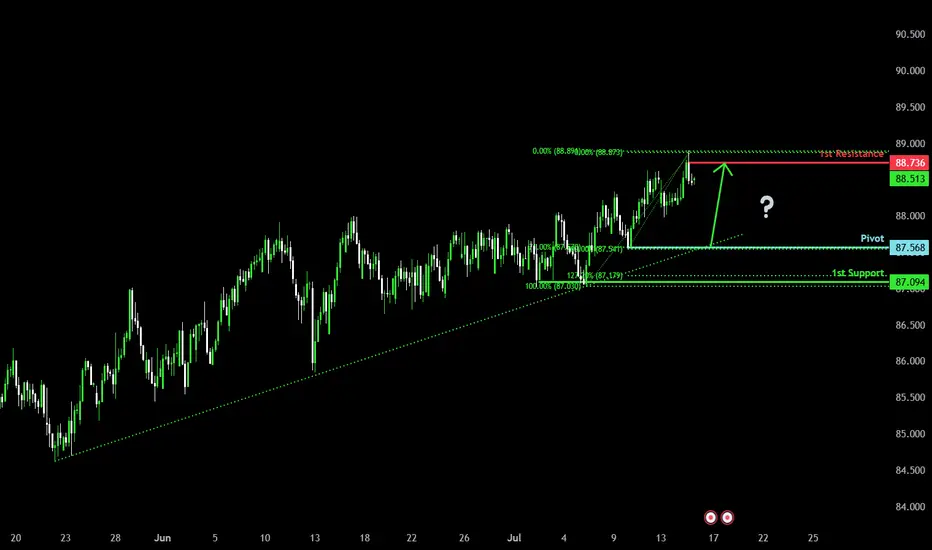
Bullish momentum to extend?NZD/JPY is falling towards the pivot and could bounce to the 1st resistance.
Pivot: 87.56
1st Support: 87.09
1st Resistance: 88.73
Risk Warning:
Trading Forex and CFDs carries a high level of risk to your capital and you should only trade with money you can afford to lose. Trading Forex and CFDs
NZDJPY Set To Fall! SELL!
My dear subscribers,
My technical analysis for NZDJPY is below:
The price is coiling around a solid key level - 88.786
Bias - Bearish
Technical Indicators: Pivot Points Low anticipates a potential price reversal.
Super trend shows a clear sell, giving a perfect indicators' convergence.
Goal -
See all ideas
Summarizing what the indicators are suggesting.
Oscillators
Neutral
SellBuy
Strong sellStrong buy
Strong sellSellNeutralBuyStrong buy
Oscillators
Neutral
SellBuy
Strong sellStrong buy
Strong sellSellNeutralBuyStrong buy
Summary
Neutral
SellBuy
Strong sellStrong buy
Strong sellSellNeutralBuyStrong buy
Summary
Neutral
SellBuy
Strong sellStrong buy
Strong sellSellNeutralBuyStrong buy
Summary
Neutral
SellBuy
Strong sellStrong buy
Strong sellSellNeutralBuyStrong buy
Moving Averages
Neutral
SellBuy
Strong sellStrong buy
Strong sellSellNeutralBuyStrong buy
Moving Averages
Neutral
SellBuy
Strong sellStrong buy
Strong sellSellNeutralBuyStrong buy
Displays a symbol's price movements over previous years to identify recurring trends.
Frequently Asked Questions
The current rate of JPYNZD is 0.011253 NZD — it has decreased by −0.17% in the past 24 hours. See more of JPYNZD rate dynamics on the detailed chart.
The value of the JPYNZD pair is quoted as 1 JPY per x NZD. For example, if the pair is trading at 1.50, it means it takes 1.5 NZD to buy 1 JPY.
The term volatility describes the risk related to the changes in an asset's value. JPYNZD has the volatility rating of 0.36%. Track all currencies' changes with our live Forex Heatmap and prepare for markets volatility.
The JPYNZD showed a −0.81% fall over the past week, the month change is a −1.32% fall, and over the last year it has increased by 2.03%. Track live rate changes on the JPYNZD chart.
Learn how you can make money on rate changes in numerous trading ideas created by our community.
Learn how you can make money on rate changes in numerous trading ideas created by our community.
JPYNZD is a minor currency pair, i.e. a popular pair that is not associated with USD. Such pairs are also called cross currency pairs.
Currencies are usually traded through forex brokers — choose the one that suits your needs and go ahead. You can trade JPYNZD right from TradingView charts — just log in to you broker account. Check out the list of our integrated brokers and find the best one for your needs and strategy.
When deciding to buy or sell currency one should keep in mind many factors including current geopolitical situation, interest rates, and other. But before plunging into a deep research, you can start with JPYNZD technical analysis. The technical rating for the pair is sell today, but don't forget that markets can be very unstable, so don't stop here. According to our 1 week rating the JPYNZD shows the sell signal, and 1 month rating is sell. See more of JPYNZD technicals for a more comprehensive analysis.