NZDJPY ShortThe Previuos Day Low has been taken out. In this regards the Sell side liquidity has been taken our. Waiting for the pair to rest the Fair value gap in order to continue selling.
JPYNZD trade ideas

NZDJPY ENTRY TRADEOn this Pair, we are anticipating for a BUY REVERSAL, as the JPY has shown us an indication for a WEAKNESS, also on the NZDJPY, price is around a strong DEMAND+ we have a STRONG NEW ZEALAND DOLLAR, we also have a confluence on the LTF as a back-up to the entry trade + a liquid sweep,so if this matches with your Trade Idea, you can join us. Thank You, Update will be given in the UPDATE session.


NZDJPY - BullishBased on the fundamentals, buy side is recommended with proper stoploss.
Fundamental bases are:
Sesonality
Dec 3 - Dec 15 Buy
LEI
Increasing
COTRSI
COT RSI data is mix
Endogenous & Exegenous
Endogenous are stronger of JPY but exogenous factors of NZD are more strongger crearing
buy side bias
Conclusion
All the above factors creating NZDJPY buying side trade
Trade Based
Follow Dow Theory base HH and HL

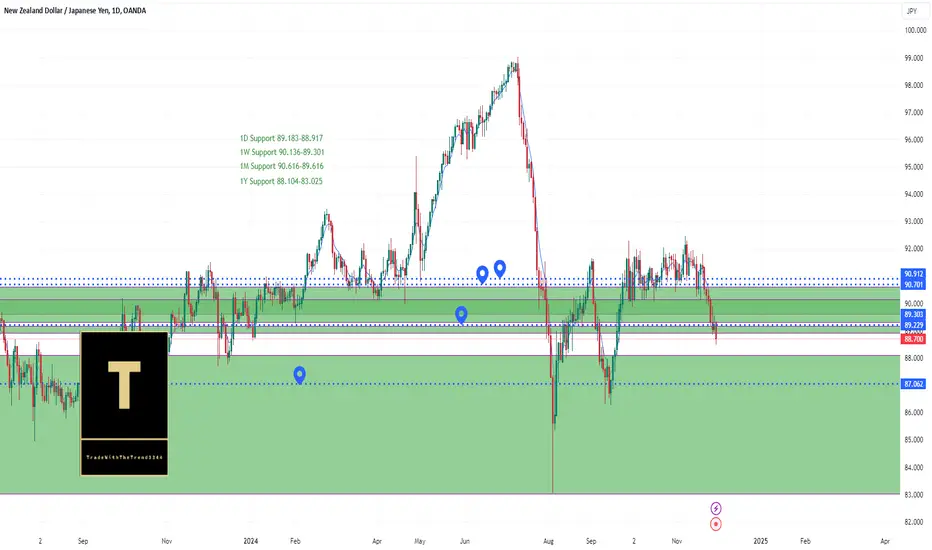
NZDJPY Downturn Hinges on Key Support LevelsHello,
OANDA:NZDJPY has experienced a downturn, which is likely to continue. Buyers are now stepping in, anticipating that the strong support levels at 88.658 and 88.35 on the 1-hour and 4-hour charts will hold. If these support levels fail, further downside movement is expected.
No Nonsense. Just Really Good Market Insights. Leave a Boost
TradeWithTheTrend3344
NZDJPY might return to the rangeThe fundamental situation for NZDJPY is essentially different from most other pairs with the Kiwi dollar since the Bank of Japan is in a cycle of slow tightening rather than the RBNZ’s relatively aggressive loosening. The probability of a hike by the BoJ on 19 December is now about 60%. Possible new American tariffs on imports would affect both countries, but New Zealand would likely face a much stronger though indirect effect due to its important trade with China.
Although the sideways trend since early October isn’t very well established, the recent downward movement still looks like a fakeout. 27 November’s doji wasn’t followed by a clear down candle and the price is clearly oversold based on Bollinger Bands and the slow stochastic. ¥91 remains the primary reference. A move back above ¥92 seems highly unfavourable in the near future but volume and volatility probably need to increase before there’s another test of the strong support around ¥86.50.
This is my personal opinion which does not represent the opinion of Exness. This is not a recommendation to trade.

NZD/JPY forming ABC before dropTwo possible situation to trade. I prefer another up to form a nice ABC pattern, before it drops to 1.272 or 1.414 area.
Daily trend is breaks and heading to down, now in consolidation situation. For now i believe another up trend to form higher C leg before it heading down. Let see and have fun.

NZDJPY_LONG OPPORTUNITYNZDJPY is showing Bullish Bias based upon the factors mentioned in the chart Fundamentally & Technically.

NZD JPY may enter into a bullish phaseNZD JPY may enter into a bullish phase
Seasonal trends indicate a bullish outlook for NZD/JPY; however, the COT report for non-commercial positions does not align with this view, showing a potential shift in sentiment. Despite this, NZD exhibits stronger endogenous positive factors compared to JPY, reinforcing a bullish bias for the NZD. Key drivers include improvements in business confidence, manufacturing, and services data, which collectively strengthen NZD's position.

Swing Trade Opportunity Amid Market Volatility: Volume & COT The Volume and COT reports suggest a promising potential for a swing trade this week, even amid the recent market volatility driven by political uncertainty

NZDJPY SHORT Market Structure Bearish on HTFs DH
Entry At both Daily And Weekly AOi
Weekly Rejection at AOi
Weekly EMA retest
Daily Rejection At AOi
Previous Structure point Daily
Around Psychological Level 91.000
H4 EMA retest
H4 Candlestick rejection
Levels 7.15
Entry 100%
REMEMBER : Trading is a Game Of Probability
: Manage Your Risk
: Be Patient
: Every Moment Is Unique
: Rinse, Wash, Repeat!
: Christ is King

NZDJPY: Important Breakout 🇳🇿🇯🇵
NZDJPY broke and closed below a support line of a wide horizontal
parallel channel on a daily.
The broken structure turned into resistance now.
With a high probability, the market will continue falling
and reach 88.7 level soon.
❤️Please, support my work with like, thank you!❤️

NZDJPY ENTRY V48The Volume and COT reports look promising, highlighting a potential swing trade opportunity for the week despite recent market turbulence from political uncertainty. I’ll attempt a long here but will proceed cautiously, considering the RBNZ Press Conference is just a few minutes away. I might hold off and scale in afterward, depending on how the market reacts.

NZDJPY: Support and Bullish Divergence at 30 MinutesNZD/JPY is currently finding support and has formed a bullish divergence on the 30-minute chart. This setup suggests potential upward momentum.

NZDJPY is gradually entering into bullish phaseafter a strong bullish trend price dropped for some time and now the trend is giving signals for a decent bullish rally

Bearish drop?NZD/JPY is rising towards the pivot which acts as a pullback resistance and could drop to the 1st support which has been identified as an overlap support.
Pivot: 90.05
1st Support: 88.75
1st Resistance: 91.15
Risk Warning:
Trading Forex and CFDs carries a high level of risk to your capital and you should only trade with money you can afford to lose. Trading Forex and CFDs may not be suitable for all investors, so please ensure that you fully understand the risks involved and seek independent advice if necessary.
Disclaimer:
The above opinions given constitute general market commentary, and do not constitute the opinion or advice of IC Markets or any form of personal or investment advice.
Any opinions, news, research, analyses, prices, other information, or links to third-party sites contained on this website are provided on an "as-is" basis, are intended only to be informative, is not an advice nor a recommendation, nor research, or a record of our trading prices, or an offer of, or solicitation for a transaction in any financial instrument and thus should not be treated as such. The information provided does not involve any specific investment objectives, financial situation and needs of any specific person who may receive it. Please be aware, that past performance is not a reliable indicator of future performance and/or results. Past Performance or Forward-looking scenarios based upon the reasonable beliefs of the third-party provider are not a guarantee of future performance. Actual results may differ materially from those anticipated in forward-looking or past performance statements. IC Markets makes no representation or warranty and assumes no liability as to the accuracy or completeness of the information provided, nor any loss arising from any investment based on a recommendation, forecast or any information supplied by any third-party.

NZD/JPY LONG FROM SUPPORT
Hello, Friends!
NZD-JPY downtrend evident from the last 1W red candle makes longs trades more risky, but the current set-up targeting 91.830 area still presents a good opportunity for us to buy the pair because the support line is nearby and the BB lower band is close which indicates the oversold state of the NZD/JPY pair.
✅LIKE AND COMMENT MY IDEAS✅

NZDJPY Trading Opportunity! BUY!
My dear friends,
NZDJPY looks like it will make a good move, and here are the details:
The market is trading on 90.005 pivot level.
Bias - Bullish
Technical Indicators: Supper Trend generates a clear long signal while Pivot Point HL is currently determining the overall Bullish trend of the market.
Goal - 90.643
Recommended Stop Loss - 89.634
About Used Indicators:
Pivot points are a great way to identify areas of support and resistance, but they work best when combined with other kinds of technical analysis
———————————
WISH YOU ALL LUCK

NZDJPY- Bullish IdeaThe exogenous and endogenous factors are decreasing but leading economic indicators are increasing for the pair NZDJPY. Seasonality also supports the idea that NZDJPY will be bullish in the last week of November and the first week of December. The Monthly currency heat map also suggests that November is bullish for NZD and Bearish for JPY.
Technicals show that NZDJPY is consolidating after making a bullish divergence at 1H. Look for the entry if it breaks above the range.

NZDJPYim back to posting full time ,
new set up . Buy NZDJPY
textbook setup
i dont sell nothing here .
i show free setups , follow for more
{buy NZDJPY Now}
- 90.214
SL 90.063
TP 91.263

NZD/JPY: Downside Likely Before ReboundHello,
OANDA:NZDJPY pair is expected to test support levels further at this stage. However, there remains confidence that these supports will provide enough momentum to push the price upward eventually. Currently, with the price closing below the monthly, weekly, and daily pivot points, a downside move appears more likely in the near term before any potential upward movement. A key signal for further downside would be if the price crosses and consolidates below 89.588.
No Nonsense. Just Really Good Market Insights. Leave a Boost
TradeWithTheTrend3344

NZD-JPY Long From Support! Buy!
Hello,Traders!
NZD-JPY is retesting
A horizontal support level
Of 89.846 but its a strong
Level from where we will
Be expecting a further
Local move up
Buy!
Comment and subscribe to help us grow!
Check out other forecasts below too!

NZDJPY daily viewNJ is for good short breakout trade with good RR ratio , am waiting for confirmation using smaller time frames to take short trade with profit target tobthe next support level.
