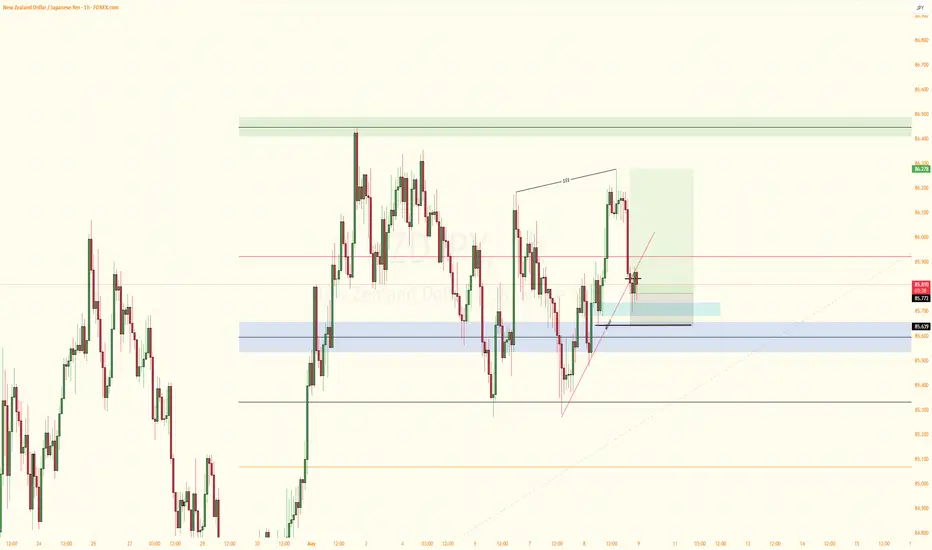
NZDJPY: Strong Bullish Signal 🇳🇿🇯🇵
I spotted a nice example of the application of SMC trading
with multiple time frame analysis on NZDJPY pair.
After a test of a significant daily demand zone,
first, we see a liquidity grab where the price went beyond
the underlined zone.
A consequent bullish imbalance and CHoCH confirm
a real strength of the buyers and indicate a highly probable
bullish continuation.
Next goal - 86.43
❤️Please, support my work with like, thank you!❤️
I am part of Trade Nation's Influencer program and receive a monthly fee for using their TradingView charts in my analysis.
JPYNZD trade ideas

NZDJPY may end its rally with a correctionNZDJPY almost without pullbacks, with one impulse forms a strong fall. The potential is starting to run out and the market will need a breather. The current wave may test the zone of interest at 85.268 and move into the correction phase
The price is ready to test the strong support at 85.268, the limit level is most likely still in the market and may hold the support area and thus trigger a correction and pullback to 0.5 fibo
Scenario: fall to 85.268, false breakdown and rebound to the first zone of interest (imbalance) 86.500

NZDJPY: Bulls Will Push Higher
The price of NZDJPY will most likely increase soon enough, due to the demand beginning to exceed supply which we can see by looking at the chart of the pair.
Disclosure: I am part of Trade Nation's Influencer program and receive a monthly fee for using their TradingView charts in my analysis.
❤️Please, support our work with like & comment!❤️

NZDJPY Long We have three POI with the first already broken. Possibility of price reacting from the second (middle) POI and buying is high. Data showed from RSI and Stoch offers a possibility of it being over sold, so this may be valid.
However, this is not a trade idea but areas to watch out for. If price fails to react from the second POI and breaks it lower, then we can expect a push up from the third POI.

NZD/JPY Potential Bullish ContinuationNew Zealand Dollar/Yen price seems to exhibit signs of potential bullish momentum as the price action may form a credible Higher Low on key Fibonacci and Support levels.
Trade Plan :
Entry @ 86.29
Stop Loss @ 84.85
TP 0.9 - 1 @ 87.586 - 87.730

NZDJPY → Countertrend correction and false breakoutFX:NZDJPY is testing resistance within a global downtrend. The currency pair is not yet ready to continue its growth and is forming a local reversal pattern.
Within the global downtrend, the currency pair is forming a countertrend correction and testing resistance at 87.400. The liquidity pool formed above this level is not yet ready to let the price move further. Without the possibility of continuing growth, the price returns to the range and forms a false breakout of resistance. However, since we are in the range and the price has returned inside it, if the bears hold the line (the upper limit of the trading range) at 87.400, this could trigger a further decline, thereby continuing the global downtrend.
Resistance levels: 87.400
Support levels: 86.5, 85.26
Consolidation of the price below 87.400 will confirm that the price is not yet ready to continue the trend. The falling dollar index is provoking a rise in the Japanese yen, which may also put pressure on the currency pair.
Best regards, R. Linda!


NZDJPY- BUY IdeaNZDJPY is in bullish trend making HHs and HLs. Look for buy opportunity as it is retesting a key support area. Put Stop loss below previous HL.

NZD/JPY For Bearish as pull-backyou can go short now
or
wait for entry point and go short
general trend is up trend
current phase is pull-back
NZD under Pressure
have fun :)

NZDJPY: Bullish Outlook - Breakout From Contracting TriangleNZDJPY: Bullish Outlook - Breakout From Contracting Triangle
NZD/JPY has broken out of a strong contracting triangle pattern, signaling potential upward movement.
However, the price may take a short pause, possibly declining slightly for a brief correction before continuing its rise.
This move was triggered by a recent US-China tariff agreement, which is still fresh, meaning the market hasn't fully reacted. NZD/JPY could see further gains as the market absorbs the news.
Key levels to watch:
87.50 – A major technical zone
88.50 – Another key level near a larger structure
You may find more details in the chart!
Thank you and Good Luck!
❤️PS: Please support with a like or comment if you find this analysis useful for your trading day❤️
Disclosure: I am part of Trade Nation's Influencer program and receive a monthly fee for using their TradingView charts in my analysis.

NZDJPY Breakout on 15m📈 Clean breakout confirmation after squeeze compression
This chart shows how Q Squeeze Trend filters entries on NZDJPY 15-minute with impressive clarity.
Here’s what stands out:
🔹 Squeeze logic identifies low-volatility phases and waits for breakout
🔹 SuperTrend confirmation ensures direction is real
🔹 No repainting — all signals confirmed and reliable
🔹 Buy/sell arrows + background shading for simple, readable visual cues
🎯 Use it with structure or support/resistance for even better results.
🚀 Available now in the Indicators tab — just search Q Squeeze Trend by Quantora.
Stay for quality — trade with clarity.

RISING WINDOW!As you can see at the big white arrow, we have an open window; A rising window. This is a very bullish indication, not to mention the bullish candlestick next to the previous candlestick, which is red. This is also very bullish. Be sure to set up your horizontal trend lines (as seen in this idea). Happy trading!

NZDJPY LongNZDJPY is now net long on the regression break.
I am consider all EA options on all market this morning.


NZD-JPY Free Signal! Sell!
Hello,Traders!
NZD-JPY gapped up on
The week's open and went
Further up, following other
Yen pairs, however, the upward
Move here was way less powerful
Than on the others and after the
Retest of the horizontal resistance
Of 87.2570 we are seeing significant
Weakness so we are assuming a
Correction is coming which means
We can enter a short trade with
The Take Profit of 86.399 and
The Stop Loss of 87.436
Sell!
Comment and subscribe to help us grow!
Check out other forecasts below too!
Disclosure: I am part of Trade Nation's Influencer program and receive a monthly fee for using their TradingView charts in my analysis.

liquidity areasAOL/AOH price will look to sweep the marked liquidity areas before targeting either AOL/AOH

NZD/JPY For Bullishwait for pull-back near by entry point and then go long
general trend is up trend
have fun :)

NZDJPY price action trading n a weekly timeframe, the market revisited a previously tested zone. On the 1-hour chart, it broke out of this zone, and on the 15-minute chart, a backtest of the breakout level is currently occurring. Based on this setup, I’m planning to enter a trade.
Trade Plan:
Take Profit (TP): Targeting the last swing high.
Stop Loss (SL): Placing it below the last resistance level.
Risk-Reward Ratio (RR): Aiming for a minimum of 1:3.
This setup offers a high-probability trade with a favorable risk-reward ratio, capitalizing on the breakout and backtest confirmation.

(Ultimate Re-Entry) NZD JPY #0016 Short Swing Trade- Its late at night, I am a bit tired to explain in detailed.
- I will write in the note tomorrow morning local time.

NZDJPY LONGHey everyone we looking for a long NZDJPY, we were having a uptrend for an quiet a while so this is what i see and why i will taking a buy
1) break and retest to daily support and reject few times
2) reject from a 50% Fib level
3) break our counter trend line on 4h which shows us buyer is taking over
4) shift from bearish to bullish market after break of structure on1h
5) reject Daily and 4h 50 EMA
6) engulfing bullish on 4h
Im aiming 1:2 risk to reward Ratio

Current Analysis for NZDJPY This is my current analysis for NZDJPY. Overall bias is bullish, while price is gaining support at a major exhaustion zone, the bearish candle stick that can be seen to the left is just an impulsive move due to the timing of it's occurence.
BEARISH TREND IN NZDJPYA bearish trend in the NZD JPY currency, taking my trade using RIB tool and booking my profit.

NZDJPY Will Move Lower! Short!
Here is our detailed technical review for NZDJPY.
Time Frame: 4h
Current Trend: Bearish
Sentiment: Overbought (based on 7-period RSI)
Forecast: Bearish
The market is trading around a solid horizontal structure 85.876.
The above observations make me that the market will inevitably achieve 85.270 level.
P.S
We determine oversold/overbought condition with RSI indicator.
When it drops below 30 - the market is considered to be oversold.
When it bounces above 70 - the market is considered to be overbought.
Disclosure: I am part of Trade Nation's Influencer program and receive a monthly fee for using their TradingView charts in my analysis.
Like and subscribe and comment my ideas if you enjoy them!
