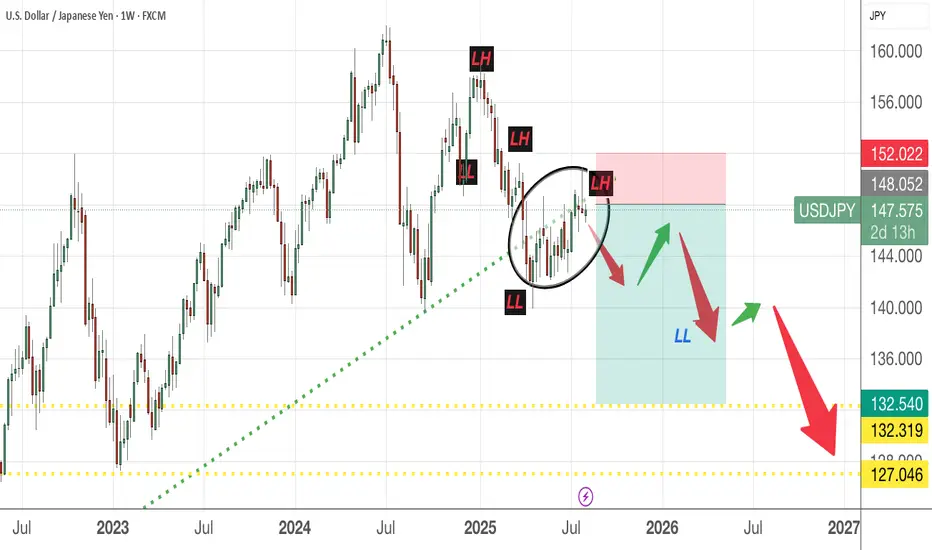
USDJPYUSDJPY roadmap is down. looking for entry signal. is the corrective structure complete favouring downside?
JPYUSD trade ideas

What i am looking out for in the market today on XAUUSD, USDJPYToday's price action is looking very interesting, an ideal setup for trading. Watch the video and, if you find it helpful, give it a like and a boost so more people who might benefit from it can see it too

USD/JPY(20250807)Today's AnalysisMarket News:
Federal Reserve Chairman Kashkari: A rate cut may be appropriate in the short term, and two rate cuts this year are reasonable. Trump: The new Fed governor will likely be temporary, and the appointment will be announced within 2-3 days.
Technical Analysis:
Today's Buy/Sell Levels:
147.40
Support and Resistance Levels:
148.30
147.96
147.74
147.05
146.83
146.49
Trading Strategy:
If the market breaks above 147.40, consider a buy entry, with the first target price being 147.74. If the market breaks below 147.05, consider a sell entry, with the first target price being 146.83

USDJPY Short ProjectHi guys...😎
It's time to do a Short Project on USDJPY with 3 key reasons:
1. Price Drivers: institutional shorting
2. Trend: neutral
3. Momentum: bearish
Action: waiting for entry on the intraday timeframe (entry will be published further)
**USD/JPY Pending Buy Signal**(Valid until price closes below 146.800 or conditions break)
* Strong bearish engulfing candle invalidates structure
Short USDJPY after the very strong rejection of 151 levelThe price is ranging between
the levels of 151 and 141
It rejected strongly the 151 level
by a very strong bearish bar
I opend short position at 147.25
SL 149.25
TP 144.00

USDJPY short on daily chartStop Loss = 152.065
Entry Order = 149.815
TP1 = 147.565
Two positions with the same stop loss and x1 target for the first position
The stop loss of the second position to breakeven when the first position hits the target1.
The second position has no target, only exit
Risk = 2% of account capital (1% each position)

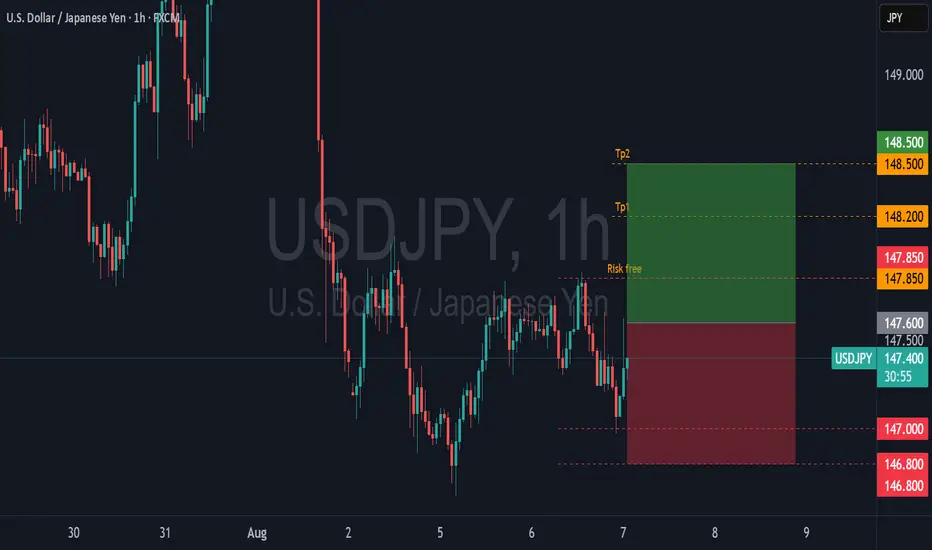
USDJPY Swing Trade Plan – H1 Chart AnalysisA potential long setup is identified on USDJPY based on current price action and structure:
🔸 Entry (Buy Stop): 148.236
🔸 Stop Loss (SL): 146.980
🔸 Take Profit 1 (TP1): 149.441
🔸 Take Profit 2 (TP2): 150.559
📊 Price is currently consolidating below the 148.236 resistance zone. A break above this level would confirm bullish continuation, targeting previous supply zones.
📉 RSI is showing a slight bullish divergence and currently hovering around 42, signaling potential upside if momentum picks up.
🔍 Key zones are marked:
Buy Zone highlighted just above current consolidation
TP1 aligns with minor resistance and past liquidity grab
TP2 near the upper supply zone from the recent swing high
SL set safely below recent support and structure low
🛡️ Risk-managed plan with favorable RR if bullish breakout occurs. Wait for confirmation before entry. Stay sharp and trade safe!


usd/jpy LONG SET UPUSD/JPY has shown heavy support signs on longer time frames (1D, 4hr, 1hr)
-true hr/ 1D range $145.81-151~
-RSI staggering below 50
-possible inverse head/shoulders on 1D, 4hr, 1hr
** 4hr ema supports bullish sign
100 ema above 200 ema
50 ema above 100 ema
21 ema above 50 EMA
5 ema below 100 EMA
5 ema below 13 ema
13 ema below 100 ema
price action 3 bull bar cross above 5 ema set up for long entry
entry 147.64
target 151.37+
stoploss 147.28

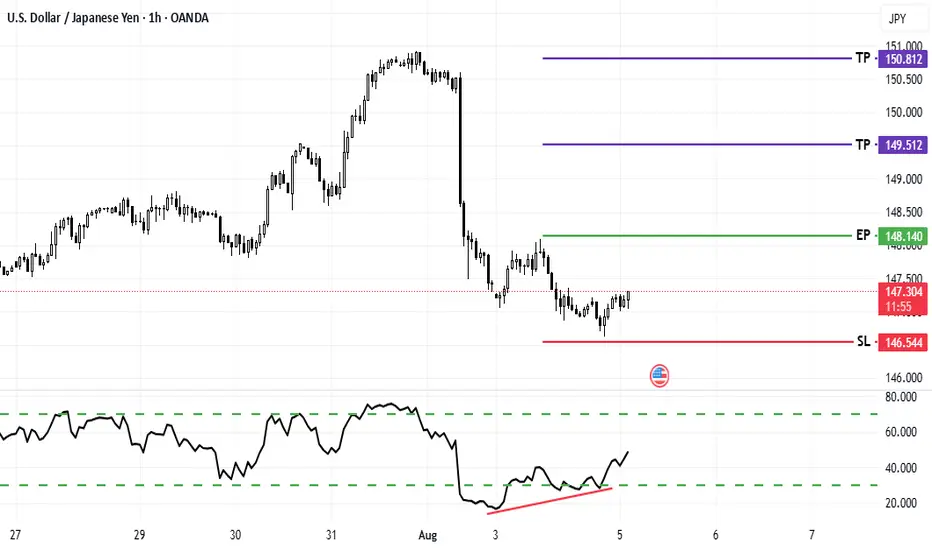
Is it time to buy more YEN dollars ?Look at the circled region. IF the equity market will to fall/crash/or goes into a bear market, then I would expect more people will start to snap up the YEN dollars. That means, we can expect this pair to go south........
This is a mid to longer term trade set up so lots of patience needed.
As usual, please DYODD
General Opinion USDJPYThe Yen intervene in my opinion is futile. The USDJPY has a trajectory of 200. I do expect the touch base on 152 but i feel that Japan is getting impatient that appears to be in the recent intervention. We also need to guard against the year end, stop loss should be tight. As the downside move has 137 at sight.

Sell USDJPYWe will try to sell USDJPY again. After waiting the whole day for bearish movement, I believe price will finally fall during NY session.


USDJPY - Bullish IdeaThe pair have formed Bullish divergence on 1H TF.
Entry can be taken after break of LH.
Sell USDJPYWe can expect USDJPY to fall deeper into the support on Tuesday. A bearish flag indicates price is ready to decline.

USDJPY (Next 24 Hours) Technical Analysis & Forecast 1. Japanese Candlestick Analysis
4H/1H: Price opened at 147.056 near resistance (147.00–147.20). Recent candles show bearish engulfing (4H) and dark cloud cover (1H), signaling rejection.
30M/15M: Shooting star at 147.056 and bearish harami indicate exhaustion. Failure to close above 147.20 confirms weakness.
5M: Three black crows pattern emerging, suggesting strong short-term bearish momentum.
Outlook: Bearish reversal likely if 147.00 breaks.
2. Harmonic Patterns
4H/1H: Bearish Gartley Pattern completing at 147.056 (D-point).
PRZ: 147.00–147.20 (confluence of 78.6% XA and 127.2% BC).
Fibonacci Ratios: AB=CD symmetry (147.00–147.20).
30M: Bullish Crab forming at 146.50, but secondary to larger bearish setup.
Outlook: High-probability short entry at 147.00–147.20 with target 146.20.
3. Elliott Wave Theory
4H: Wave 5 of impulse cycle peaked at 147.056.
Structure: Completed 5-wave sequence from 145.50 → 147.056.
Corrective Phase: ABC pullback targeting 146.20 (Wave A) and 145.80 (Wave C).
1H: Sub-wave (v) of 5 ending at 147.056. RSI divergence confirms exhaustion.
Outlook: Bearish correction to 145.80–146.20 within 24 hours.
4. Wyckoff Theory
Phase: Distribution (after markup from 145.50 → 147.056).
Signs: High volume at 147.056 (supply), upthrust above 147.20 failed.
Schematic: Phase C (markdown) initiating.
1H/30M: Spring at 147.00 failed to hold, indicating weak demand.
Outlook: Break below 147.00 triggers markdown to 146.20.
5. W.D. Gann Theory
Time Theory
24H Cycle: Key reversal windows:
UTC+4: 10:00–12:00 (resistance test), 16:00–18:00 (trend reversal).
Square of 9: 147.056 aligns with 0° angle (resistance).
Square of 9
147.056 → Resistance Angles:
0° (147.00), 90° (147.80), 180° (148.60).
Support: 45° (146.20), 315° (145.40).
Price Forecast: Reversal at 147.00 (0° angle).
Angle Theory
4H Chart: 1x1 Gann Angle (45°) from 145.50 low at 146.20. Price above angle = bullish, but overextended.
1H Chart: 2x1 Angle (63.75°) at 147.056 acting as resistance.
Squaring of Price & Time
Price Range: 145.50 → 147.056 (1.556 points).
Time Squaring: 155.6 hours from 145.50 low → 147.00 resistance (155.6 points ≈ 155.6 hours).
Harmony: 147.056 = Time Cycle Peak (24H from open).
Ranges in Harmony
Primary Range: 145.50–148.00 (250 pips).
50% Retracement: 146.75 (support).
61.8% Retracement: 146.20 (critical support).
Secondary Range: 146.20–147.20 (100 pips).
Key Levels: 146.70 (50%), 146.20 (61.8%).
Price & Time Forecasting
Price Targets:
Short-Term: 146.20 (61.8% Fib, Gann 45° angle).
Extension: 145.80 (100% of prior correction).
Time Targets:
First Reversal: 8–12 hours from open (UTC+4 12:00–16:00).
Second Reversal: 20–24 hours (UTC+4 00:00–04:00 next day).
Synthesized 24H Forecast
Bearish Scenario (High Probability)
Trigger: Break below 147.00 (confirmed by 1H/30M close).
Targets:
T1: 146.20 (61.8% Fib, Gann 45° angle).
T2: 145.80 (Wyckoff markdown, Elliott Wave C).
Timeline:
8–12H: Drop to 146.20 (UTC+4 12:00–16:00).
20–24H: Test 145.80 (UTC+4 00:00–04:00 next day).
Confirmation: RSI <50 on 1H, volume spike >20% average.
Bullish Scenario (Low Probability)
Trigger: Sustained close above 147.20 (Gann 0° angle).
Targets: 147.80 (90° angle), 148.60 (180° angle).
Timeline: 12–16 hours (if 147.20 breaks).

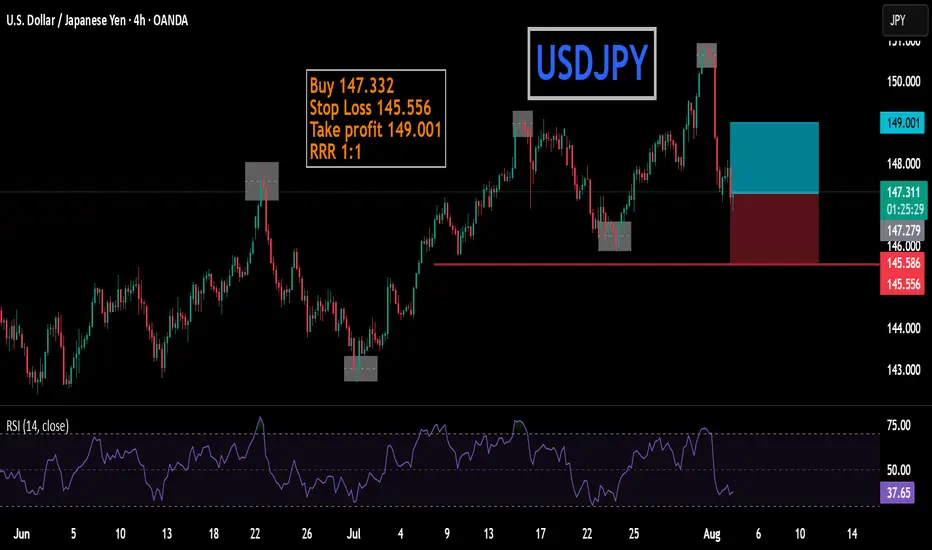
ENTRY USDJPYDisclaimer:
This is merely a chart-based analytical trading idea and is not considered investment advice. Please manage your risks carefully and conduct your own research before making any trading decisions.

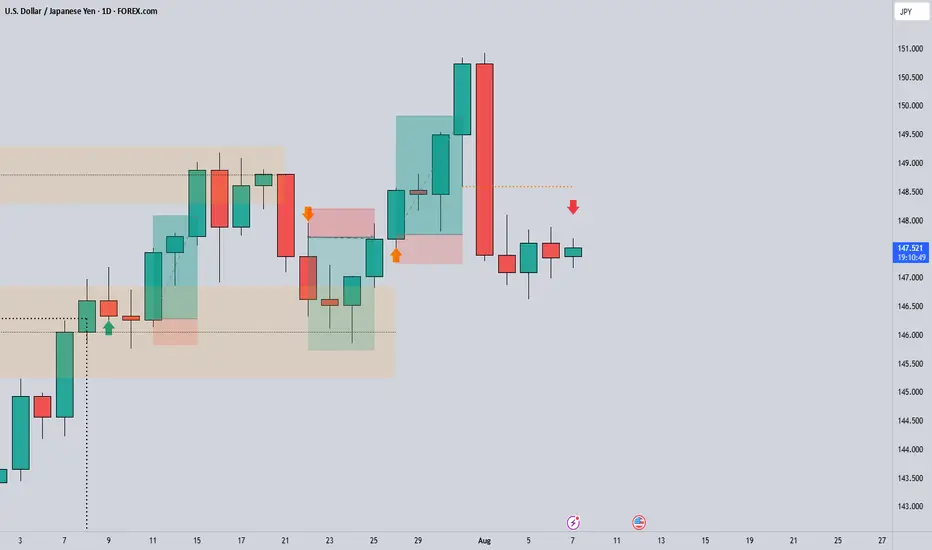
USD/JPY testing key support after Friday's dropThe USD/JPY fell sharply Friday in reaction to the weak US jobs data. But it is now testing the upside of a massive short-term support area, between 146.00-147.00. Can we see a bounce here towards 148.60 zone initially?
By Fawad Razaqzada, market analyst with FOREX.com

USD not coming slowBull points
Bullish on higher timeframe
Rsi div on 1h
wait for trend reversal
RRR go for 1:2

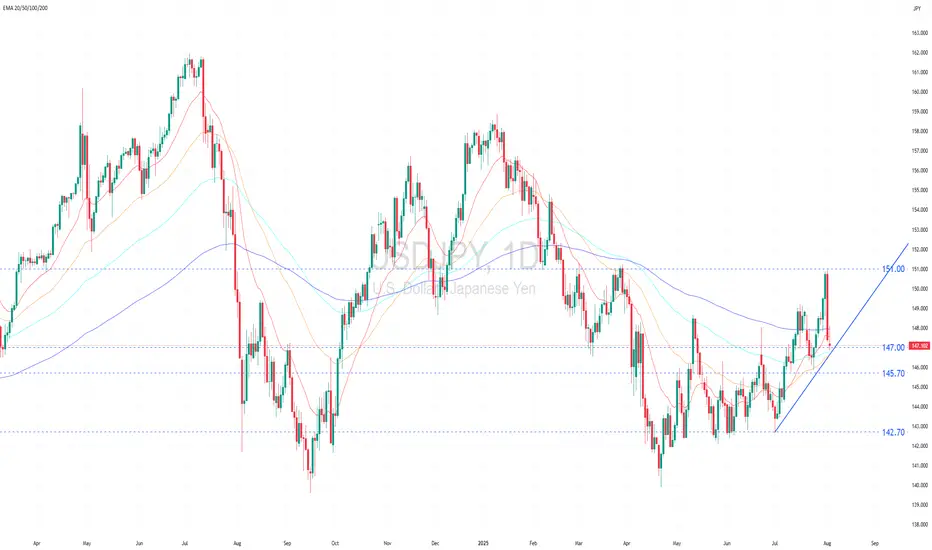
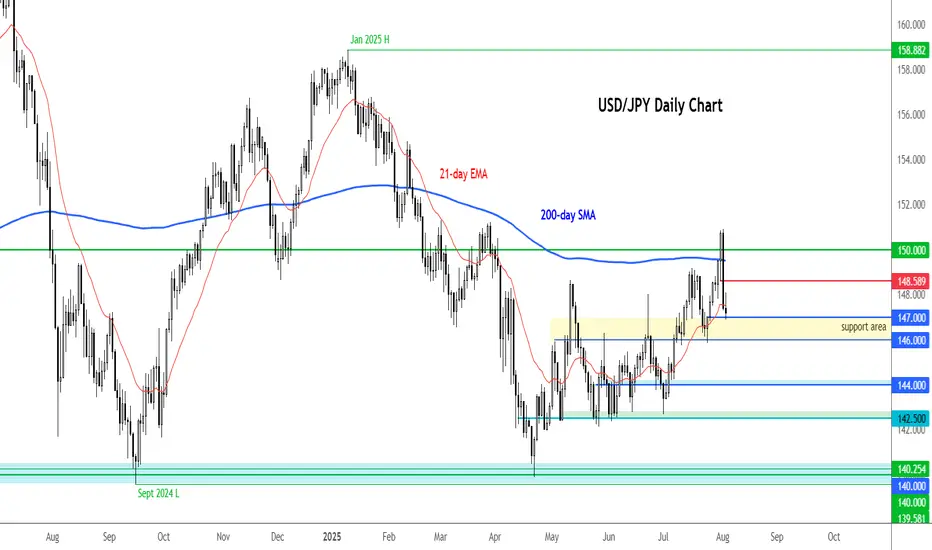
Long-term yen weakness persists due to Fed–BoJ policy divergenceLong-term yen weakness persists due to Fed–BoJ policy divergence and declining exports.
Technical analysis
USDJPY has formed a series of higher highs and higher lows, signaling the early stage of an uptrend. However, the strength of this trend remains uncertain, as each new high is followed by a pullback, indicating a fragile uptrend.
If the price holds above 147.00 and prints a higher low, it would reinforce the bullish structure, with the next upside target near the previous swing high at 151.00.
Conversely, a break below 145.70 would invalidate the bullish bias and could trigger a deeper decline toward the next support at 142.70.
Fundamental analysis
The easing of market concerns over retaliatory tariffs has recently supported a rise in USDJPY. However, weaker-than-expected U.S. nonfarm payroll data has fueled expectations of a more dovish Fed, placing short-term downward pressure on the dollar.
Nonetheless, the BoJ’s cautious and persistently dovish stance limits the yen’s long-term support, while ongoing yen carry trade activity continues to exert downward pressure on the currency in the medium term.
Additionally, Japan’s Jun export data showed a 0.5% YoY decline, the second consecutive monthly contraction, driven primarily by reduced exports of automobiles and steel. These declines reflect continued pressure from US import tariffs, particularly the 25% on Japanese cars, which remains a downside risk for the yen.
Analysis by: Krisada Yoonaisil, Financial Markets Strategist at Exness