US retail sales data stands out | FX ResearchThe yen didn't move all that much but did manage to post a 4-day low against the buck after the Bank of Japan maintained its interest rate as expected while planning to reduce bond purchases quarterly starting next fiscal year. BoJ Governor Ueda signaled potential rate hikes if economic and inflation forecasts held, but highlighted risks from U.S. tariffs, domestic food inflation, and weaker economic data expected in the second half of the year.
In global markets, the U.S. dollar remained stable. EUR/USD softened despite a strong German ZEW survey, and oil prices were relatively contained considering Middle East tensions and a tanker collision off the UAE coast.
U.S. stock futures are under a little pressure as Senate Republicans proposed tax cuts that could widen deficits, while upcoming U.S. retail sales data and ECB commentary on strengthening the euro’s global role have kept markets focused—also ahead of tomorrow’s highly anticipated Fed decision.
Exclusive FX research from LMAX Group Market Strategist, Joel Kruger
JPYUSD trade ideas

SELL USDJPYUSDJPY massive shorts to be executed on the H4 chart. A clear double top has formed and looks matured to complete. Sell now from 145,00 and take profit at 143,00.

USDJPY What Next? SELL!
My dear followers,
This is my opinion on the USDJPY next move:
The asset is approaching an important pivot point 145.13
Bias - Bearish
Safe Stop Loss - 145.55
Technical Indicators: Supper Trend generates a clearshort signal while Pivot Point HL is currently determining the overall Bearish trend of the market.
Goal - 144.31
About Used Indicators:
For more efficient signals, super-trend is used in combination with other indicators like Pivot Points.
Disclosure: I am part of Trade Nation's Influencer program and receive a monthly fee for using their TradingView charts in my analysis.
———————————
WISH YOU ALL LUCK

USDJPY - NEW BREAKOUT !Hello Traders !
After a huge bullish move,
The USDJPY broke the resistancce level (144.748 - 144.566).
So, I expect a new bullish move🚀
______________
TARGET: 145.280🎯

In my opinion it will cone down to get the LIQIn my opinion it will cone down to get the LIQ
Trend is Bearish

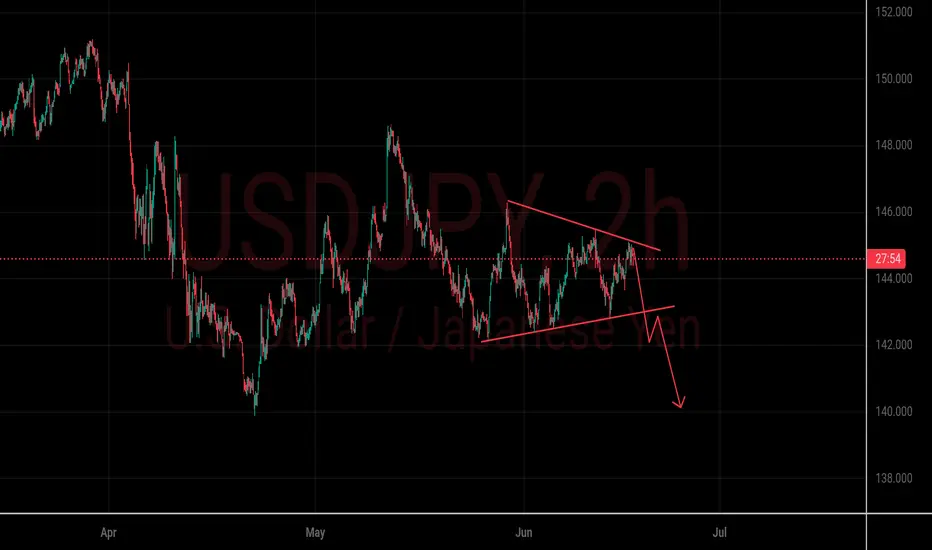
USDJPY Bearish BreakdownChart Overview
The USDJPY pair on the 2-hour chart is currently forming a descending triangle pattern — a typical bearish continuation setup.
---
Key Observations:
Resistance Line (Upper Trendline): Price is repeatedly rejected from lower highs.
Support Line (Lower Horizontal): Price maintains support around the 144.00–144.20 region.
Bearish Bias: The red arrow projection suggests a breakdown from the triangle, with a potential move toward 140.00 if the lower support fails.
---
Potential Bearish Scenario:
1. Break below ~144.00 confirms the triangle breakdown.
2. First target around 142.00, second target near 140.00.
3. Stop-loss ideally above 145.00 if entering short.
---
Disclaimer:
This analysis is for educational purposes and not financial advice. Always perform your own due diligence or consult a financial advisor before making trading decisions.
USDJPY Swing trade Signal for the Sell Once in a while we like to give a free signal. So here is one of the many trades we will have running for our subscribers.
Wait for the 1 hour candle to close below the Entry, and then a response to our entry, then you can sell.
Remember the rules, and remember your risk/reward
USDJPY Sell
🦇Entry: 143.525
⚠️Sl: 145.036
✔️TP1: 142.153
✔️TP2: 140.346
✔️TP3: 138.109
Happy trading. Any problems feel free to contact me, as over 10 years as a professional trader I can assure you there is no such thing as a stupid question.
Best,
Sarah

USDJPYHello Traders! 👋
What are your thoughts on USDJPY?
On the USD/JPY chart, price is currently moving within a symmetrical triangle pattern and is approaching the upper trendline and a key resistance zone.
We expect that upon testing this resistance level, price will likely fail to break above it and enter a bearish phase, potentially falling at least to the specified support level.
For higher-confidence sell entries, it’s recommended to wait for a confirmed downside break of the lower trendline of the triangle, which would validate a bearish continuation.
Will this resistance hold and trigger a drop, or will bulls take control? Share your thoughts below! 🤔👇
Don’t forget to like and share your thoughts in the comments! ❤️

USDJPY - UniverseMetta - Signal#USDJPY - UniverseMetta - Signal
D1 - Formation of a triangular structure + the price is at the upper border.
H4 - It is better to wait for the trend line to break through. It is better to reduce risks if we consider entering at the market. Stop behind the maximum of wave D.
Entry: 144.367 - *144.705
TP: 143.402 - 142.094 - 140.023 - 138.706
Stop: 145.473

USD/JPY TESTS RESISTANCE AMID BOJ CAUTION, FED OUTLOOKIn the wake of the escalating geopolitical tension in the Middle East, markets have been reacting sharply. Focusing on USDJPY pair, as the conflict shows signs of intensifying, investors turned to traditional safe-haven assets notably the Japanese yen amid fears of a broader regional spillover.
Beyond geopolitical tension in the Middle East, both economies are set to announce their interest rate decisions this week alongside economic outlook. At the end of Bank of Japan two days policy meeting earlier today, the Yen became a little stronger after the Bank of Japan said that it would keep interest rates at 0.5% and that it would slow down the process of reducing its balance sheet in 2025. BOJ Governor Kazuo Ueda maintained a cautious tone, noting global risks and keeping the door open for further policy tightening if needed.
On the other hand, the U.S., the retail sale would be on the wire by 4:30 PM GMT+4 (Dubai time). This key economic indicator will offer details about consumer spending trends, a major driver of the U.S. economy. Markets will closely watch the data for signs of economic strength or weakness, as it could influence expectations around future Federal Reserve policy decisions.
While the most important on the calendar, is that Fed committee is due to convene today for a two-day policy meeting, which would end on Wednesday the 18th.Meanwhile, Markets has priced in 99.9% for the rate unchanged at 4.25-4.50%.
TECHNICAL VIEW OF USDJPY; AND PRICE LEVELS TO WATCH OUT
Away from the fundamental drivers, the USD/JPY pair initially dropped on Friday the 13th and was resisted around 142.79 as risk aversion drove demand for the yen. However, the move was tempered by ongoing strength in the U.S. dollar, underpinned by resilient U.S. economic data and expectations the Federal Reserve may keep interest rates higher for longer, hence the change of character (CHOCH) at 143.89, hence the reversal of trend from downtrend to uptrend on the one-hour time frame, whereby price is seen trading inside the channel with the green trendline acting as support and the red, resistance. The pair was recently supported at 144.40 and hovers around 145.
In view of the economic releases, a break above 145.00 would likely usher in 145.40 and 145.80, while a break below 144.40 would mean that the bears are momentarily in control and price would potentially tank further towards 144.00 and 143.50 according to analyst, meanwhile break out of these levels are not ruled out.

Bank of Japan Leaves Interest Rate UnchangedBank of Japan Leaves Interest Rate Unchanged
This morning, the Bank of Japan (BOJ) released its interest rate decision, keeping the rate unchanged as widely expected. According to Forex Factory, the BOJ Policy Rate remains at 0.5%.
BOJ Governor Kazuo Ueda noted the following:
→ Japan’s economy is recovering moderately.
→ The Bank will continue raising rates if economic and inflationary conditions improve.
→ The situation surrounding trade tariffs remains highly uncertain.
The fact that the decision was anticipated by markets is reflected in price action on the charts.
Technical Analysis of the USD/JPY Chart
A brief spike in volatility occurred on the USD/JPY chart this morning, but it did not significantly alter the broader structure of price movements, which in June have formed a contracting triangle pattern.
In recent days, the pair has been climbing from the lower boundary of the triangle toward the upper edge, forming a short-term ascending channel (highlighted in blue). However, in the near term, this bullish momentum may weaken as the USD/JPY rate approaches the upper boundary of the triangle, which coincides with the psychologically significant level of 145 yen to the dollar (indicated by arrows).
From a medium-term perspective, traders should watch for a potential breakout from the triangle pattern, which could trigger a meaningful trend. One possible catalyst could be news of a trade agreement between the United States and Japan.
This article represents the opinion of the Companies operating under the FXOpen brand only. It is not to be construed as an offer, solicitation, or recommendation with respect to products and services provided by the Companies operating under the FXOpen brand, nor is it to be considered financial advice.

fx pairs signals📈 2H Forex Reversion Setup: USDJPY & EURUSD Cross Confluence
This chart highlights a great example of inverse correlation confirmation between major FX pairs using the ELFIEDT X-REVERSION indicator.
✅ USDJPY gave a clean BUY signal at the low of the move, shortly before a major reversal kicked off.
✅ At the same time, EURUSD flashed multiple SELL signals at its high, confirming a strong rejection.
📍 This is how we look for directional confluence across pairs:
EURUSD moves up while USDJPY drops → both reach reversion zones
RSI reverses on both, with visual confirmation from signal labels
Strong shift in USD strength confirmed across charts
🧠 Key Insight: When a USD-based pair like USDJPY prints a buy while a pair like EURUSD prints a sell, it’s often a high-quality reversal zone. The more aggressive the move before, the better the reaction after.
💡 Use this kind of cross-checking to increase confidence and build multi-symbol precision.

USDJPY is bout to experience a long term bearish movement From the chart, you will see that usdjpy is about to be bearish run.
reasons;
1, descending triangle chart pattern
2. ascending triangle

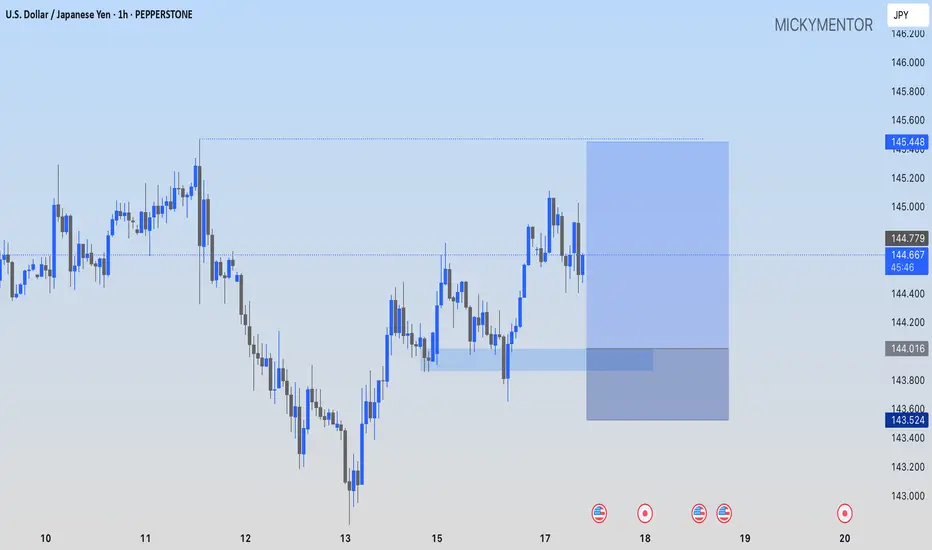
USDJPY: A BUY IDEAPEPPERSTONE:USDJPY I'm going long at 144.016, while keeping the 145.448 as my profit target.
Squeeze in Progress: Will BOJ Trigger the Next Breakout?USDJPY 17/06 – Squeeze in Progress: Will BOJ Trigger the Next Breakout?
The USDJPY pair is currently consolidating just below the key 144.650 resistance, stuck within a tightening triangle structure. As markets await more clarity from both the Bank of Japan (BOJ) and the Fed, price action is showing signs of indecision — but pressure is building.
🌐 Macro & Sentiment Overview
BOJ maintains a neutral stance: Despite growing speculation of a hawkish shift, the BOJ held rates steady, providing no strong forward guidance. Markets remain cautious.
US Dollar remains resilient amid stable bond yields and expectations that the Fed may delay rate cuts, adding short-term support to USDJPY.
Geopolitical risk is on the rise: Ongoing Middle East tensions are fueling safe-haven demand for JPY, capping bullish momentum.
🔍 Technical Setup (M30 Chart)
Price is trapped inside a symmetrical triangle, tightening between 144.652 resistance and 143.126 support.
EMA 13/34/89 are aligned bullishly, but EMA 200 (red) is acting as a dynamic ceiling near 144.300.
Key support zones:
144.071: Minor structural level and trendline test.
143.126: Major liquidity zone and untested demand.
🎯 Trade Scenarios
📉 Scenario 1 – Sell on Rejection at 144.652
Entry: 144.650–144.700
Stop Loss: 145.250
Take Profit: 144.071 → 143.600 → 143.126
Ideal if BOJ shifts tone or USD weakens post-Fed comments.
📈 Scenario 2 – Buy on Bullish Reaction at 143.126
Entry: 143.100–143.150
Stop Loss: 142.700
Take Profit: 143.600 → 144.071 → 144.650 → 145.200
Valid only with clear bullish confirmation on M15–M30 structure.
🧠 Final Thoughts
USDJPY is coiling tightly ahead of a potential breakout. Macro uncertainty from central banks, geopolitical instability, and upcoming CPI data make this week highly volatile. Instead of chasing, let price come to your zones and react accordingly.
🔔 Focus on structure, confirm with price action, and avoid emotional trades. Patience and discipline are key in this compression phase.

Traders, it's time to pay close attention! 🚨 USDJPY 4H Setup Alert – High-Probability Play Unfolding! 🚨
Traders, it's time to pay close attention! 🧠📊
The USDJPY pair has just perfectly tapped into a key bullish Fair Value Gap (FVG) on the 4-hour chart — a classic move in the smart money playbook. What’s more? We've just seen a clean sweep of internal range liquidity (IRL) — a textbook liquidity grab that signals potential accumulation by larger players. 💥💼
This is not just noise — it's a significant signal. The market structure is hinting at a possible shift in momentum, and bullish pressure is building. The trap has been set, the weak hands have been shaken out, and smart money may be preparing for a strong upward push. 📈🐂
🔮 What’s the next move?
All eyes are now on the external range liquidity (ERL) — a prime liquidity pool sitting above current price levels. If price accelerates toward it, this zone could act as the magnet and the catalyst for the next explosive move upward. 🚀
🔥 Key Points to Watch:
Bullish FVG reaction ✅
IRL liquidity swept ✅
Bullish market structure forming 🏗️
ERL liquidity resting overhead — potential target 🎯
Volume profile & order flow confirming accumulation? 👀
⚠️ Stay alert and don’t chase — let the setup come to you.
Smart money might already be stepping in, and if this momentum follows through, we could be witnessing the beginning of a strong leg up.
Mark your charts and monitor closely — opportunity is knocking. 📍🕵️♂️

USDJPY Descending channel breakout ahead bullish strongFX:USDJPY Breakout Alert – Bullish Momentum on 4H Chart 💥
The pair has broken out of the descending channel with strong bullish confirmation. Price action is showing solid momentum and market structure shift.
🟢 Entry Level: 144.700
📍 Technical Targets:
1st Target: 146.000 (Key Supply Zone)
2nd Target: 148.500 (Major Resistance)
🔴 Stop Loss: 143.000 (Demand Zone)
📊 This setup is based on the 4H time frame, offering a favorable risk-reward ratio for swing traders.
💬 Like, follow, and drop a comment if you’re riding this move!
💎 Join us for more updates, signals & insights.
Let’s trade smart, not hard. 😜
#USDJPY #ForexSignals #BreakoutTrade #TechnicalAnalysis #ForexTrading #LiviaTrades

USDJPY InsightHello to all our subscribers.
Please share your personal opinions in the comments. Don’t forget to like and subscribe.
Key Points
- The armed conflict between Israel and Iran has continued for five days. However, geopolitical risks in the Middle East have eased as Iran reportedly conveyed its willingness to agree to a ceasefire indirectly to the United States.
- U.S. President Trump stated on Truth Social, "Iran should have signed the 'deal' I told them to sign, and everyone must immediately leave Tehran, the capital of Iran."
- The Bank of Japan kept its benchmark interest rate unchanged at 0.5% and announced it will reduce long-term government bond purchases from the current 400 billion yen to 200 billion yen starting April next year.
Key Economic Events This Week
+ June 17: BOJ Interest Rate Decision, U.S. May Retail Sales
+ June 18: U.K. May Consumer Price Index, Eurozone May CPI, FOMC Meeting Results
+ June 19: BOE Interest Rate Decision
USDJPY Chart Analysis
There hasn’t been any major movement around the 144 level yet, but a clear trend is expected to emerge soon. An upward move is anticipated, and in that case, a peak is likely to form near the 148 level. Further direction will be determined once that zone is reached.

Fundamental Market Analysis for June 17, 2025 USDJPYThe Japanese yen (JPY) continues to experience significant pressure against the US dollar (USD), showing a three-day decline and trading above the key psychological level of 145.000. This weakening is largely due to growing market expectations that the Bank of Japan (BoJ) may delay raising rates until the first quarter of next year. The main reason for this delay is said to be the continuing uncertainty surrounding future US tariff policy, which could have a significant impact on global trade flows and Japan's economic growth. Moderate but steady growth in the US dollar is also contributing to the strengthening of the USD/JPY position, pushing the pair to new highs during the Asian trading session.
However, market participants are cautious about aggressive bearish bets against the yen ahead of the upcoming Bank of Japan monetary policy meeting. This meeting is seen as a critical event that could provide additional signals about the central bank's long-term policy outlook. Any hints of a change in tone or new assessments of the economic situation will be carefully analyzed by traders.
In addition to central bank decisions, growing geopolitical tensions in the Middle East may help limit deeper losses for the Japanese yen. As a traditional “safe haven,” the yen typically attracts investors during periods of global instability, which may offset some of the negative impact of interest rate differentials. In addition, the outlook for the USD/JPY pair is influenced by the growing recognition that the US Federal Reserve (Fed) may lower borrowing costs in 2025. Expectations of future Fed rate cuts could hinder further strengthening of the US dollar and thus limit the upside potential of the USD/JPY pair. Overall, the market remains in anticipation of key decisions that will determine the future trajectory of one of the world's most actively traded currency pairs.
Trading recommendation: SELL 144.550, SL 145.000, TP 143.600

Price action Usdjpy has failed swing low change of character where the green line is price filling the gaps and neve fell below red line all those are bullish characteristics

Bearish breakout off major support?USD/JPY is reacting off the pivot which acts as an overlap support and a breakout of this level could lead the price to drop to the 1st support.
Pivot: 144.51
1st Support: 143.74
1st Resistance: 145.22
Risk Warning:
Trading Forex and CFDs carries a high level of risk to your capital and you should only trade with money you can afford to lose. Trading Forex and CFDs may not be suitable for all investors, so please ensure that you fully understand the risks involved and seek independent advice if necessary.
Disclaimer:
The above opinions given constitute general market commentary, and do not constitute the opinion or advice of IC Markets or any form of personal or investment advice.
Any opinions, news, research, analyses, prices, other information, or links to third-party sites contained on this website are provided on an "as-is" basis, are intended only to be informative, is not an advice nor a recommendation, nor research, or a record of our trading prices, or an offer of, or solicitation for a transaction in any financial instrument and thus should not be treated as such. The information provided does not involve any specific investment objectives, financial situation and needs of any specific person who may receive it. Please be aware, that past performance is not a reliable indicator of future performance and/or results. Past Performance or Forward-looking scenarios based upon the reasonable beliefs of the third-party provider are not a guarantee of future performance. Actual results may differ materially from those anticipated in forward-looking or past performance statements. IC Markets makes no representation or warranty and assumes no liability as to the accuracy or completeness of the information provided, nor any loss arising from any investment based on a recommendation, forecast or any information supplied by any third-party.

big swing buy on a weak yenweak cpi and aggressive inflation. no wage increases. moderate yen. moderate your buys and pay attention to weekend news with middle east and conflicting USA involvement. this is a swing purchase stop loss below 138 with a profit pull outlook above 180. goodluck

Missed the UJ Entry in Hope of Retest!USDJPY Recently gave a fakeout of the triangle pattern in downside traping the seller, as trend is bullish and we see JPY is getting weaker.
Now we can look for the Buy entry at retest of trend line.
