USD/JPY 1D CHART PATTERNThe USDJPY chart shows a clear bullish breakout from a long-term descending trendline, signaling a potential shift in momentum. The pair has formed higher lows, marked by multiple rejections near the ascending support trendline, confirming strong buying interest. Price has successfully broken through a key resistance zone, turning it into support, with Ichimoku cloud indicators supporting the upward movement. A bullish continuation is expected as the price maintains strength above the breakout zone. The recent breakout candle and upward arrow suggest bullish sentiment and room for further upside, aligning with the overall trend reversal pattern visible on the chart.
Entry Buy: 148.570
Target point: 151.500
If you found this analysis helpful, don’t forget to drop a like and comment . Your support keeps quality ideas flowing—let’s grow and win together! 💪📈
JPYUSD trade ideas

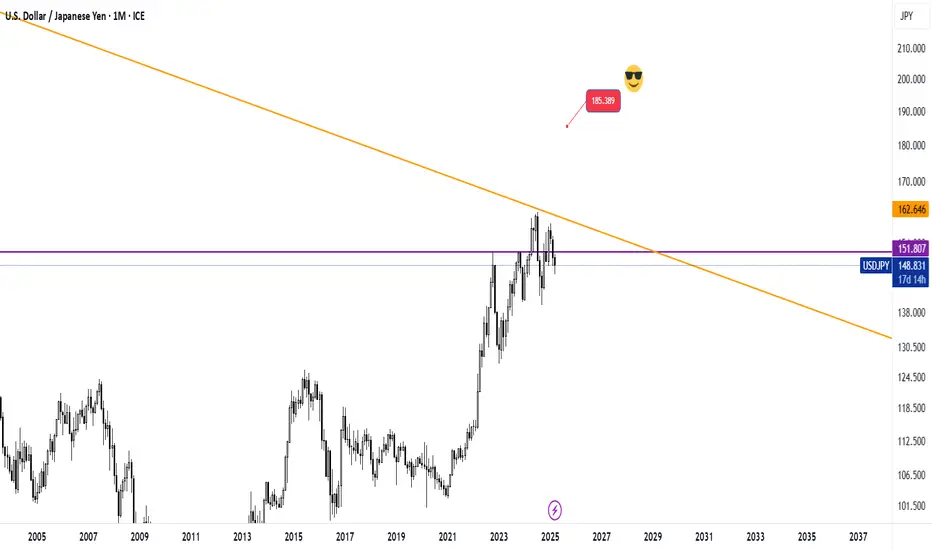
Increasing chances of bullish volatility in JPYThe fluctuations formed since May 2024 indicate a strengthening of the possibility of upward fluctuations in the currency pair, and in the long term, there is news of price targets in the range of 185 units!
Be careful, we will face numerous upward and downward fluctuations until the desired price target is reached!
Good luck
MJ.REZAEI
DeGRAM | USDJPY fixed above the descending channel📊 Technical Analysis
● Dollar-yen has punched through the 16-month descending channel top and twice retested it as support (false-break tags), carving a rising trend line that now guides price away from 144.90.
● Inside the break zone a smaller pennant is forming; a 4 h close above 147.18 completes the pattern and activates the channel-height target at 150.80 near the November swing cap.
💡 Fundamental Analysis
● US 2-yr yields pushed to a three-month high after hotter CPI core-services and Barkin’s “inflation progress has stalled”, while the BoJ July minutes flagged only “gradual” QT—widening the policy gap and reviving carry demand for yen shorts.
✨ Summary
Long 145.2-146.2; pennant break >147.18 targets 150.80. Bias void on a 4 h close below 142.80.
-------------------
Share your opinion in the comments and support the idea with like. Thanks for your support!

USD/JPY(20250728)Today's AnalysisMarket news:
Trump announced that the US and Europe reached a trade agreement: 15% tariffs on the EU, $600 billion in investment in the US, zero tariffs on the US by EU countries, the EU will purchase US military equipment, and will purchase US energy products worth $750 billion. However, the US and Europe have different opinions on whether the 15% tariff agreement covers medicines and steel and aluminum. Von der Leyen: 15% tariff rate is the best result that the European Commission can achieve.
US Secretary of Commerce: The deadline for tariff increase on August 1 will not be extended. The United States will determine the tariff policy on chips within two weeks.
Technical analysis:
Today's buying and selling boundaries:
147.47
Support and resistance levels:
148.58
148.17
147.90
147.04
146.77
146.35
Trading strategy:
If the price breaks through 147.90, consider buying, the first target price is 148.17
If the price breaks through 147.47, consider selling, the first target price is 147.04

USDJPY Falling Fast Bearish Momentum or Reversal Zone?USDJPY has dropped significantly and is now trading around 147.730, nearing a key historical support zone near 147.20 – 147.00.
This area previously acted as a strong demand zone and may trigger a bounce or a breakdown depending on market sentiment.
🔹 Technical Overview (4H Chart):
• Current Price: 147.73
• Support Zone: 147.20 – 147.00
• Resistance: 149.00
• Breakdown Target: 145.80
• Possible Bounce Target: 148.80 – 149.30
📊 Bias:
I'm watching this zone closely.
• If price holds above 147.00 with bullish candle – Long Setup toward 149.00
• If price breaks below 147.00 and closes on 4H – Short Setup toward 145.80
⚠️ Use tight SL below support zone if buying.

First possible for SELL After a long buy price need a correction movement and it can be a sell order

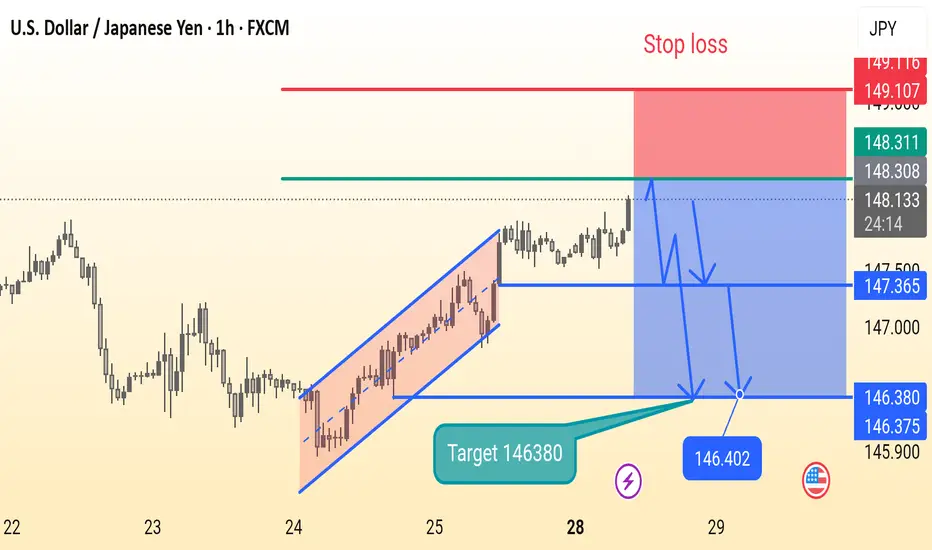
Usdjpy setupThis is a 1-hour USD/JPY chart showing a potential short (sell) trade setup. After a rising channel breakout, the price is consolidating. The chart suggests a bearish move with a target at 146.380 and a stop loss at 149.107. Key support levels are marked at 147.365 and 146.380.
USDJPY: Confirmed CHoCH & Bullish OutlookI spotted a confirmed Change of Character on 📈USDJPY on 4-hour timeframe.
The market, currently in a global bullish trend, has effectively broken through a minor bearish trend and surpassed a key horizontal resistance level.
It is likely to continue rising, with the next resistance at 149.00.

USDJPY HEADING UPThe daily time frame is showing potential bullish movement, seemingly forming structure after daily consolidation. Price bounced off of support and formed a higher low, a third retest of the bullish trend line will further validate this.

USDJPY Rising wedge on FX:USDJPY pair
Key level to watch is 150 where multiple failed breakout attempts were recorded.
Confirmed breakout will push price to 152-156

25.07.25 Morning ForecastPairs on Watch -
FX:USDJPY
CAPITALCOM:DE40
FX:GBPUSD
FX:AUDUSD
A short overview of the instruments I am looking at for today, multi-timeframe analysis down to what I will be looking at for an entry. Enjoy!

USDJPYDate:
July 28,2025
Session:
London and New York Session
Pair:
USDJPY
Bias:
Long
Looks like Sundays liquidity pool from last NYC open has been swept and it looks like price action wants to follow/continue its trend long.
Entry: 148.197
Stop Loss: 147.884
Target: 148.740
RR: 1.77
USDJPY30h Candle confirmed break out!
📢 USDJPY – 30H Breakout Confirmed
Technical Outlook:
Confirmed breakout on the 30H candle, signaling bullish.
Resistance break!
A Inverse Head & Shoulders pattern observed, though the right shoulder is slightly weaker than the left.
For safety, Stop Loss placed below the last Higher Low (HL) to respect market structure.
📍 Key Line:
“Imperfect structures can still produce perfect trades — when aligned with price action and fundamentals.”
🌐 USD Fundamentals Supporting the Bias:
Stronger-than-expected economic data (e.g., recent PMI and labor reports) continues to support USD strength.
Fed's hawkish stance and higher-for-longer rate policy remain favorable for the dollar against low-yielding currencies like JPY.

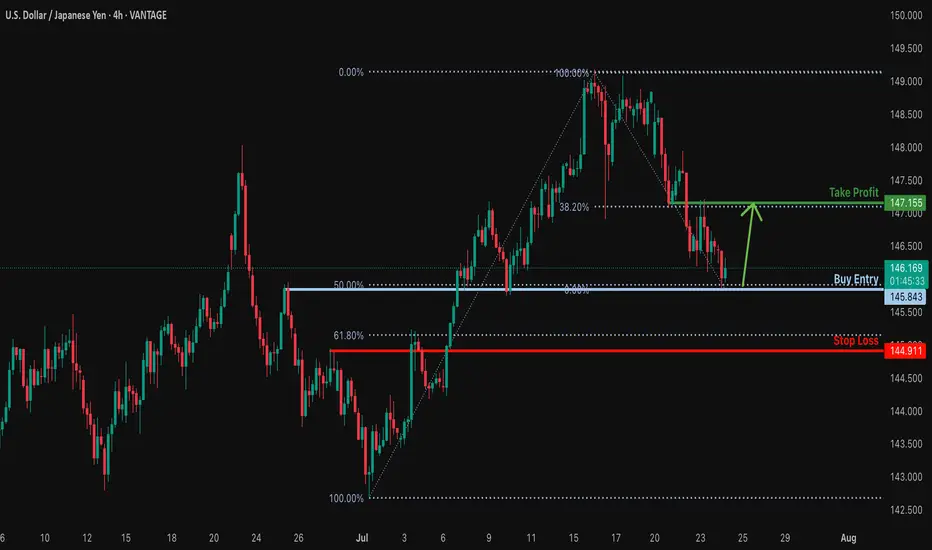
Bullish reversal?USD/JPY is falling towards the support level, which is an overlap support that aligns with the 50% Fibonacci retracement and could bounce from this level to our take profit.
Entry: 145.84
Why we like it:
There is an overlap support that aligns with the 50% Fibonacci retracement.
Stop loss: 144.91
Why we like it:
There is a pullback support that is slightly below the 61.8% Fibonacci retracement.
Take profit: 147.15
Why we like it:
There is an overlap resistance that lines up with the 38.2% Fibonacci retracement.
Enjoying your TradingView experience? Review us!
Please be advised that the information presented on TradingView is provided to Vantage (‘Vantage Global Limited’, ‘we’) by a third-party provider (‘Everest Fortune Group’). Please be reminded that you are solely responsible for the trading decisions on your account. There is a very high degree of risk involved in trading. Any information and/or content is intended entirely for research, educational and informational purposes only and does not constitute investment or consultation advice or investment strategy. The information is not tailored to the investment needs of any specific person and therefore does not involve a consideration of any of the investment objectives, financial situation or needs of any viewer that may receive it. Kindly also note that past performance is not a reliable indicator of future results. Actual results may differ materially from those anticipated in forward-looking or past performance statements. We assume no liability as to the accuracy or completeness of any of the information and/or content provided herein and the Company cannot be held responsible for any omission, mistake nor for any loss or damage including without limitation to any loss of profit which may arise from reliance on any information supplied by Everest Fortune Group.
USDJPY → Hunting for liquidity before the fallFX:USDJPY is changing its local trend and succumbing to global pressure. The market is seeing a change in price movement following the decline in the dollar index...
The trend has broken and the price movement has turned bearish. The fall in the dollar index is allowing the Japanese yen to strengthen, which is generally negative for the currency pair. The decline may continue after a slight correction.
Fundamentally, the dollar is correcting amid uncertainty due to the tariff war, as well as expectations of interest rate cuts.
Resistance levels: 147.20, 147.89
Support levels: 145.85, 145.23
As part of the correction, the price may test the liquidity zone of 147.7 or 0.7f. A false breakout and consolidation of the price in the selling zone may trigger a further decline in both the short and medium term.
Best regards, R. Linda!

GBPUSD - GBPJPY - USDJPY Trade Recaps 28.07.25Three positions taken last week. Some vital findings within my self-review process which showed a stop loss error with GBJPY causing me to miss a solid 4% trade, and a manual close on GBPUSD to bank a little extra profit.
Full explanation as to why I executed on these positions and the management plan with both.
Any questions you have just drop them below 👇

#USDJPY: Swing Buy Almost +2000 Pips! Dear Traders,
The USDJPY currency pair appears to be in an accumulation phase at the moment, as evidenced by the lack of significant price movement throughout the current week. Several factors contribute to this trend.
Firstly, several significant economic events are scheduled for this week, particularly tomorrow and Friday. These developments will have substantial implications for the future trajectory of the USDJPY pair. Consequently, there’s a possibility that the price may experience a decline before initiating a bullish trend. We’ve recently seen a strong bullish candle, which suggests a strong bullish move in the coming weeks. Additionally, the strong USD could continue rising, while the JPY is dropping.
Secondly, there are two primary areas where the price could reverse its course. The extent to which the USD reacts to the economic data will indicate potential reversal zones.
It’s crucial to conduct your own analysis before making any financial decisions. This chart should be used solely for educational purposes and does not guarantee any specific outcome.
Regarding the stop loss, as this is a swing trade, it’s advisable to employ a larger stop loss if the price reaches entry zones. The take profit level can be determined based on your entry type and analysis.
We wish you the best of luck in your trading endeavours and emphasise the importance of trading safely.
Please share this analysis with others through likes, comments, and social media platforms. If you have any questions or require further assistance, don’t hesitate to comment below. We’re here to provide support.
Team Setupsfx_
❤️🚀

USDJPY Short from ResistanceHello Traders
In This Chart USDJPY HOURLY Forex Forecast By FOREX PLANET
today USDJPY analysis 👆
🟢This Chart includes_ (USDJPY market update)
🟢What is The Next Opportunity on USDJPY Market
🟢how to Enter to the Valid Entry With Assurance Profit
This CHART is For Trader's that Want to Improve Their Technical Analysis Skills and Their Trading By Understanding How To Analyze The Market Using Multiple Timeframes and Understanding The Bigger Picture on the Charts

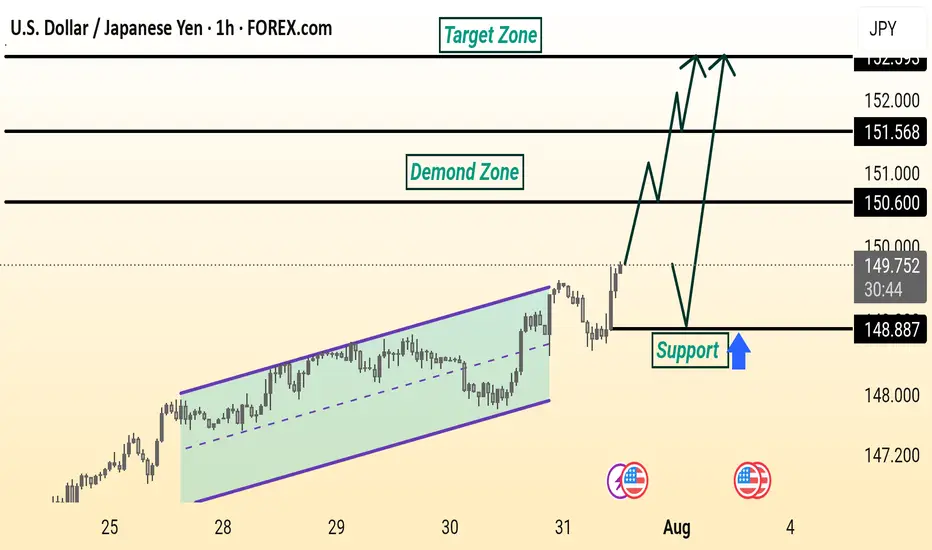
USD/JPY Analysis is Ready USD/JPY is showing a bullish setup. Price broke out of a rising channel and is expected to retest the 148.887 support level before moving higher toward the 150.600 and 151.568 resistance zones, targeting the 152.000 area. The demand zone adds strength to the potential upside.
USDJPY: The Fed & BOJ Likely To Keep Rates In Place. Buy It!Welcome back to the Weekly Forex Forecast for the week of July 28 - Aug 1st.
In this video, we will analyze the following FX market:
USDJPY
The FED and BOJ are expected to keep their perspective interest rates, come Wednesday. The USD is stabilizing, a US-Japanese tariff deal inked, and investors are slowing moving money from the Yen safe haven to riskier assets.
Look for USDJPY to slowly move higher.
Enjoy!
May profits be upon you.
Leave any questions or comments in the comment section.
I appreciate any feedback from my viewers!
Like and/or subscribe if you want more accurate analysis.
Thank you so much!
Disclaimer:
I do not provide personal investment advice and I am not a qualified licensed investment advisor.
All information found here, including any ideas, opinions, views, predictions, forecasts, commentaries, suggestions, expressed or implied herein, are for informational, entertainment or educational purposes only and should not be construed as personal investment advice. While the information provided is believed to be accurate, it may include errors or inaccuracies.
I will not and cannot be held liable for any actions you take as a result of anything you read here.
Conduct your own due diligence, or consult a licensed financial advisor or broker before making any and all investment decisions. Any investments, trades, speculations, or decisions made on the basis of any information found on this channel, expressed or implied herein, are committed at your own risk, financial or otherwise.

USDJPY Setup: Prime Buy Zone with a Clear Target!Good morning my friends,
I've prepared a fresh USDJPY analysis just for you.
Currently, the most logical buy zone sits at 147.170. If price reaches this level and performs a retest, it’s likely to target the 149.185 level.
I'll personally be entering at 147.170 and waiting for my target: 149.000.
This setup is based on the 4-hour timeframe, so it may take some time to reach the target.
Every single like you give is a major source of motivation for me to keep sharing these analyses.
Thanks so much to everyone supporting with a like!

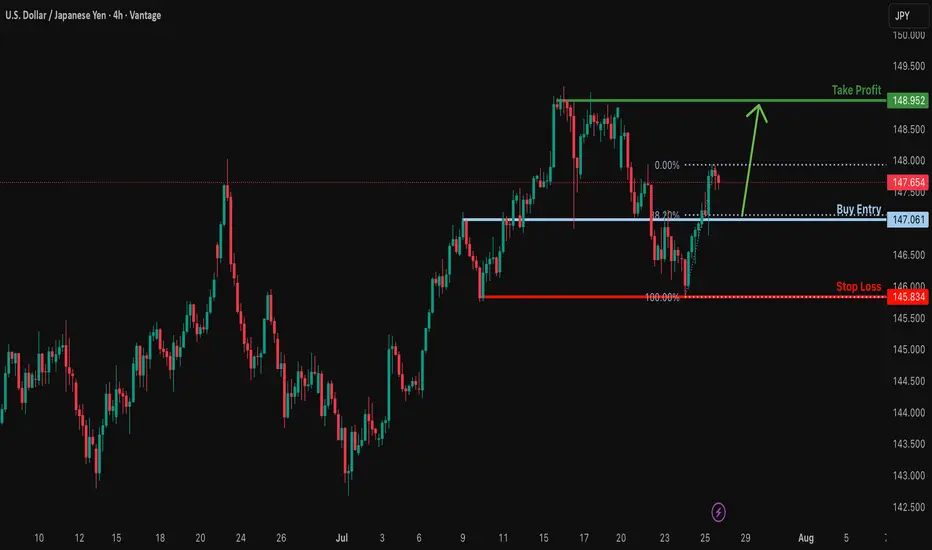
Could the price bounce from here?USD/JPY is falling towards the support level, which is an overlap support that aligns with the 38.2% Fibonacci retracement and could bounce from this level to our take-profit.
Entry: 147.06
Why we like it:
There is an overlap support that aligns with the 38.2% Fibonacci retracement.
Stop loss: 145.83
Why we like it:
There is a multi-swing low support.
Take profit: 148.95
Why we like it:
There is high swing resistance.
Enjoying your TradingView experience? Review us!
Please be advised that the information presented on TradingView is provided to Vantage (‘Vantage Global Limited’, ‘we’) by a third-party provider (‘Everest Fortune Group’). Please be reminded that you are solely responsible for the trading decisions on your account. There is a very high degree of risk involved in trading. Any information and/or content is intended entirely for research, educational and informational purposes only and does not constitute investment or consultation advice or investment strategy. The information is not tailored to the investment needs of any specific person and therefore does not involve a consideration of any of the investment objectives, financial situation or needs of any viewer that may receive it. Kindly also note that past performance is not a reliable indicator of future results. Actual results may differ materially from those anticipated in forward-looking or past performance statements. We assume no liability as to the accuracy or completeness of any of the information and/or content provided herein and the Company cannot be held responsible for any omission, mistake nor for any loss or damage including without limitation to any loss of profit which may arise from reliance on any information supplied by Everest Fortune Group.
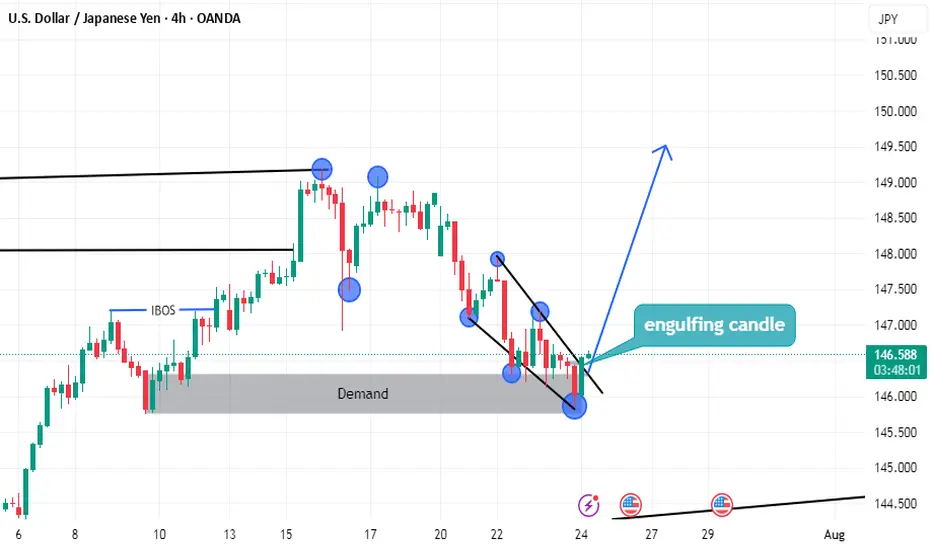
USDJPY LONG setupsimply
we have demand
and the price can't lower low
end we have break of structure on low time frame
and we have more but i don't have enough time to tell you
Look the photo well