JPYUSD trade ideas

USDJPY BUY Setup🗾 USDJPY BUY Setup – Reversal from Demand Zone (H1 Analysis)
📅 22 July 2025
USDJPY has shown strong bearish momentum recently, but price has now tapped into a clear demand zone (marked in green), which previously acted as a launchpad for bullish moves.
🟦 Entry: Buy @ 146.37
🔵 SL: Below 146.00 (just beneath demand zone)
🟩 TP: 149.10 – targeting the recent H1 structure high
🔍 Why I took this trade:
• Clean reaction from a historical demand zone
• Strong rejection wick forming on the hourly
• RSI divergence and volume exhaustion confirmed the buy
• Risk-to-reward ratio > 3:1
⏳ Waiting for confirmation on lower timeframes (M15/M5) before scaling in further.
📊 Let’s see how this plays out – following price action closely!

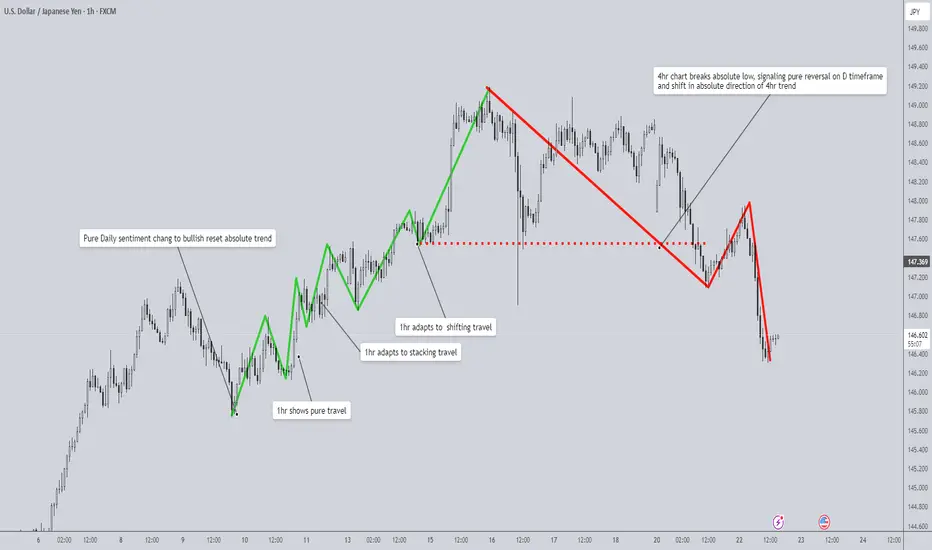
Market Travel: An Adaptive Framework for Tracking Structure🧭 Understanding Market Travel: An Adaptive Framework for Tracking Structure Manually
Market structure can be one of the most challenging patterns to read. There are tools and methods to help interpret it, but none are absolute. As market speed and volatility shift, so does its behavior. That’s why it’s important to move beyond rigid definitions and start understanding how price travels through the market.
What Is Travel?
“Travel” is a concept I developed through personal study and chart work. As price moves, it naturally forms pullbacks—temporary dips toward the weak side—and breaks—moves that close beyond the strong side. These are the two critical phases that form the backbone of market structure.
While most people focus on static patterns, I’ve found more value in learning how price travels through its pullbacks and breaks. These movements aren’t random—they follow clear behavioral patterns. Once you learn to identify these, structure becomes easier to read across timeframes.
The Three Modes of Travel
I've observed three types of travel that occur between the dip and the break:
1. Pure Sentiment Travel
This is the cleanest and most decisive form of travel. Price moves in one dominant direction with little to no opposing candles. For example, in a daily uptrend, the pullback might consist entirely of bearish 4H candles. As soon as a strong bullish candle appears, that typically signals the return toward the trend’s strong high.
2. Stacking Travel
Stacking is more nuanced. Price moves with alternating bullish and bearish candles, but the dominant sentiment stays in control.
Let’s say price is dipping in a daily uptrend. On the 1H chart, you may see a bearish sequence that includes a few bullish candles. These bullish candles don’t invalidate the bearish structure because they fail to close above the pivot high formed between the last bullish leg and the beginning of the bearish move. As long as that high is respected, the bearish stacking is valid.
Once price breaks that high (or, in a bullish stacking case, breaks the pivot low), the stacking order is broken, and that signals a reversal back toward the dominant direction.
3. Shifting Travel
Shifting travel looks similar to stacking but is constantly flipping between bullish and bearish stacking. Each shift creates a new high or low within the shifting structure. These micro-structures form lower lows or higher highs as sentiment switches back and forth.
Once price breaks its own shifting structure (e.g., breaks a bearish sequence with a bullish close), this typically signals the end of that leg of travel and a reversal toward the dominant higher timeframe trend.
How to Apply Travel Across Timeframes
These three types of travel operate in a hierarchy:
- Shifting travel (LTF) respects stacking travel (MTF)
- Stacking travel (MTF) respects pure travel (HTF)
- Pure sentiment travel (HTF) is the master mode that resets the others
When you identify a new pure sentiment shift on the higher timeframe, that becomes your reset point. From that candle forward, you should begin fresh stacking and shifting analysis on your lower timeframes.
Workflow example:
1. Spot a pure sentiment shift on the HTF (e.g., bullish daily candle after a clean bearish pullback)
2. From that pivot low, begin tracking stacking travel on the MTF
3. Use shifting travel on the LTF to navigate inside the stacking structure
If stacking or shifting behavior breaks unexpectedly, that usually means market speed is changing—and you may need to reassign which timeframes serve as HTF, MTF, and LTF.
Why This Works
This framework gives you a fixed point of structure—the dip and the break—but allows you to adapt to the behavior in between. Instead of just reacting to breakouts, you're learning how price moves to get there.
That’s what gives you the edge: not just reading where price is, but how it’s traveling to get there.
Final Thoughts
This adaptive travel model helps break down market structure into something both trackable and flexible. Try observing these travel types in real time and let me know how it works for you.
Tools & Resources
If you’d like to access my Pure Order Flow indicator and more exclusive tools, visit my TradingView profile:
@The_Forex_Steward
I’ve built an arsenal of indicators designed to support this framework across different markets and styles. If this breakdown helped, don’t forget to boost the post so others can benefit from it too!
USDJPY Exposed Bullish zone Key Reversal Zones
Bullish Reversal: 146.450
If price breaks above with confirmed surge in volume (relative to recent baseline), initiate long.
Breakout Confirmed: Price closes beyond reversal level (not just taps). Volume Surge: Spike exceeds previous 3–5 bar average; look for institutional signature (non-retail flow) Trap Signature: Prior candle(s) must show wicks or indecision = fuel for move.
Breakout Compression: Low volume chop signals energy build-up. Sudden spike at level = intention exposed. Through: 2nd candle must confirm; hesitation = abort. Rapid thinning above/below = hidden hands preparing.
The price breaks — but the volume reveals.”
Don’t front-run memory levels. Let the market show its hand, then strike with precision.
Ready for deployment. Set alerts at 146.450 and 147.350.
Monitor volume, not emotion.
Would you like a trade log template or live tracking sheet for this setup?

USDJPY Bearish Breakout!
HI,Traders !
#USD-JPY was trading along
The rising support line but
Now we are seeing a bearish
Breakout so we are bearish
Biased and we will be expecting
A further bearish move down !
Comment and subscribe to help us grow !

USD/JPY - Potential TargetsDear Friends in Trading,
How I see it,
KEY RESISTANCE AREA @ 147.000 - 147.150
1) 145.940 - Swing Area @ 50% Retracement of July rally
2) As long as price remains below key resistance, watch price reaction
at swing area.
3) If this swing area is decisively breached, 145.000 will be targeted next.
I sincerely hope my point of view offers a valued insight.
Thank you for taking the time study my analysis.

UsdJpy LongFX:USDJPY
Fibo test of 0.786 breakout movement + block order test, on m5, structure break in long, at the top we have targets (Imbalances, gaps and liquidity behind highs)
USDJPY| Bullish Bias - Mitigated OB, Waiting for LTF ConfirmsPair: USDJPY
Bias: Bullish
Price swept deeper liquidity and has now mitigated a key 30M bullish order block.
From the 2H bird’s eye view, structure is still aligned to the upside — but I remain in analysis mode until LTF confirms the shift.
No need to force anything — price is doing its job, and I’m waiting for it to speak clearly through confirmation.
Bullish structure still in play, but we wait for the perfect moment.
#USDJPY #SMC #bullishbias #orderblock #structuretrader #inducementking
Bless Trading!

Market Overview/Trade RecapsKeep it simple guys keep learning keep getting better every single day find put what you need to become profitable

USDJPYDate:
July 22,2025
Session:
Tokyo and London session
Pair:
USDJPY
Bias:
Long
1. Clean liquidity pool left unswept from last week's NYC Open (Thursday).
Took this trade earlier today but looks like price wanted to consolidate in the liquid pool its currently in. I still hold the same idea and think the sweep will definitely take place sometime this week. Now looks like the perfect time to enter. If Asia session cant get it done its up to London and New York session.
Entry:147.534
Stop Loss:147.215
Target:148.768
RR:3.89

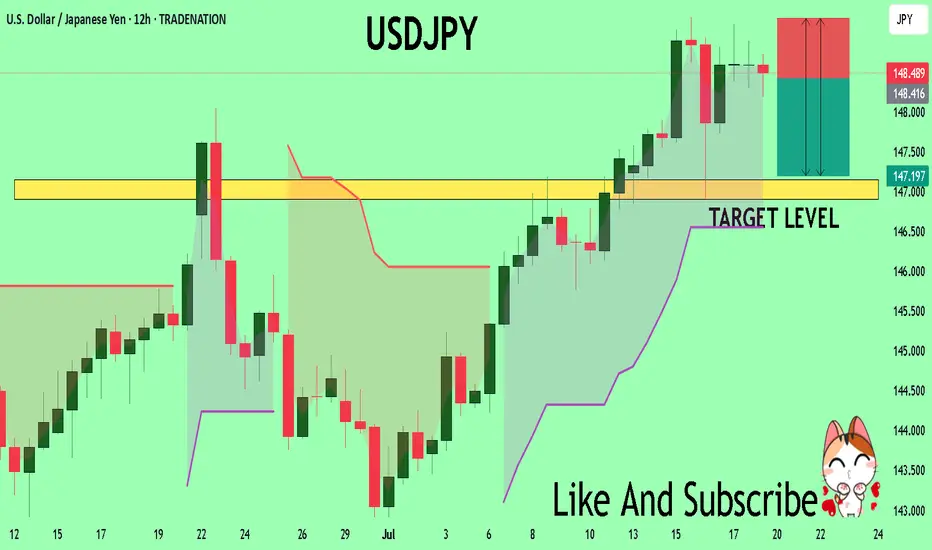
USDJPY Under Pressure! SELL!
My dear friends,
Please, find my technical outlook for USDJPY below:
The instrument tests an important psychological level 148.46
Bias - Bearish
Technical Indicators: Supper Trend gives a precise Bearish signal, while Pivot Point HL predicts price changes and potential reversals in the market.
Target - 147.15
Recommended Stop Loss - 149.17
About Used Indicators:
Super-trend indicator is more useful in trending markets where there are clear uptrends and downtrends in price.
Disclosure: I am part of Trade Nation's Influencer program and receive a monthly fee for using their TradingView charts in my analysis.
———————————
WISH YOU ALL LUCK
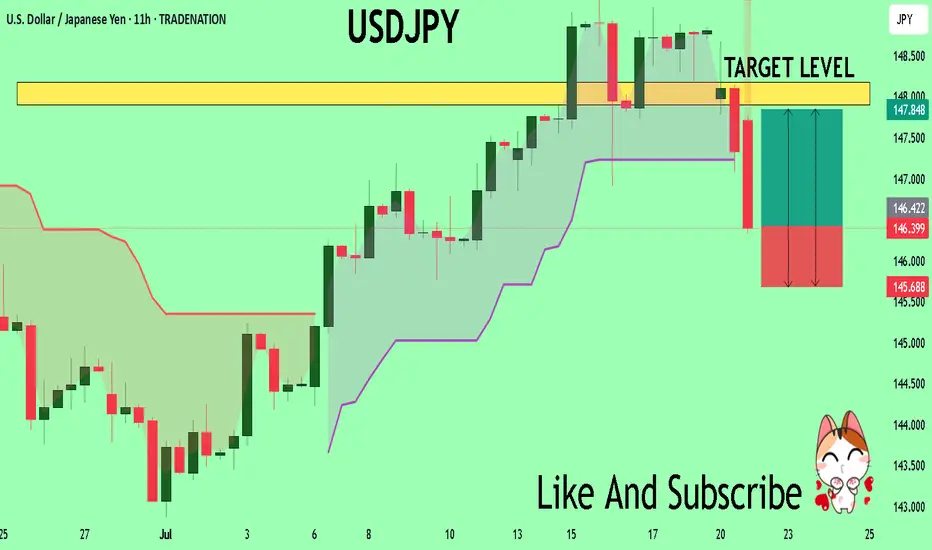
USDJPY Sellers In Panic! BUY!
My dear subscribers,
My technical analysis for USDJPY is below:
The price is coiling around a solid key level - 146.36
Bias - Bullish
Technical Indicators: Pivot Points Low anticipates a potential price reversal.
Super trend shows a clear buy, giving a perfect indicators' convergence.
Goal - 147.90
My Stop Loss - 145.68
About Used Indicators:
By the very nature of the supertrend indicator, it offers firm support and resistance levels for traders to enter and exit trades. Additionally, it also provides signals for setting stop losses
Disclosure: I am part of Trade Nation's Influencer program and receive a monthly fee for using their TradingView charts in my analysis.
———————————
WISH YOU ALL LUCK
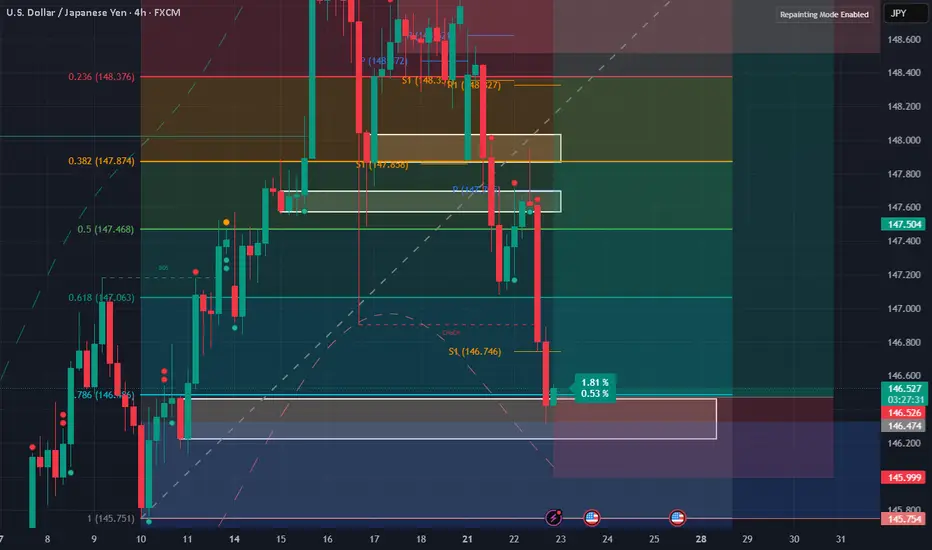
USDJPY Smart Money Analysis – Bearish OutlookAfter a confirmed 1-hour bearish divergence @149.202, price initiated a downward structure. We saw a bounce from a bearish 4H Order Block (OB) @147.356, but this bounce did not invalidate the initial bearish divergence structure.
Price then broke below that 4H OB slightly, before retracing back into the same OB zone, forming another 4H bearish OB at that level, indicating reinforced institutional interest. This was followed by a clean CHoCH @146.943, confirming further bearish pressure.
Price reacted next from a bullish 4H OB @146.496, initiating a short-term retracement.
📌 Expectations:
🔁 We expect price to retrace back into the newly created 4H bearish OB @147.626, which is a refined point of interest.
📉 If that level holds as expected, the bearish move is likely to continue towards the next bearish OB sitting around 145.148, which is a potential demand exhaustion zone.
🧠Summary of Key Zones:
1H Bearish Divergence: 149.202
Initial 4H Bearish OB: 147.356
CHoCH Confirmation Level: 146.943
Bullish OB Reaction: 146.496
Expected Retracement POI (4H OB): 147.626
Final Bearish Target OB: 145.148
⚠️Risk Management Note:
This analysis is based on Smart Money Concepts and market structure observation.
Always use proper risk management — risking no more than 1–2% of your capital per trade.
Ensure your stop-loss and lot sizes match your account equity.
News events and volatility can invalidate technical zones quickly.
Trade safe. 🧠💼📉


USDJPY Correction Complete, Is the Bullish Trend Back in play?After pulling back from the recent high near 149.17, USDJPY has shown signs of strength again, rebounding off the confluence support at the ascending trendline. The bullish narrative is supported by a hawkish FOMC tone and news that a U.S. federal court temporarily blocked Trump-era tariffs. The pair now awaits upcoming U.S. economic data for further directional clarity.
🔍 Technical Outlook – Structure & Momentum
✅ Primary trend: Bullish
✅ Correction phase: Completed near CP zone and trendline
✅ Key structural areas: FVG Zone, CP Zone, and trendline remain intact
Price has responded positively from the CP Zone + OBS Buy Zone around 147.438, aligning with the uptrend line. As long as this structure holds, buyers may push the market toward the next resistance zones.
🧭 Trade Scenarios
🔸 Bullish Bias (preferred scenario):
As long as price holds above 147.438, we expect continuation toward the FVG zone, with immediate targets at the GAP + OBS Sell Zone (148.703) and extended potential to the Buy-side Liquidity zone at 149.122.
A clean breakout above 149.122 opens the door to Fibonacci extensions: 149.72 and 150.05.
🔹 Bearish Scenario (if invalidated):
If price breaks below 147.438 and loses the trendline, we may see a deeper drop toward the Liquidity Buy Zone at 146.825, where strong buying interest is expected to re-enter the market.
⚠️ Macro Risk Drivers
Hawkish FOMC minutes continue to support USD strength
Paused trade tariffs reduce political headwinds, improving risk sentiment
Upcoming U.S. economic data could trigger sharp intraday moves → watch closely
📌 Key Price Zones
Liquidity Buy Zone 146.825 Major long re-entry zone
CP + OBS Buy Zone 147.438 Current active support
FVG Zone 148.20 – 148.68 Intraday bullish target
GAP + OBS Sell Zone 148.703 Short-term resistance
Buy-side Liquidity Zone 149.122 Final bullish objective
💬 Structure remains bullish unless the trendline breaks. Stay patient, wait for confirmations at key zones, and follow your plan with disciplined risk management.

USDJPYUSDJPY showing short-term bearish momentum due to potential pullback and risk-off sentiment, but the long-term outlook remains bullish supported by U.S.–Japan rate differentials and BoJ's dovish stance.


Japan's coalition loses majority, yen higherThe Japanese yen has started the week with strong gains. In the European session, USD/JPY is trading at 147.71, down 0.07% on the day.
Japanese Prime Minister Ishiba's ruling coalition failed to win a majority in the election for the upper house of parliament on Sunday. The result is a humiliating blow to Ishiba, as the government lost its majority in the lower house in October.
The stinging defeat could be the end of the road for Ishiba. The Prime Minister has declared he will remain in office, but there is bound to be pressure from within the coalition for Ishiba to resign.
The election result was not a surprise, as voters were expected to punish the government at the ballot box due to the high cost of food and falling incomes. The price of rice, a staple food, has soared 100% in a year, causing a full-blown crisis for the government, which has resorted to selling stockpiled rice from national reserves to the public.
The election has greatly weakened Ishiba's standing, which is bad news as Japan is locked in intense trade talks with the US. President Trump has warned that he will impose 25% tariffs on Japanese goods if a deal isn't reached by August 1. Japan is particularly concerned about its automobile industry, the driver of its export-reliant economy.
The Bank of Japan meets on July 31 and is widely expected to continue its wait-and-see stance on rate policy. The BoJ has been an outlier among major central banks as it looks to normalize policy and raise interest rates. However, with the economic turbulence and uncertainty due to President Trump's erratic tariff policy, the Bank has stayed on the sidelines and hasn't raised rates since January. Japan releases Tokyo Core CPI on Friday, the last tier-1 event before the rate meeting.
There is resistance at 148.39 and 149.08
147.95 and 147.70 are the next support levels
USDJPY short position 22/07/2025English : According to our analysis, we anticipate a bearish scenario.
Morocan Darija : kanchofo d'apres l'analyse dyalna antsanaw hboot
ATENTION : I only share my ideas, not signals

USDJPY Analysis : Trendline Breakout, Liquidity Trap & MMC Zone🔍 Full Technical Breakdown:
In today’s USDJPY 2H chart, the market is unfolding exactly as per Mirror Market Concepts (MMC). We’ve identified a clean trendline breakout, and now price is reacting between the Central Zone (50%) and the Next Reversal Zone, where liquidity is expected to be filled. Let's break down each zone and movement to understand how price is being manipulated and where we can take action.
🔵 1. Trendline Confirmation – The First Sign of Strength
The trendline was tested multiple times from the top, acting as resistance. But recently, price broke above this line with strength, signaling a potential bullish reversal. You've rightly marked it as "Trendline Confirmation" — this is where structure shifted from bearish to bullish.
This is a classic MMC principle — breakout above manipulated resistance, followed by a pullback for re-entry.
The breakout wasn’t just a wick; it had body strength, indicating real buyer presence.
Now, price is pulling back to retest the trendline from above, a typical MMC behavior before continuing upward.
⚖️ 2. Central Zone – The 50% Trap
This zone represents the midpoint of the last major impulsive move. It's where most traders get confused, and institutions re-balance their entries.
You've highlighted: “It Can Reverse From Its 50% Zone” – and that’s accurate.
According to MMC, this is where smart money traps late sellers, takes liquidity, and initiates the next bullish leg.
If price holds above the 147.200–147.500 zone, we could see buyers stepping in aggressively.
🟩 3. Liquidity Fill – Next Reversal Zone
If price doesn’t hold the Central Zone, we don’t panic — this is where MMC becomes powerful.
Beneath current structure lies liquidity — previous stop hunts and unfilled orders.
That area is your Next Reversal Zone around 146.200–146.400.
It’s a liquidity trap — market might dip there just to manipulate emotional traders, then reverse with force.
This is exactly where you’ve written “Liquidity Will Fill” — meaning smart money might fill orders there before moving up.
🧭 Possible Price Paths:
🔼 Bullish Scenario (High Probability):
Trendline retest holds as support.
Price bounces from the 50% Central Zone.
Targets: 148.800 – 149.200 (previous highs and clean breakout zone).
Confirmation: Bullish engulfing candle or strong wick rejection at Central Zone.
🔽 Bearish Trap Scenario (MMC-Based):
Price dips below Central Zone into liquidity zone.
Traps sellers and triggers stop-losses.
Reverses sharply from Next Reversal Zone (Liquidity Zone).
This is where smart money positions themselves for the real move up.
🧠 MMC Insight:
This structure is textbook MMC – clean manipulation zones, false breakout traps, and a trending bias powered by smart liquidity plays.
Trendline breakout = initial intent
Central zone = confusion zone
Liquidity trap = entry for smart money
📢 The goal is not to predict, but to react with precision when the market reveals its hand.
🕒 Timeframe: 2H
📌 Strategy: Mirror Market Concepts (MMC) | Trendline + Liquidity + Midpoint Trap
📈 Bias: Bullish, but waiting for confirmation at either Central or Liquidity Zone
🔍 Sentiment: Cautiously Optimistic

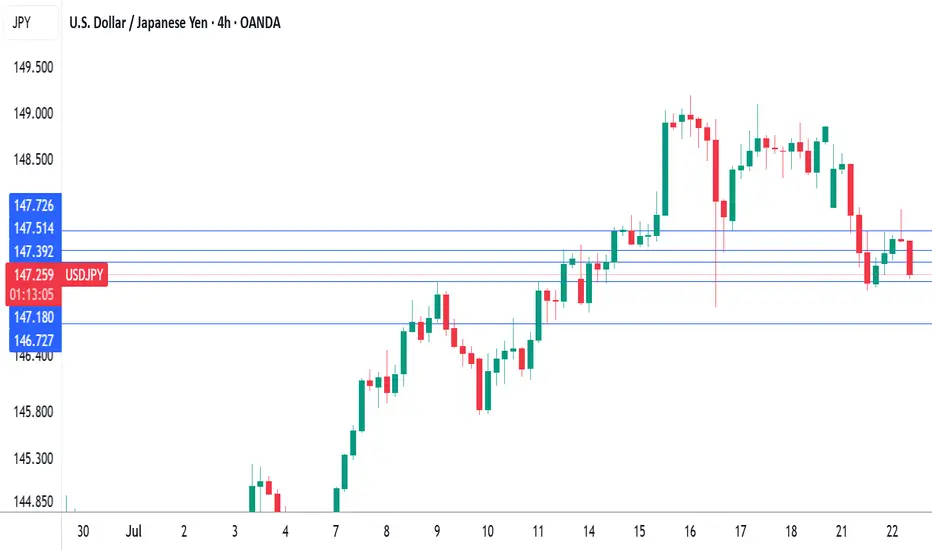
USDJPY ShortPrice in currently on a downtrend on the 4H timeframe. Price formed an orderblock on the 15 min timeframe and a FVG on the 15 min timeframe after the orderblock had formed. Stoploss is at 147.580 and take profit is at 147.160

USD/JPY probable move Target 1 waiting for confirmationWaiting for confirmation on candles and Real Volume 5min or 15min (power of Real Volume)-without real volume I am like a blind man in a dense forest :)
Tools:
- real volume (proper interpretation)
- Fibonacci expansion ABC (an additional, new goal every day)
- Fibonacci retracement (combined with the real volume, it shows me the real probable movement for the next hours and days)
- volume support and resistance levels (confirmation of the price recovery level)
- oversold/overbought index (focusing on 1H and 4H something is already overvalued or undervalued)
- candlestick patterns (my entry point for 5 minutes or 15 minutes candlestick formations confirmed by particularly increasing volume).

146.6 gap hike. With all of the other pairs basically closing their gap against JPY, the only one left is usd!
