USDJPY Potential DownsidesHey Traders, in today's trading session we are monitoring USDJPY for a selling opportunity around 143.200 zone, USDJPY is trading in a downtrend and currently is in a correction phase in which it is approaching the trend at 143.200 support and resistance area.
Trade safe, Joe.
JPYUSD trade ideas

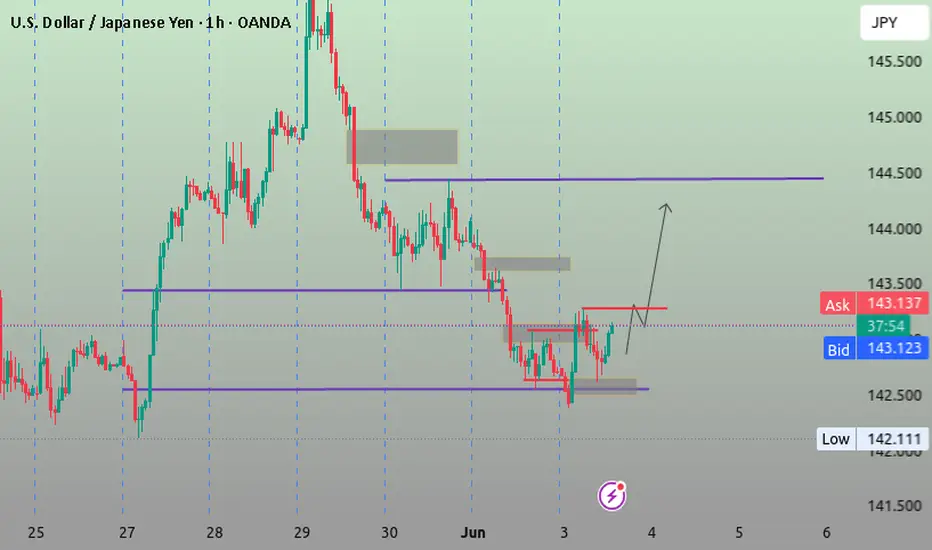
I am a seller again. Market created a lower high after retracing strongly — this gives us a perfect setup to ride the next bearish leg if breakdown is confirmed.

USDJPY Short: Update to wave counts and stop lossThis is a follow-up to my USDJPY short earlier. In the previous video, I mentioned that USDJPY can retrace up to start of wave 1 (144.41) but propose a tighter stop. You would have been stopped out if you had used that stop. But right now, you will be able to enter the short at a better price and set a proper stop that will invalidate the EW count.

UsdJpy could break 142 and fall 500 pipsSince early May, I’ve been highlighting the 142 support zone on USDJPY as a potential reversal area — with a suggested upside target at 146.
The market respected this level twice, reversing from 142 and rallying past 146 both times.
However, last week’s move into 146 was sharply rejected, forming a strong daily Pin Bar exactly at resistance — a classic sign of exhaustion.
Now, price is rolling back toward support, and after multiple tests of the 142 zone, we may be very close to a downside break.
🧩 Add to this the fact that DXY also looks ready to break lower, and the probability of a USDJPY fall increases even more.
📉 Trading Plan:
Sell rallies, with invalidation above 146, and a target at 137, aiming for a 1:2 risk-reward setup.
Disclosure: I am part of TradeNation's Influencer program and receive a monthly fee for using their TradingView charts in my analyses and educational articles.

Prices are testing the 142.55 support level.Bank of Japan (BOJ) Governor Kazuo Ueda stated on Tuesday that the central bank would raise interest rates if the economy re-accelerates, adding that wage growth must regain momentum. Currently, Trump's tariff policies have dimmed the economic outlook, making it potentially not the optimal time for a rate hike. However, policymakers stand ready to raise rates if the economy rebounds after a brief pullback. The remarks bolstered the Japanese yen, with prices now testing the 142.55 support level. A decisive break below this level would form a lower low, confirming the continuation of the downtrend and shifting bearish targets toward the 140.01 support level.
Humans need to breathe, and perfect trading is like breathing—maintaining flexibility without needing to trade every market swing. The secret to profitable trading lies in implementing simple rules: repeating simple tasks consistently and enforcing them strictly over the long term.
Trading Strategy:
sell@144.50-145.00
TP:143.00-142.50

USD/JPY – Bearish Opportunity DevelopingThe pair is currently showing signs of potential reversal after a sharp bullish retracement that reached a previously respected supply zone. Price action is reacting to a key area where sellers have shown strength in the past, suggesting that this upward move could be a liquidity grab before a new leg down.
On the 1-hour timeframe, the RSI has entered overbought territory, signaling a possible momentum exhaustion. This aligns with a technical structure where the market has maintained a bearish bias despite the recent recovery rally.
The broader context still supports a downside continuation, especially considering the macro pressure from U.S. monetary policy divergence and the yen’s historical reaction to overextended bullish waves in this pair.
📊 We’re watching for signs of confirmation, such as bearish engulfing patterns or rejections with volume divergence, which could strengthen the bearish thesis in this region.
Patience and discipline remain key — we're not trading the noise, we're trading the reaction to structure.

CHECK USDJPY SIGNAL READ CAPTAINCHECK (usdjpy) buy zone
( TRADE SATUP)
ENTRY POINT (142.700) to (142.800) 📊
FIRST TP (143.100)
2ND TARGET (143.550) 📊
LAST TARGET (144.050) 📊
STOP LOOS (142.250)❌

CHECK USDJPY SIGNAL READ CAPTANusdjpy) buy zone
( TRADE SATUP)
ENTRY POINT (142.850) to (142.750) 📊
FIRST TP (143.150)
2ND TARGET (143.550) 📊
LAST TARGET (143.900) 📊
STOP LOOS (142.350)❌

USDJPY Bullish Reversal Harmonic PatternUSDJPY on 1hr time frame making the bullish diversion on RSI indicator and potential reversal zone according to XABCD bullish reversal harmonic pattern

Tuesday follow up Today we have the JOLTS JOB REPORT due at 10am est
Key takeaways
Job openings, Quits Rate, and Hires vs Openings
Job openings: a higher number shows strong demand for labor hinting at a tight labor market
Quits Rate: A higher quit rate could mean workers are confiednt they can find better opportunities
Hires V Openings: When job openings are on the rise faster than hires that could show a skill mismatch or labor shortage
This report will cover April 2025, the report typically has a 5 week lag, and the April data should reflect employment conditions as of late March.
As it relates to USD/JPY: A strong report reflects the status of job openings and quits this will show strengthen USD. A stronger labor market could increase expectations the fed might raise interest rates or keep them higher for longer
A weaker report could lead to more consolidation or a stronger yen which result in a decreasing dollar
We are looking for an increased value from 7.192 on the last report or around that same value
Yesterday's trade: I typically don't trade early in the week but per my callout on my last idea if you took my buy reversal there was minimum drawback if you used proper analysis
ie: wait for open and close below price for sell and above for buy ideally you would want to get in around 142.706, however the reversal took place at 142.429
If you entered on at the price 142.579 there was minimal drawback.
I entered at 142.706 price is currently at 143.570 please use correct risk management for account growth

Why I Think USDJPY Will Sell...Technical AnalysisHey Rich Friends,
Happy Tuesday! I wanted to share my USDJPY analysis and why I think it will sell. This is only a technical analysis so please check the news and cross-reference your own charts. Here is what I am looking at:
- Momentum is picking up for the sellers with red candles forming on H4, H1 and M15.
- The stoch is facing down, both lines have crossed below 80, slow line (orange) is above the fast line (blue) which is a bearish confirmation for me.
Additional information:
- I will also wait to see if both lines of the stoch cross below 50 to confirm the down trend.
- I will be setting sell stops and using previous highs as my SL and previous lows as my TPs.
Good luck if you decide to take this trade, let me know how it goes.
Peace and Profits,
Cha

USDJPY H1If the price comes back and closes below 143,200, we can go short with TP at 142,400 and SL at 143,700 ... what do you say? :) We also have a nice divergence there ...
I think for now the price is going up just to hunt some SL`s

USD/JPY M15 Support & Resistance Levels🚀 Here are some key zones I've identified on the 15m timeframe.
These zones are based on real-time data analysis performed by a custom software I personally developed.
The tool is designed to scan the market continuously and highlight potential areas of interest based on price action behavior and volume dynamics.
Your feedback is welcome!


BOJ Hawkish Tone Fails to Lift YenThe Japanese yen fell past 143 per dollar on Tuesday, ending a three-day gain, despite BOJ Governor Kazuo Ueda hinting at potential rate hikes if conditions improve. Ueda pointed to steady recovery and firm corporate performance. A stronger U.S. dollar also weighed down the yen, as markets shrugged off weak U.S. data and rising trade tensions. Trump's plan to double metal tariffs further pressured Japan’s steel sector. Investors await upcoming labor and spending data.
The key resistance is at $143.50 meanwhile the major support is located at $142.85.

USDJPYJust a thought , Understand first we're looking at a reversal , those are not for the faint of hearts , They can be rough with a lot of people looking to just destroy the pair once and for all, Mind you a lot more money wants to save it , we're talking about two of the most stable currencies , Lets see who wins , Hope you leverage the right side .
USDJPY forms textbook head and shoulders patternOur last bearish call on USDJPY played out perfectly. Now, a new setup is forming. With US ISM data showing contraction and stock markets under pressure, the dollar-yen could be next to drop. Watch as we break down the textbook head and shoulders pattern and the levels to watch for a potential 600+ pip move. Target zones, risk-reward, and key breakout levels all included.

USDJPY Analysis todayHello traders, this is a complete multiple timeframe analysis of this pair. We see could find significant trading opportunities as per analysis upon price action confirmation we may take this trade. Smash the like button if you find value in this analysis and drop a comment if you have any questions or let me know which pair to cover in my next analysis.

Bearish reversal off 50% Fibonacci resistance?USD/JPY is rising towards the pivot, which aligns with the 50% Fibonacci retracement and could reverse to the 1st support, a pullback level.
Pivot: 144.37
1st Support: 141.94
1st Resistance: 146.17
Risk Warning:
Trading Forex and CFDs carries a high level of risk to your capital and you should only trade with money you can afford to lose. Trading Forex and CFDs may not be suitable for all investors, so please ensure that you fully understand the risks involved and seek independent advice if necessary.
Disclaimer:
The above opinions given constitute general market commentary, and do not constitute the opinion or advice of IC Markets or any form of personal or investment advice.
Any opinions, news, research, analyses, prices, other information, or links to third-party sites contained on this website are provided on an "as-is" basis, are intended only to be informative, is not an advice nor a recommendation, nor research, or a record of our trading prices, or an offer of, or solicitation for a transaction in any financial instrument and thus should not be treated as such. The information provided does not involve any specific investment objectives, financial situation and needs of any specific person who may receive it. Please be aware, that past performance is not a reliable indicator of future performance and/or results. Past Performance or Forward-looking scenarios based upon the reasonable beliefs of the third-party provider are not a guarantee of future performance. Actual results may differ materially from those anticipated in forward-looking or past performance statements. IC Markets makes no representation or warranty and assumes no liability as to the accuracy or completeness of the information provided, nor any loss arising from any investment based on a recommendation, forecast or any information supplied by any third-party.

JPYUSD Technical Breakdown | Inverse Head & Shoulders + Target🔍 Pattern Breakdown: Inverse Head & Shoulders (H&S)
We’ve identified a textbook Inverse Head & Shoulders pattern, a classic bullish reversal formation that often appears at the end of a downtrend. Here's how the structure played out:
Left Shoulder:
The initial drop formed a local low, followed by a short recovery, creating the first "shoulder" on the left.
Head:
A deeper push down formed the lowest point of the pattern, indicating a possible trap for sellers or exhaustion in bearish momentum. This is the "head" and the key anchor of the pattern.
Right Shoulder:
A higher low forms, showing buyers stepping in earlier and with more strength. This symmetry confirms the structure and signals a potential reversal in trend.
Neckline:
Drawn across the highs between the shoulders, this key resistance line was broken decisively, confirming the bullish pattern and triggering an upward breakout.
📌 Trendline + Retest Zone = Confluence Support
After the breakout above the neckline:
Price surged strongly, showing confidence in the reversal.
It pulled back gently to retest the neckline, which now acts as support.
This retest also aligns with the upward trendline, adding confluence — a strong signal in technical trading that increases the probability of a successful continuation move.
This zone is labeled on the chart as:
🟦 “Like a Retesting Zone After Boom” — a perfect description of what’s occurring.
🎯 Target and Resistance Zones
The price is now moving toward a major resistance zone marked between 0.007020 – 0.007060, with a target zone slightly above at 0.007080.
These zones represent historical selling pressure or supply areas. A breakout above this region would open doors to even higher levels, signaling strong bullish continuation.
📈 Why This Setup Matters (MMC Strategy Applied)
Using the Market Mapping Concept (MMC) approach, this trade idea combines:
Market structure (Inverse H&S pattern)
Momentum confirmation (strong bullish move after breakout)
Zone mapping (support/resistance confluence)
Trendline validation (clean structure with pullback respect)
This creates a well-defined trade setup with clear entry and exit logic, excellent risk-to-reward potential, and technical confirmation.
✅ Summary: Bullish Outlook With Managed Risk
Bias: Bullish continuation as long as price holds above the neckline/trendline zone.
Confirmation: Inverse H&S pattern + successful retest.
Target: 0.007060–0.007080 resistance zone.
Invalidation: Break below 0.006980 and close under trendline support.
💬 Minds Post Caption (Extended)
🔥 JPYUSD Ready to Fly? Inverse Head & Shoulders Breakout Spotted!
Clean reversal pattern (H&S) just completed with a strong neckline breakout and a perfect retest at trendline confluence. MMC analysis suggests bullish continuation toward the 0.007060+ resistance zone. Classic "retest after boom" move. Watching price action closely! 🚀📊

Yen Rises Amid Trump Tariff Threat and China DisputeThe Japanese yen rose to around 143.5 per dollar on Monday, marking its third straight session of gains as rising global trade tensions lifted demand for safe-haven currencies. The move followed President Trump’s threat on Friday to double tariffs on steel and aluminum imports to 50% starting June 4. Japanese steelmakers like JFE Holdings and Kobe Steel fell, while Nippon Steel was less affected after Trump praised its planned merger with U.S. Steel. Meanwhile, U.S.-China tensions grew as China denied Trump’s claim of breaching a recent Geneva trade agreement. On the domestic front, Japan’s Q1 capital spending beat expectations, with investment rising across both manufacturing and services, reflecting solid internal momentum.
The key resistance is at $143.50 meanwhile the major support is located at $143.00.

Fast deal USDJPY l9ngHello traders ,
This is a small and fast deal on USDJPY , wishing you good luck

USDJPY Bearish Signal | Technical + Custom AlgoSmart Trend Signal | Technical Analysis + Custom Algorithm
This signal is the result of a combination of classic technical trend analysis and a proprietary software I personally developed.
