Potential Long ScalpUSDJPY tried multiple times to test the bear trend extreme after the 3-Push correction.
It seems like bears can't keep price below the EMA, with gaps getting smaller and smaller at each bear swing.
Now, it's forming sort of a Double Bottom at the bull Trend Line at the end of what seems to be a 2-legged bear move. Chances are that the bears are exhausted and if the current candle closes with a bull body or even a small bear body, there could be a good long scalp.
The problem is that it looks like a Barb Wire too, so any Breakout tend to fail. Still, there could be a good opportunity to enter in second leg after a bullish breakout out of the Double Bottom.
JPYUSD trade ideas

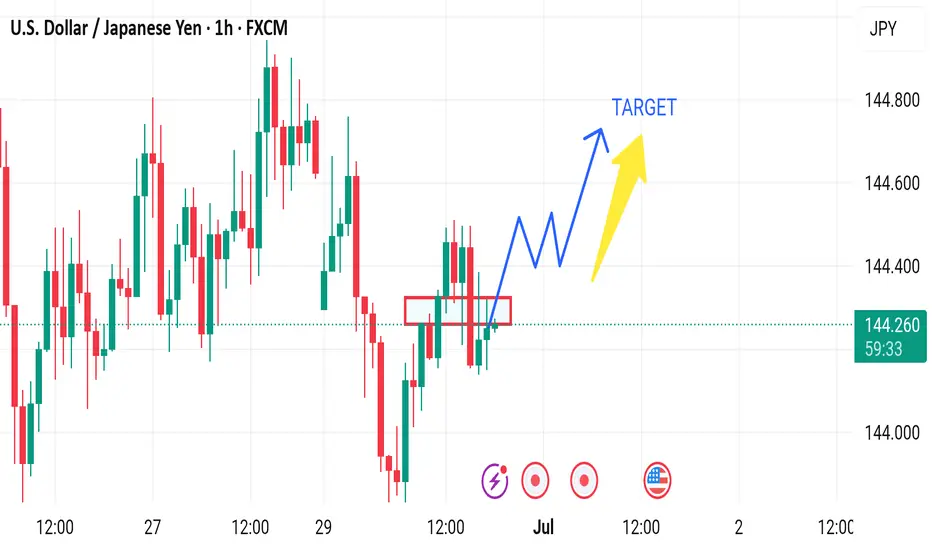
Market next move 🔀 Disruption Analysis – Bearish Alternative Scenario
While the current setup points to a bullish continuation above the support zone (around 144.10–144.20) with a projected target near 144.60, here’s how a bearish disruption could unfold instead:
---
🔻 Bearish Disruption Possibility:
1. Failed Breakout / Bull Trap:
Price may fake a move upward to trap breakout buyers near 144.40–144.50, then sharply reverse.
This would indicate a false breakout and potential reversal setup.
2. Rejection at Resistance:
Repeated failure to close above 144.40 may signal exhaustion.
Bearish divergence could form on momentum indicators (like RSI) as price rises.
3. Break Below Support Area:
A decisive break below the red support zone (around 144.10) may shift momentum bearish.
That would confirm a lower high and suggest downside continuation.
4. Next Bearish Target:
Initial support lies at 143.85, with further potential drop toward 143.60.
USD/JPY Analysis – June 29, 2025
🚨 Don’t miss the opportunity on yen right now.
From a technical perspective, price action has followed our previous projections almost perfectly —
and now, strong fundamental signals are also emerging following the latest BOJ meeting.
📉 This could be a good time for a Sell position:
either from the current level (for aggressive traders),
or slightly higher around the 145 resistance zone.
🎯 The expected target lies around 139,
in line with the broader corrective structure.
This setup offers a high-potential move — especially for those tracking both TA and FA closely.

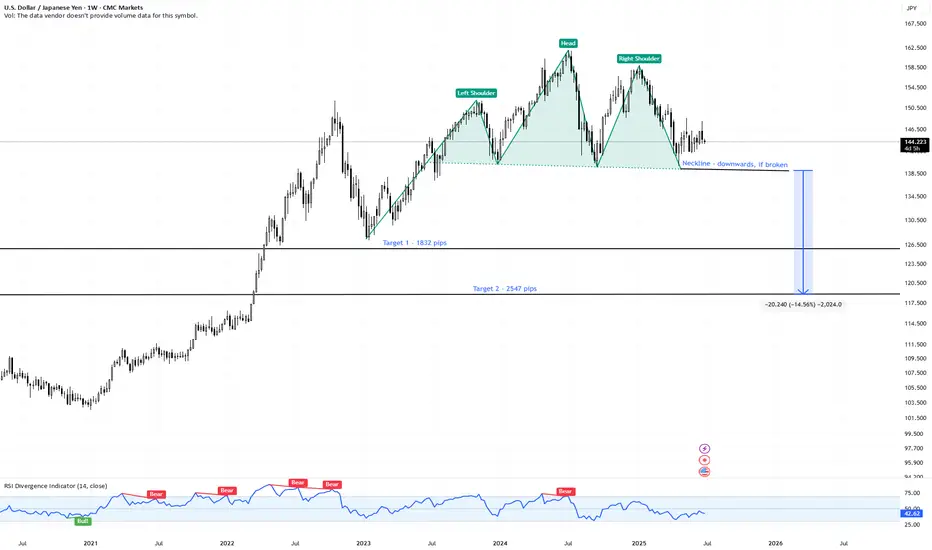
USDJPY | Massive Head & Shoulders Top – 2500+ Pips | Weekly📍 Pair: FX:USDJPY (U.S. Dollar / Japanese Yen)
📆 Timeframe: 1W (Weekly)
📉 Price: 144.22
📊 Pattern: Head & Shoulders (macro top)
🔍 Technical Setup:
USDJPY has formed a textbook Head & Shoulders pattern on the weekly chart, suggesting a potential multi-thousand pip reversal if the neckline fails.
🟩 Left Shoulder – Head – Right Shoulder structure is clear
🔻 Neckline sits near 137.00 – a major support zone
🔺 Pattern took over a year to form — signals significant macro exhaustion
🧠 Trade Plan & Targets:
❗️ Trigger: Weekly close below 137.00 (neckline breakdown)
⛔️ Invalidation: Close back above 151.00 (right shoulder high)
🎯 Target 1: 126.90
→ 📉 Move: -1,832 pips
🎯 Target 2: 118.80
→ 📉 Move: -2,547 pips
🔭 Both targets are based on measured move logic from the height of the head to the neckline, projected downward.
⚠️ Key Observations:
Sideways price action forming the right shoulder = distribution zone
Breakdown would shift trend from bullish to bearish on a long-term scale
Potential for carry trade unwind and safe-haven yen demand if macro tensions rise
💬 Are we on the verge of a major USD reversal vs the yen?
📌 Watch for a confirmed weekly break below 137.00 — this setup could define Q3–Q4.
#USDJPY #Forex #HeadAndShoulders #JPYStrength #TrendReversal #TechnicalSetup #TargetTraders
Bearish bias on USDJPYdouble tops
lower lows created
50 and 14 ema cross
bearish indecision candle form = reversal

USDJPY: Intraday Bearish ConfirmationLast week, I shared an update on a confirmed structure breakout for 📉USDJPY on a 4-hour chart.
On retesting the broken structure, the price showed a strong bearish signal.
I observed a rising wedge pattern with a broken support line
This breakout suggests a high likelihood that the price will decline to the 143.81 / 143.31 levels.

USD/JPY - bearish turning to bullish?4H bearish FVG has been mitigated
30min price action fast approaching bearish FVG above. If that is mitigated, this pair could fly upwards
Please share your thoughts

Fundamental Market Analysis for June 30, 2025 USDJPYThe USD/JPY pair is attracting some sellers towards 143.85 during the Asian session on Monday. The U.S. dollar (USD) is weakening against the Japanese yen (JPY) amid rising bets for a Federal Reserve (Fed) interest rate cut.
The United States (US) and China are close to a deal on tariffs. However, U.S. President Donald Trump abruptly ended trade talks with Canada, adding uncertainty to the market's positive outlook.
In addition, traders are betting that the U.S. central bank will cut rates more frequently and possibly sooner than previously expected. Markets estimate the probability of a quarter-point Fed rate cut at nearly 92.4%, up from 70% a week earlier.
On the data side, the personal consumption expenditure (PCE) price index rose 2.3% in May, up from 2.2% in April (revised from 2.1%), the U.S. Bureau of Economic Analysis reported Friday. This value matched market expectations. Meanwhile, the core PCE price index, which excludes volatile food and energy prices, rose 2.7% in May, following a 2.6% increase (revised from 2.5%) seen in April.
On the other hand, the Bank of Japan's (BoJ) cautious stance on interest rate hikes could put pressure on the yen and create a tailwind for the pair.
Trade recommendation: SELL 143.50, SL 144.30, TP 142.40

Potential bearish drop?USD/JPY has rejected off the resistance level which is a pullback resistance and could drop from this level to our take profit.
Entry: 144.61
Why we like it:
There is a pullback resistance level.
Stop loss: 146.11
Why we like it:
There is a pullback resistance level.
Take profit: 142.70
Why we like it:
There is a pullback support level that lines up with the 100% Fibonacci projection.
Enjoying your TradingView experience? Review us!
Please be advised that the information presented on TradingView is provided to Vantage (‘Vantage Global Limited’, ‘we’) by a third-party provider (‘Everest Fortune Group’). Please be reminded that you are solely responsible for the trading decisions on your account. There is a very high degree of risk involved in trading. Any information and/or content is intended entirely for research, educational and informational purposes only and does not constitute investment or consultation advice or investment strategy. The information is not tailored to the investment needs of any specific person and therefore does not involve a consideration of any of the investment objectives, financial situation or needs of any viewer that may receive it. Kindly also note that past performance is not a reliable indicator of future results. Actual results may differ materially from those anticipated in forward-looking or past performance statements. We assume no liability as to the accuracy or completeness of any of the information and/or content provided herein and the Company cannot be held responsible for any omission, mistake nor for any loss or damage including without limitation to any loss of profit which may arise from reliance on any information supplied by Everest Fortune Group.

Bullish bounce off pullback support?USD/JPY is falling towards the pivot and could bounce to the 1st resistance, which is a pullback resistance.
Pivot: 142.53
1st Support: 140.78
1st Resistance: 146.72
Risk Warning:
Trading Forex and CFDs carries a high level of risk to your capital and you should only trade with money you can afford to lose. Trading Forex and CFDs may not be suitable for all investors, so please ensure that you fully understand the risks involved and seek independent advice if necessary.
Disclaimer:
The above opinions given constitute general market commentary, and do not constitute the opinion or advice of IC Markets or any form of personal or investment advice.
Any opinions, news, research, analyses, prices, other information, or links to third-party sites contained on this website are provided on an "as-is" basis, are intended only to be informative, is not an advice nor a recommendation, nor research, or a record of our trading prices, or an offer of, or solicitation for a transaction in any financial instrument and thus should not be treated as such. The information provided does not involve any specific investment objectives, financial situation and needs of any specific person who may receive it. Please be aware, that past performance is not a reliable indicator of future performance and/or results. Past Performance or Forward-looking scenarios based upon the reasonable beliefs of the third-party provider are not a guarantee of future performance. Actual results may differ materially from those anticipated in forward-looking or past performance statements. IC Markets makes no representation or warranty and assumes no liability as to the accuracy or completeness of the information provided, nor any loss arising from any investment based on a recommendation, forecast or any information supplied by any third-party.

Interesting pattern found in USDJPY 4H chartIn this 4H chart, if you observe closely - the orange circle shows the peak at 148 price level
then, it falls to the blue circle at 146 price level before settling lower at the 143 price level. This is also where we are now.
I believe it is likely to break down further for which I have indicated a potential profit target.

USD/JPY💰Symbol: { USD/JPY }
🟩Price: { 144.790 & 145.856 }
🟥Stop: { 145.415 & 146.660 }
1️⃣profit: { 144.279 & 144.916 }
2️⃣profit: { 143.780 & 143.780 }
3️⃣profit: { 142.746 & 142.746 }
4️⃣profit: { 142.139 }
📊Check your chart before entering.
🚨Check before use to make sure there is no important news.🚨

USD/JPY Consolidation Triangle – Breakout WatchThe USD/JPY pair is currently trading inside a well-formed symmetrical triangle pattern on the daily chart. This structure typically forms when the market is in a phase of consolidation, with neither buyers nor sellers able to break the range. Price is compressing between a horizontal resistance zone (~146.50) and a rising support line (~143.50), indicating that a breakout in either direction may be imminent.
This triangle has formed after a sharp downtrend, followed by a broad base formation. Such setups often precede a decisive move, especially if accompanied by volume.
🔼 Upside Breakout Scenario
If price breaks and closes above the resistance zone (above 146.50–147.00) with bullish confirmation, we can expect momentum to shift in favor of buyers. A confirmed breakout would open the path toward 150.00+, possibly even retesting the highs of 2024 near 152.00. This would be seen as a bullish reversal after a prolonged downtrend.
🔽 Downside Breakdown Scenario
Alternatively, if price fails to hold the rising trendline and breaks below the 143.00–142.50 support zone, it may confirm a bearish breakdown. This would suggest a continuation of the earlier downtrend with fresh bearish momentum targeting 140.00 and lower levels.
🧭 Trade Strategy Consideration
Bullish Plan: Buy breakout above 147.00 with SL below 145.50 and TP near 150.50–152.00
Bearish Plan: Sell breakdown below 142.50 with SL above 144.00 and TP near 140.00–138.00
Neutral Bias: Wait for breakout confirmation; no trade inside the triangle
This is a tight volatility setup where breakout traders should stay alert. The longer the consolidation, the stronger the breakout move tends to be.
=================================================================
Disclosure: I am part of Trade Nation's Influencer program and receive a monthly fee for using their TradingView charts in my analysis.
=================================================================

USDJPY H4 I Bullish Bounce Off Based on the H4 chart analysis, the price is approaching our buy entry level at 143.48, a pullback support.
Our take profit is set at 145.11 a pullback resistance.
The stop loss is placed at 142.22, a swing low support.
High Risk Investment Warning
Trading Forex/CFDs on margin carries a high level of risk and may not be suitable for all investors. Leverage can work against you.
Stratos Markets Limited (tradu.com ):
CFDs are complex instruments and come with a high risk of losing money rapidly due to leverage. 63% of retail investor accounts lose money when trading CFDs with this provider. You should consider whether you understand how CFDs work and whether you can afford to take the high risk of losing your money.
Stratos Europe Ltd (tradu.com ):
CFDs are complex instruments and come with a high risk of losing money rapidly due to leverage. 63% of retail investor accounts lose money when trading CFDs with this provider. You should consider whether you understand how CFDs work and whether you can afford to take the high risk of losing your money.
Stratos Global LLC (tradu.com ):
Losses can exceed deposits.
Please be advised that the information presented on TradingView is provided to Tradu (‘Company’, ‘we’) by a third-party provider (‘TFA Global Pte Ltd’). Please be reminded that you are solely responsible for the trading decisions on your account. There is a very high degree of risk involved in trading. Any information and/or content is intended entirely for research, educational and informational purposes only and does not constitute investment or consultation advice or investment strategy. The information is not tailored to the investment needs of any specific person and therefore does not involve a consideration of any of the investment objectives, financial situation or needs of any viewer that may receive it. Kindly also note that past performance is not a reliable indicator of future results. Actual results may differ materially from those anticipated in forward-looking or past performance statements. We assume no liability as to the accuracy or completeness of any of the information and/or content provided herein and the Company cannot be held responsible for any omission, mistake nor for any loss or damage including without limitation to any loss of profit which may arise from reliance on any information supplied by TFA Global Pte Ltd.
The speaker(s) is neither an employee, agent nor representative of Tradu and is therefore acting independently. The opinions given are their own, constitute general market commentary, and do not constitute the opinion or advice of Tradu or any form of personal or investment advice. Tradu neither endorses nor guarantees offerings of third-party speakers, nor is Tradu responsible for the content, veracity or opinions of third-party speakers, presenters or participants.

USDJPY 15M BUY OPPORTUNITYVery good area of SUPPORT/RESISTANCE that why i went in
Safer SL 143.73
I can see very BULLISH signs for UJ in this coming Month (long term)
Have a lovely week every body


USDJPY 29/06/2025Weekly:
-Bearish W pattern.
-Liquidity sweep.
-Expecting a bearish weekly candle.
Daily:
-Bearish W pattern.
-IC.
4H:
-Bearish W pattern.
-IC.

Uj bearish scenario Uj confirmed bearish
Bearish Momentum
Smc completely forms and
Confirmed with counter trade break
Good early entry

USDJPY Daily TF - June 29th, 2025USDJPY Daily Neutral Idea
Monthly - Bullish
Weekly - Bearish
Daily - Bearish
I’m looking at the Daily time frame here as this is the only clear picture for price action in terms of trends. The 4hour looks like price action can’t make a decision so we will wait for price action to get closer to some major zones.
Bearish Continuation - Ideally, we want to see price action touch 147.500 again followed by convincing bearish rejection. Look to target lower toward major support levels if this happens.
Aside from this potential setup we don’t have much to look at here on UJ.

USDJPY: On The Lookout For Clear DirectionSimply ranging... A breakout from the range will be a good start. I will just observe.
USD/JPY "The Ninja Heist" – Bullish Loot Grab!🌟 Hey, Thieves & Market Bandits! 🌟
💰 Ready to raid the USD/JPY "The Gopher" vault? 💰
Based on 🔥Thief Trading Style🔥 (technical + fundamental heist analysis), here’s the master plan to swipe bullish profits before the market turns against us! Escape near the high-risk Yellow MA Zone—overbought, consolidation, and bear traps ahead! 💸 "Take the money and run—you’ve earned it!" 🏆🚀
🕵️♂️ Heist Strategy:
📈 Entry (Bullish Raid):
The vault’s unlocked! Buy any price—this heist is LIVE!
Pullback lovers: Set buy limits at recent/swing lows for extra loot.
🛑 Stop Loss (Escape Route):
Thief SL at recent/swing low (4H/Day trade basis).
Adjust based on your risk, lot size, and multiple orders.
🎯 Target (Profit Escape):
148.700 (or flee earlier if bears ambush!)
⚔️ Scalpers’ Quick Strike:
LONG ONLY! If rich, attack now. If not, join swing traders & rob slowly.
Trailing SL = Your bodyguard! 💰🔒
💥 Why This Heist?
USD/JPY "The Ninja" is bullish due to key factors—check:
📌 Fundamental + Macro + COT Report
📌 Quantitative + Sentiment + Intermarket Analysis
📌 Future Targets & Overall Score (Linkks In the profile!) 🔗🌍
🚨 Trading Alert (News = Danger!):
Avoid new trades during news—volatility kills!
Trailing SL saves profits on running positions.
💖 Support the Heist Team!
💥 Smash the Boost Button! 💥
Help us steal more money daily with Thief Trading Style! 🏆🚀
Stay tuned—another heist is coming soon! 🤑🎯

