CHECK NEXT WEEK USDJPY SIGNAL READ CAPTAIN(usdjpy) buy zone
( TRADE SATUP)
ENTRY POINT (144.050) to (143.950) 📊
FIRST TP (144.350)
2ND TARGET (144.900) 📊
LAST TARGET (145.450) 📊
STOP LOOS (143.400)❌
JPYUSD trade ideas

USDJPY Analysis week 23Fundamental Analysis
Tokyo's core CPI (excluding fresh food) - a key inflation gauge - rose 3.6%, higher than forecast and last month. This increases the possibility that the Bank of Japan (BoJ) will continue to raise interest rates this year, although most experts predict the BoJ will keep rates unchanged until September.
Meanwhile, the USD rose sharply after a US appeals court overturned the decision to remove most of the tariffs imposed by Mr. Trump. However, the Yen still appreciated slightly against the USD.
Technical Analysis
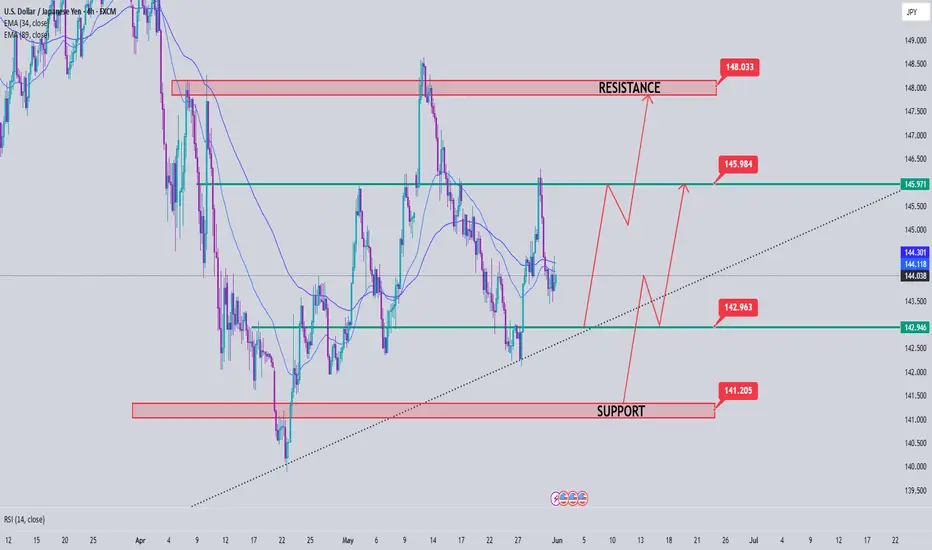
After consecutive declines on Friday, the pair is sideways waiting for the next development. 142.900 is the next support zone that the pair faces, this is the breakout zone and also the trendline meeting. Break this price zone must wait 141,200 for weekly support zone
145,900 last week's peak resistance zone acts as resistance for the pair's price reaction towards this week's resistance peak around 148,000
UJ| Counter-Flow Intraday Setup4H structure still showing bearish signs going into next week, but I’m not forcing shorts.
Instead, I’m eyeing intraday buys to play a move back up into 4H supply.
Dropped to the 30M—now just waiting for that inducement sweep into the order flow zone.
Once mitigation hits, I’ll look to the LTFs for that final confirmation.
This is how you ride against the current without getting swept. 🎯
– Inducement King
Bless Trading!

longs in place??OANDA:USDJPY seeing the downtrend slowdown(big circle) it was safe to assume a shift was coming and when price went up and created a higher low it sealed the deal.
confluences: break of market structure(1) break and retest of support/resistance(2) bullish momentum candles(3)
Market next move Disruption of the Current Analysis:
1. False Breakout Risk:
The price is consolidating under a clearly marked resistance, but there’s no confirmation of a breakout yet.
The bullish arrows (prediction path) assume a breakout without waiting for a confirmed close above resistance, which is premature.
2. Low Momentum Candles:
The recent candles are small-bodied with wicks on both sides — signs of indecision.
No strong bullish momentum candle exists to support the projection.
3. Volume Mismatch:
Volume spiked recently, but the candle was red — this could indicate supply absorption or selling into strength, not accumulation.
A bullish scenario would require increasing volume on green candles breaking resistance.
4. Bearish Trend Context Ignored:
The chart shows a clear preceding downtrend, and what follows could simply be a bearish flag or dead cat bounce.
Marking this as the beginning of a bullish reversal overlooks the overall bearish context.


Usdjpy Usdjpy am expecting a bearish movement on Usdjpy so I will sell after price break down and retest back on the zone den I will sell

CHECK USDJPY SIGNAL READ CAPTAIN(usdjpy) buy zone
( TRADE SATUP)
ENTRY POINT (144.100) to (143.900) 📊
FIRST TP (144.700)
2ND TARGET (145.550) 📊
LAST TARGET (146.350) 📊
STOP LOOS (143.300)❌

Japan core inflation hits two-year high, yen gains groundThe yen is higher on Friday. Iin the European session, USD/JPY is trading at 143.63, down 0.37% on the day.
Tokyo core CPI climbed to 3.6% y/y in May, up from 3.4% in April and above the market estimate of 3.5%. This marked the highest level since Jan. 2025. Tokyo core inflation is viewed as the leading indicator of nationwide inflation trends and is closely monitored by the Bank of Japan. Tokyo core CPI, which excludes fresh food, was driven higher due to due higher non-fresh food prices, particularly rice which has soared 93% over the past year.
The jump in core CPI bolsters the case for a BoJ rate hike. The markets had anticipated a rate hike in October but today's strong inflation report could accelerate the timing of the next rate hike. At the same time, the uncertainty caused by US trade policy may force the BoJ to delay any rate hikes until the impact of US tariffs on Japan's economy becomes clearer.
US President Trump's controversial tariffs have sent the financial markets on wild swings. Now, US courts are weighing in on whether Trump exceeded his authority when he imposed the tariffs. A trade court panel ruled this week that most of the tariffs were illegal but on Thursday, an appeals court granted the Trump administration a temporary pause, keeping the tariffs in effect.
The legal fight over the tariffs has just begun and could go all the way to the US Supreme Court. In the meantime, the legal challenge has blown a hole in Trump's tariff policy and is causing even more uncertainty in the financial markets.

USD/JPY takes fresh dip on renewed trade uncertaintyThanks to ongoing trade uncertainty and troubles in the bond market, the USD/JPY looks like is going to end the week on a negative note, after coming down sharply in the last day and a half, which means the weekly gains have more than halved.
The US dollar had actually clawed back a bit of ground in early Friday trading after taking a hit the day before. The rebound came despite fresh drama around Donald Trump’s tariff policies, which—unsurprisingly—are once again stirring the pot. A federal appeals court gave the president a temporary lifeline, pausing a ruling that could have derailed much of his economic agenda.
The White House team wasted no time doubling down: Trump, they insist, isn’t backing off. Tariffs are sticking around. But the mood got murkier when Treasury Secretary Scott Bessent admitted that US-China trade talks are “a bit stalled.” Then came Trump’s latest post on Truth Social, where he accused China of “totally violating” the trade deal with the US.
Markets didn’t take it well. US indices dipped, USD/JPY slid, and even the euro managed to push the dollar back a touch.
As well as well as trade uncertainty eyes will turn to incoming US data next week, among them the monthly jobs report on Friday.
The US jobs report is always important as it could impact the Fed’s future policy decisions. Traders will want to see whether the trade war uncertainty is negatively impacting the jobs market too, after several macro data, including consumption data in GDP report and consumer sentiment surveys, have come out weaker in recent weeks. JOLTS jobs data and ISM PMIs are also due out earlier in the week.
The US dollar has been under pressure in the last three months or so, with the euro performing admirably during this time despite US tariffs.
With the US recently losing its final top-tier credit rating at the hands of Moody’s a couple of weeks ago, investors are worried that debt concerns and government spending will push yields even higher and thus they are shorting Treasuries and the dollar, buying foreign currencies, including the euro. This makes the EUR/USD outlook remain fairly resilient around the 1.12-1.15 range.
By Fawad Razaqzada, market analyst with FOREX.com

USDJPY: Weekly overviewHello Traders, US news could move this pair dramatically.
I've made the white zone no trade because of strong additional zone around 148.225 for the bullish side and a sharp move needed to reach the zone.
The zone around 142.892 is more suitable for short trades, regarding the trend and distance from median of the channel. This zone is only suitable for long if the break be strong enough to overpass the median of the channel.
The indicated levels are determined based on the most reaction points and the assumption of approximately equal distance between the zones.
Some of these points can also be confirmed by the mathematical intervals of Murray.
You can enter with/without confirmation. IF you want to take confirmation you can use LTF analysis, Spike move confirmation, Trend Strength confrimation and ETC.
SL could be placed below the zone or regarding the LTF swings.
TP is the next zone or the nearest moving S&R, which are median and borders of the drawn channels.
*******************************************************************
Role of different zones:
GREEN: Just long trades allowed on them.
RED: Just Short trades allowed on them.
BLUE: both long and short trades allowed on them.
WHITE: No trades allowed on them! just use them as TP points

LONG ON USD/JPYUJ has given a choc (change or character) at a major demand zone.
JPY index structure is currently bearish.
I will buying UJ to the next swing high looking to catch 100-200 pips

Yen Strengthens Beyond 144 on InflationThe Japanese yen rose past 144 per dollar, extending gains after Tokyo’s core inflation beat expectations, increasing the likelihood of a 25 bps BOJ rate hike in July.
BOJ Governor Kazuo Ueda said recent forecast adjustments were due to global risks and lower oil prices but reaffirmed the short-term policy stance remains focused on the 2% inflation goal. The yen also gained from safe-haven flows after a U.S. court reinstated Trump’s reciprocal tariffs.
Resistance is at 144.50, with further resistance at 145.40 and 146.10. Support levels stand at 143.50, 143.00, and 142.10.

JPYUSD Technical Analysis | (MMC) in Play + Target🟦 1. Structure & Price Action Overview
The chart is of JPY/USD on the 2-hour timeframe, showing a clear picture of price movement over several weeks.
We see three major market phases:
Range/Resistance Phase (Left side of chart)
Uptrend Phase (Middle – rising channel)
Reversal Setup (Right side – potential bearish move forming)
📈 2. Uptrend Channel (Accumulation to Expansion Phase)
From around May 13th, price started forming higher highs and higher lows, respecting a bullish channel (light blue shaded area).
This is a classic ascending channel, often seen during a controlled uptrend where buyers are still in control but momentum is slowing.
The channel took price directly into the resistance zone (marked in purple at the top).
🚫 3. Resistance Zone Rejection (Key Supply Zone)
Once price hit the resistance zone (~0.00705), it failed to break higher.
This level had previously caused sharp drops, so it's a well-established supply zone.
Price was rejected and dropped sharply, breaking out of the ascending channel – a strong bearish signal.
🔄 4. Mirror Market Concept (MMC) – Curve Bending Pattern
After the initial drop, price attempted a bounce, but couldn't even reach previous highs.
The curved arrow labeled "Curve Bending" shows how the market is “bending” its momentum – not pushing upward anymore but turning into a reversal.
This forms the mirror of the previous rise – indicating the market is ready to “mirror” that previous bullish leg, but to the downside.
🔄 5. SR Interchange (Support Flipped Resistance)
The previous demand zone (around 0.006950–0.007000), where buyers pushed price higher during the uptrend, is now acting as resistance.
This is called an SR Flip (Support becomes Resistance) – a very reliable technical sign of trend reversal.
🎯 6. Bearish Target Projection
Based on MMC and symmetry of past movements, the chart is projecting a strong drop toward the 0.006800 support zone.
This zone is also historically significant and acted as a demand area earlier.
The black arrow and target box show this expected move, which aligns with the mirror structure.
🧩 Conclusion & Trade Plan
Bias: Strong Bearish
Confirmation : Channel break + rejection at resistance + curve bending
Trigger: Price fails to reclaim 0.00700 and breaks below 0.006930
Target: 0.006800
Invalidation : Clean break & hold above 0.007050
🛡️ Pro Tips:
Don’t just jump in — wait for bearish confirmation (like a bearish engulfing candle, or a failed retest).
Always set your SL (Stop Loss) above the resistance zone (~0.007050).
Let the setup come to you — don’t force trades.

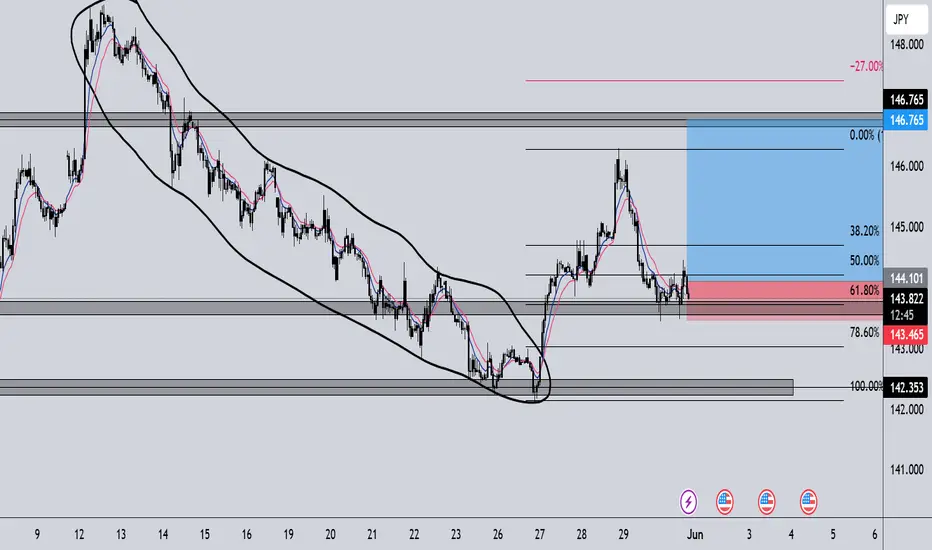
Was This Week's Move in USD/JPY Just a Correction?This week’s bounce in USD/JPY may have caught some traders off guard—but when viewed through the lens of the Elliott Wave Principle, the price action appears to be corrective rather than impulsive.
🧩 The Evidence: A 3-Wave Move
According to the wave structure:
The recent move up unfolded in 3 waves, labeled as an ABC correction.
Wave C terminated near the 100% Fibonacci extension of Wave A (~146.189), which is a classic ZigZag ratio.
Additionally, there was a clear MACD divergence between price and momentum as Wave C completed—a common sign that the move is running out of steam and that the wave is likely terminal.
These clues all point to the idea that the rally was corrective, not the start of a new impulsive trend.
📉 What Comes Next?
If this count is correct:
USD/JPY may have completed Wave (ii) of a new downward impulse.
The next move could be the start of Wave (iii)—typically the most aggressive and directional wave in a 5-wave decline.
✅ Trigger Level: A break below the B wave low would act as a technical confirmation of the downtrend resuming.
This would be a green light to look for short setups, depending on the strategy each trader follows—whether that’s pattern-based, indicator-confirmed, or structure-driven.
🔁 Alternate Scenario:
If this isn't the start of Wave (iii), the alternate count would suggest a more complex corrective combination (such as a double three).
However, even in that scenario, the short-term direction is still likely downward.
🧠 For Beginners:
Elliott Wave theory breaks price into 5-wave trends and 3-wave corrections.
A ZigZag correction (ABC) is made up of a sharp Wave A, a pullback in Wave B, and a final move up in Wave C.
Wave C often shows momentum divergence (MACD diverging from price), signaling that the move may be exhausting.
When C = A, especially with divergence, it’s often a sign the correction is ending.
📌 Summary:
USD/JPY’s rally appears to be a corrective ABC structure.
Wave C rejected at the 100% extension of A, with MACD divergence confirming weakening momentum.
A break of the B wave low could confirm that Wave (iii) down is underway.
Even in the alternate count, near-term downside is still favored.
💬 Got a Favorite Chart You’d Like Analyzed?
If there’s a forex pair, crypto, or stock you’d like me to break down using Elliott Waves,
leave a comment below and I’ll feature it in an upcoming post from Real Wave Trader.

USD/JPY BEST PLACE TO BUY FROM|LONG
USD/JPY SIGNAL
Trade Direction: long
Entry Level: 143.655
Target Level: 145.800
Stop Loss: 142.221
RISK PROFILE
Risk level: medium
Suggested risk: 1%
Timeframe: 3h
Disclosure: I am part of Trade Nation's Influencer program and receive a monthly fee for using their TradingView charts in my analysis.
✅LIKE AND COMMENT MY IDEAS✅

USDJPY H1 BUY OPPORTUNITY!!Price might trade bullish today as we're beginning to see a symmetrical triangle pattern formation. a breakout to the upside provide us with a possible buy opportunity.
MARKET ORDER
BUY STOP PRICE: 144.5
STOP LOSS: 143.500
TAKE PROFIT: 146

USDJPY - Predictive Analysis & Forecasting USDJPY
Scales
- S: pending 149.964 activation
- M: nears cycle completion from 140.648 to 148.52-149.53 target range
- L: 142.67 activation triggered 149.21 pivot
Forecast & Targets
- ST: limited upside to 149.96 max
- MT: bearish to 143.09 min, 138.29 max
#USDJPY #Forex #CROW2.0
4xForecaster
------
Originally published in BlueSky

USDJPY – Supportive news, price may break resistance soonUSDJPY is supported by positive U.S. economic data, as the PCE index remains elevated—reinforcing expectations that the Fed will keep interest rates higher for longer. This has boosted bond yields and the USD, driving USDJPY upward.
On the H3 technical chart, USDJPY has rebounded from the support zone around 143.680. Both the EMA 34 and EMA 89 lie below the price, reinforcing the recovery momentum. The pair is now expected to approach the 146.000 resistance area—where it intersects with the long-term descending trendline that has rejected price at least twice before.
If buying pressure holds and 146.000 is decisively broken, a short-term bullish trend will likely be confirmed. However, another rejection could lead to a retest of the previous support zone. Overall, the current trend slightly favors the buyers.

sniper entry SHort 1:10 RRdowntredn continuation to the support level of the CHANNEL DOWN on the daily, continuation to the support level of the CHANNEL DOWN on the daily. We are currently observing a rejection here

Fundamental Market Analysis for May 30, 2025 USDJPYThe Japanese yen (JPY) attracted strong follow-through buying for the second consecutive day on Friday and continued to recover from a two-week low reached the previous day against the US dollar. Global risk sentiment deteriorated after a federal appeals court on Thursday suspended a recent ruling blocking US President Donald Trump's radical tariffs. This is evident from the general weakening of sentiment in the stock markets and is contributing to a recovery in demand for traditional safe-haven assets, including the JPY.
Meanwhile, optimistic macroeconomic data from Japan released today, including strong consumer inflation figures in Tokyo, confirm the need for further interest rate hikes by the Bank of Japan (JPY) and provide additional support for the JPY. On the other hand, the US dollar (USD) is consolidating after a sharp reversal yesterday amid concerns about the deterioration of the US financial situation and bets that the Federal Reserve (Fed) will stick to its easing policy. This further contributes to the continued decline of the USD/JPY pair.
Trading recommendation: SELL 143.800, SL 144.200, TP 142.900

USDJPY SELL IDEA!!Price has been reacting around the 148.000 level forming a head and shoulder bearish pattern. a break below the neckline insight a sell opportunity.
fundamentally, Bank of Japan intend to move forward with additional interest rate hikes, and market participant are anticipating a 25 basis point increase in July. it's safe to short USDJPY as further decline is anticipated.

Could the price bounce from here?USD/JPY is falling towards the pivot and could bounce to the 1st resistance, which acts as a pullback resistance.
Pivot: 143.25
1st Support: 141.80
1st Resistance: 145.97
Risk Warning:
Trading Forex and CFDs carries a high level of risk to your capital and you should only trade with money you can afford to lose. Trading Forex and CFDs may not be suitable for all investors, so please ensure that you fully understand the risks involved and seek independent advice if necessary.
Disclaimer:
The above opinions given constitute general market commentary, and do not constitute the opinion or advice of IC Markets or any form of personal or investment advice.
Any opinions, news, research, analyses, prices, other information, or links to third-party sites contained on this website are provided on an "as-is" basis, are intended only to be informative, is not an advice nor a recommendation, nor research, or a record of our trading prices, or an offer of, or solicitation for a transaction in any financial instrument and thus should not be treated as such. The information provided does not involve any specific investment objectives, financial situation and needs of any specific person who may receive it. Please be aware, that past performance is not a reliable indicator of future performance and/or results. Past Performance or Forward-looking scenarios based upon the reasonable beliefs of the third-party provider are not a guarantee of future performance. Actual results may differ materially from those anticipated in forward-looking or past performance statements. IC Markets makes no representation or warranty and assumes no liability as to the accuracy or completeness of the information provided, nor any loss arising from any investment based on a recommendation, forecast or any information supplied by any third-party.
