use/jpy (Short term move) 6/24/2025 10:39AM western time zone Stop loss: 144.40
Take profit: 145.30
(Short term move)
JPYUSD trade ideas

US$ Carry Trade BLOWUP IS SETTING UP The chart posted is the Yen/US$ I have NOT changed the labeling see forecast I feel something is about to Break in the markets ! best of trades WAVETIMER

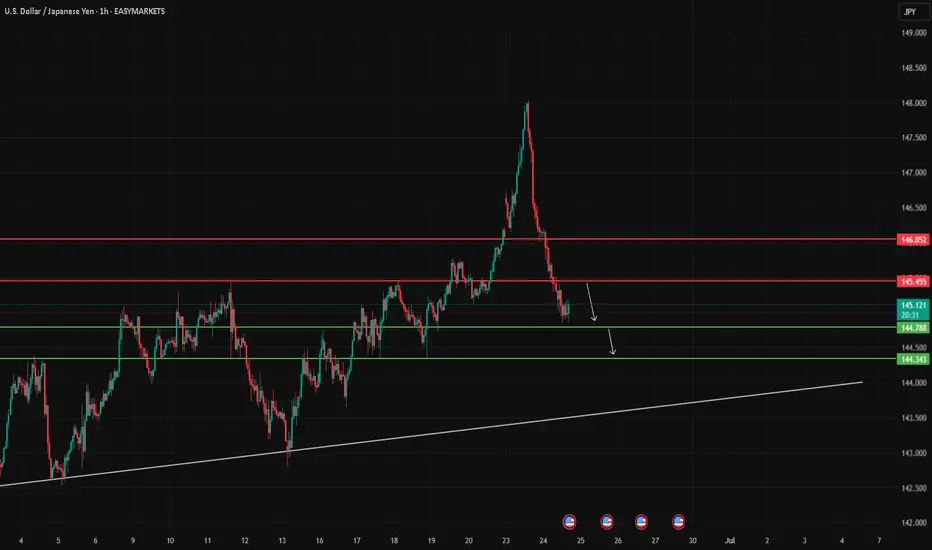
USD/JPY Bearish Correction in Progress – Key Supports in Focus
USD/JPY is showing signs of weakness after rejecting the 146.00 level. The pair has started a corrective move on the 1H timeframe, trading below the previous support at 145.455, which has now turned into resistance.
As long as the price remains below this level, the current momentum suggests a possible drop toward the next support zones at:
First target: 144.78
Second target: 144.343
Any bullish retracement toward 145.455 may serve as a retest before continuing lower. This idea reflects the current price structure and does not constitute financial advice.
USD/JPY Bull is back to push the price upHi All,
Firstly, I want to congrats to traders who short the market for the last few months. Well done!!!
Those who is waiting for LONG opportunity, let's get ready for sniper entry.
Here is my prediction and entry on USD/JPY. As you can see, the orange zone around $139-$140 is extremely strong zone. Prices reverse 3 times on this level. On 22 March 2025, the closed daily candle was formed a hammer candle and followed by a strong bullish candle next day which indicates potential reversal to upward.
The RSI indicator lines were crossed on 22 March 2025. Now, the indicator is showing upward momentum as the both lines are about cross 50%.
We also have bullish divergence on the volume indicator. As you can see, the volume was going to sideway where as the price was heading to the orange zone.
These confluence is supporting me to enter LONG. Therefore, I entered 3 entry at different price point which is $143.50, $142.996, $144.70.

USD/JPY.2h chart patternI'm provided for USD/JPY on the 2-hour timeframe, here is a detailed breakdown and target analysis:
---
🔍 Technical Analysis Summary
Pair: USD/JPY
Timeframe: 2H
Current Price: ~144.98
Trend: Bearish
Breakdown Confirmation: Price broke structure support and the ascending trendline.
Indicators: Price is below the Ichimoku cloud, confirming bearish momentum.
---
🎯 Identified Targets (Based on Your Chart)
1st Target Level (Nearest Support Zone):
Price Level: Around 143.50
This is the first horizontal red line marked as a "Target" on your chart.
Likely to act as a short-term support level.
2nd Target Level (Major Support):
Price Level: Around 142.00
This is the second and lower red line marked on your chart.
Strong historical support zone based on previous consolidation.
---
✅ Final Target Levels
Target # Price Level Description
Target 1 143.50 Initial support; take partial profit here
Target 2 142.00 Major target; potential reversal/support zone
---
Would you like a suggested stop-loss level or entry refinement based on candlestick confirmation or indicators (like RSI or volume)?

Yen Rebounds as Ceasefire Calms MarketsThe Japanese yen recovered to around 145.5 per dollar on Tuesday, gaining strength after the ceasefire announcement. Although Iran launched missiles at a US base in Qatar, causing no casualties, the gesture was largely seen as symbolic. Tehran’s decision not to target the Strait of Hormuz further eased fears of major disruptions.
The key resistance is at $146.20 while the major support is at $144.85.
LONG ON USD/JPYLong on UJ
- Price is respecting a major demand zone after a break and retest
- DXY (Dollar) is bullish
- Yen Bearish

USDJPY Will Go Up! Buy!
Take a look at our analysis for USDJPY.
Time Frame: 9h
Current Trend: Bullish
Sentiment: Oversold (based on 7-period RSI)
Forecast: Bullish
The market is testing a major horizontal structure 145.018.
Taking into consideration the structure & trend analysis, I believe that the market will reach 146.793 level soon.
P.S
Overbought describes a period of time where there has been a significant and consistent upward move in price over a period of time without much pullback.
Disclosure: I am part of Trade Nation's Influencer program and receive a monthly fee for using their TradingView charts in my analysis.
Like and subscribe and comment my ideas if you enjoy them!

USDJPY Analysis🚀 We entered the buy trade from the bottom level (check the pinned idea)
Thanks to our trailing stop strategy, we locked in full profits ✅
For those who missed it — a new buy zone is now marked on the chart!
Be patient and don’t trade emotionally ✋

DeGRAM | USDJPY retesting the resistance level📊 Technical Analysis
● Four consecutive higher-lows off 140.9 have carved a rising flag that presses the channel roof (144.8); flag depth projects to the April swing-top/ Fib cluster at 147.8 once 145 is cleared.
● Daily RSI holds above 50 and price is now trading back above the broken wedge-cap (142.9), confirming it as demand and tilting risk toward the 150.9 macro ceiling.
💡 Fundamental Analysis
● US 2-yr yields stay >4.70 % after solid ISM-services prices, while BoJ minutes show members preferring “patient” normalisation; the widening policy gap keeps yen funding pressure intact.
✨ Summary
Long 142.9-144.0; break of 145 targets 147.8, stretch 150.9. Bull view invalidated on a daily close below 140.9.
-------------------
Share your opinion in the comments and support the idea with like. Thanks for your support!

USDJPY; RETEST AND CONTINUATION HIGHERHello traders,
USDJPY has been in an uptrend for a while now and heavily corrected from the top of 148.000 down to a strong resistance of 145.000
we expect a continuation from here targeting our previous highs of 148.000
good luck

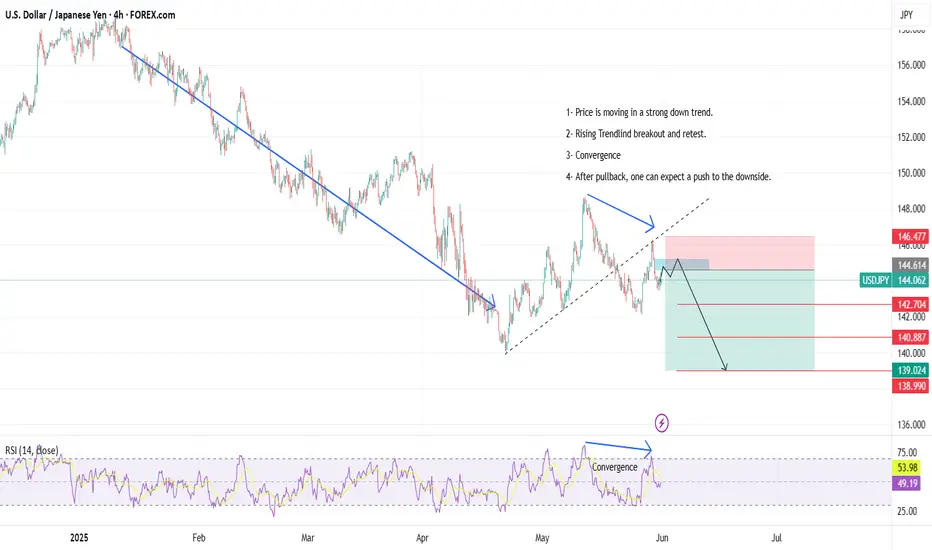
02-06-2025 _ Short Term Bearish Idea _ USDJPY H41- Price is moving in a strong down trend.
2- Rising Trendlind breakout and retest.
3- Convergence
4- After pullback, one can expect a push to the downside.
USDJPY Poised for a BreakoutUSDJPY Poised for a Breakout
On the 4-hour chart, USDJPY is not yet taking a clear direction. The price is showing the possibility of both movements.
With the current data we can see that USDJPY is forming a triangle pattern and only the breakdown up or down will show the direction of the price.
However, I think the chances are higher for the bullish movement considering that the geopolitical tension in the Middle East is also very high and the USD remains one of the strongest currencies.
Bullish target: 147.90
Bearish target: 140.90
⚠️ Note: If the pattern transforms more than this triangle, then we may be in a different situation and everything may be invalid. The analysis may change over time.
You may find more details in the chart!
Thank you and Good Luck!
❤️PS: Please support with a like or comment if you find this analysis useful for your trading day❤️
Disclosure: I am part of Trade Nation's Influencer program and receive a monthly fee for using their TradingView charts in my analysis.

USD/JPY 2-Hour Forex Chart2-hour performance of the U.S. Dollar (USD) against the Japanese Yen (JPY) from FOREX.com, showing a current exchange rate of 145.498 with a decrease of 0.661 (-0.45%). The chart highlights a recent sharp decline, with a shaded area indicating a potential support or resistance zone around 145.000 to 146.047. Key levels include 144.721 (support) and 146.047 (resistance), with the price movement tracked over the past two hours.

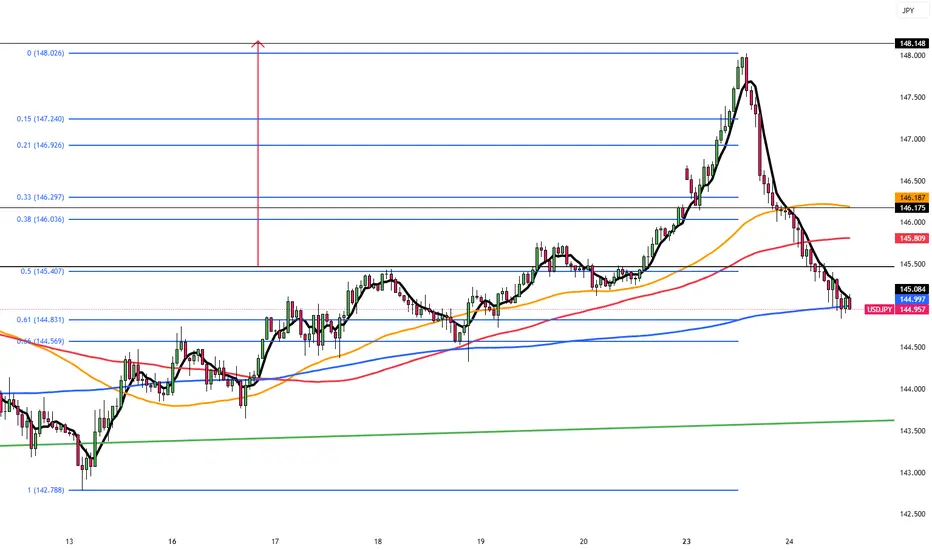
USD/JPY Bullish Reversal Trade Setup – Key Support Test at 145.2Entry Point: 145.273 (highlighted in blue)
Stop Loss: ~144.817–145.260 (purple zone)
Target Point (TP): 148.133 (upper resistance zone)
📉 Recent Price Action:
Price peaked near 148.05 before reversing sharply and breaking the trendline.
The market is currently testing the support zone (near the 145.273 entry level).
Moving averages (red = short-term, blue = long-term) show a crossover to the downside, suggesting short-term bearish momentum.
📈 Trade Setup:
Strategy Type: Long (Buy) Setup
Risk/Reward: Favorable, approximately 1:2+
Entry Zone: The current price is close to the entry level at 145.273, making this a timely area to watch for a bounce or confirmation.
⚠️ Risk Factors:
If price breaks below 144.817, the setup becomes invalid.
Short-term momentum is still bearish; confirmation (like a bullish engulfing candle or support hold) is important before entering.
✅ Confirmation Triggers for Entry:
Strong bullish candlestick pattern near entry zone.
RSI or MACD bullish divergence (not shown but useful to check).
Volume spike on bounce from support.

USDJPY H4 I Bullish Bounce Off Based on the H4 chart analysis, the price is falling toward our buy entry level at 145.45, a pullback support that aligns with the 50% Fib retracement.
Our take profit is set at 146.79 a pullback resistance.
The stop loss is placed at 143.97, an overlap support.
High Risk Investment Warning
Trading Forex/CFDs on margin carries a high level of risk and may not be suitable for all investors. Leverage can work against you.
Stratos Markets Limited (tradu.com ):
CFDs are complex instruments and come with a high risk of losing money rapidly due to leverage. 63% of retail investor accounts lose money when trading CFDs with this provider. You should consider whether you understand how CFDs work and whether you can afford to take the high risk of losing your money.
Stratos Europe Ltd (tradu.com ):
CFDs are complex instruments and come with a high risk of losing money rapidly due to leverage. 63% of retail investor accounts lose money when trading CFDs with this provider. You should consider whether you understand how CFDs work and whether you can afford to take the high risk of losing your money.
Stratos Global LLC (tradu.com ):
Losses can exceed deposits.
Please be advised that the information presented on TradingView is provided to Tradu (‘Company’, ‘we’) by a third-party provider (‘TFA Global Pte Ltd’). Please be reminded that you are solely responsible for the trading decisions on your account. There is a very high degree of risk involved in trading. Any information and/or content is intended entirely for research, educational and informational purposes only and does not constitute investment or consultation advice or investment strategy. The information is not tailored to the investment needs of any specific person and therefore does not involve a consideration of any of the investment objectives, financial situation or needs of any viewer that may receive it. Kindly also note that past performance is not a reliable indicator of future results. Actual results may differ materially from those anticipated in forward-looking or past performance statements. We assume no liability as to the accuracy or completeness of any of the information and/or content provided herein and the Company cannot be held responsible for any omission, mistake nor for any loss or damage including without limitation to any loss of profit which may arise from reliance on any information supplied by TFA Global Pte Ltd.
The speaker(s) is neither an employee, agent nor representative of Tradu and is therefore acting independently. The opinions given are their own, constitute general market commentary, and do not constitute the opinion or advice of Tradu or any form of personal or investment advice. Tradu neither endorses nor guarantees offerings of third-party speakers, nor is Tradu responsible for the content, veracity or opinions of third-party speakers, presenters or participants.

USDJPY Trading StrategyUSDJPY is looking to break the resistance zone of 147,000. The current bullish force of USDJPY is too strong, so jumping in to catch the top at the present time will be quite risky. If you want a SELL signal, you must wait for the confirmation of the sellers jumping into the market by the confirmation of the red closing m30 candle.
There will be a beautiful SELL signal if the h4 candle shrinks its wick below 147,000. If it closes above the SELL point, you must wait for 148,100, or if you want to BUY, wait for the retest and create a beautiful bullish wave in the small time frame.
On the other hand, if the currency pair declines back to the support zone of 146,000 and 145,200, it will give us a long-term BUY signal.
Support 146,000-145,200
Resistance 117,100-148,100

USDJPY InsightHello to all our subscribers.
Please share your personal opinions in the comments. Don't forget to boost and subscribe.
Key Points
- Iran launched a total of 14 missiles toward U.S. air bases, but most were intercepted. U.S. President Trump stated, "I want to thank Iran for giving advance notice and ensuring there were no casualties or injuries," and the market interpreted the event as a "staged confrontation" where Iran saved face.
- President Trump said on Truth Social, “Israel and Iran have fully agreed to a comprehensive and complete ceasefire.” Reuters, citing a senior Iranian official, reported that Iran accepted the ceasefire proposal mediated by Qatar and suggested by the United States.
- Iranian Deputy Foreign Minister Abbas Araghchi stated that "if Israel halts its 'illegal attacks' on Iran by 4 a.m. on the 24th (Tehran time), Iran has no intention to further respond." Israel has not yet made an official statement.
- Federal Reserve Vice Chair Bowman said, “If inflationary pressures continue to ease, I will support lowering the policy rate as early as the next meeting to bring it closer to a neutral level and to maintain a healthy labor market.”
Key Economic Events This Week
+ June 24: Testimony by Fed Chair Jerome Powell
+ June 25: Testimony by Fed Chair Jerome Powell
+ June 26: U.S. Q1 GDP
+ June 27: U.S. May PCE Price Index
USDJPY Chart Analysis
After breaking through the 145 level, the pair showed a sharp upward move and formed a peak around the 148 level before reversing downward. It is expected to form a bottom in the 144–145 range during this pullback and potentially rise to the 151 level. However, if it unexpectedly breaks below the 144 level, there is also a possibility it could fall to around 140.

USD/JPY Long Trade Setup – Key Support Rebound Targeting 148.674Entry Point:
Price: 143.373
The chart suggests initiating a long (buy) position at this level, which is just slightly below the current market price.
Stop Loss:
Price: 141.707
Positioned below a strong support zone. This level protects the trade from excessive downside risk if the price breaks down.
Target Point:
Price: 148.674
The target is clearly defined, indicating a potential gain of approximately 5.991 points, or 4.20% from the entry.
🟪 Support/Resistance Zones
The purple boxes indicate demand (support) and supply (resistance) zones.
The lower zone (entry/stop area) shows a historically significant support range that has been tested multiple times (indicated with orange circles).
The upper purple zone marks the take-profit area, which coincides with previous resistance.
📊 Moving Averages
Blue Line: 200 EMA (Exponential Moving Average) – acting as dynamic resistance.
Red Line: 50 EMA – price is currently trading below it, indicating bearish short-term pressure but potential for reversal.
🧠 Trade Idea Summary
Bias: Bullish (long position)
Risk-Reward Ratio: Favorable
Risk: ~1.67 points (from 143.373 to 141.707)
Reward: ~5.3 points (from 143.373 to 148.674)
Approx. R:R = 1:3.17
Validation: The setup relies on the price holding the key support zone and bouncing higher, targeting the next major resistance.
⚠️ Considerations
Monitor for bullish candlestick patterns near the entry zone.
Keep an eye on macroeconomic news (like BoJ or Fed updates) that could cause volatility in USD/JPY.
Confirm momentum shift with RSI or MACD if using indicators.

USDJPY BUY OPPORTUNITY Am selling a buy Opportunities on USDJPY
Entry:
Stoploss
Take profit:
Always wait for chart pattern and Price action arround the entry before clicking the buy button
Comment your opinion pls.
For Account management. Contact me on X @shajudeakinoba1

Trading Ideas USDJPY 4H [Disc On]Technical Analysis:
The presence of a Hidden Bullish Divergence on the 4-hour timeframe suggests a strong likelihood of bullish trend continuation. Additionally, the price has broken through a key support level on the 1-hour chart, with upside potential targeting the Fibonacci cluster at the psychological zone of 144.500–145.000 .
Conclusion:
A BUY opportunity is favored, with entry consideration around the 144.500–145.000 Fibonacci cluster zone. Suggested risk management includes a stop loss at 142.000 and a take profit target at 150.000.
技术分析:
在4小时周期中出现隐藏的看涨背离,表明上涨趋势有较大延续的可能性。同时,价格已突破1小时图中的关键支撑位,上行目标指向 144.500–145.000 的斐波那契密集区域(心理价位区间)。
结论:
当前倾向于寻找BUY机会,入场参考区域为斐波那契密集区144.500–145.000。建议设置止损位于142.000,目标价为150.000,以控制风险并优化利润空间。
OANDA:USDJPY

USD/JPY Breakout Fake Out - 148 RejectionBulls had an open door to make a run after this week's open but, so far, they've failed at the same 148.00 handle that snared buyers back in May.
The daily bar at this point is brewing up a gravestone doji but there's still a couple hours left until the close of trading for the day, and this could end up as a pin bar.
Behind the push is rate cut potential in the U.S. After Powell sounded cautious around tariffs last week, the potential for geopol risk and higher oil prices brought another inflationary factor to the fold.
But shortly after the U.S. open this morning Michelle Bowman said she was ready to cut rates in July, and that prodded a sell-off in the USD that has made a noticeable dent in USD/JPY.
Bulls aren't completely out of the equation yet, however, as supports exist at 145.92 and the 144.86-145.00 zone. If sellers sink through that, however, topside potential would dim.
But, notably, chasing breakouts in USD/JPY, in either direction, continues to be a challenging way of dealing with the pair. - js

Yen slides on oil supply jitters after US attack on IranThe Japanese yen has started the week with sharp losses. In the European session, USD/JPY has jumped 1.2% on the day and is trading at 147.82. The yen has fallen to five-week lows against the US dollar.
The fallout from the US attack on Iranian nuclear facilities over the weekend is being felt in the currency markets. The Japanese yen, traditionally a safe-haven currency, continues to depreciate, in response to rising oil prices.
Oil prices rose to their highest level since January on Monday after the US attack on Iranian nuclear facilities. Iran has threatened to close the Straits of Hormuz, a critical trade route through which 20% of the world's oil supply passes through each day. Oil prices have jumped about 10% since the Israel-Iran war started on June 13 and fears of a disruption to oil supply could further boost oil prices.
As oil prices have climbed, the yen has lost ground, declining 3.0% since the Israel-Iran war started. Japan imports almost all of its oil and the rise in oil prices is hurting Japan's trade balance.
Japan's core inflation rate climbed 3.7% y/y in May, up from 3.5% in April. Core CPI has accelerated for a third straight month and hit its highest level since Jan. 2023. This was above the market estimate of 3.6%. Headline inflation ticked lower to 3.5% from 3.6% in April, below the forecast of 3.6%.
The rise in core CPI supports the case for the Bank of Japan to boost interest rates, but the uncertainty over tariffs and the Israel-Iran war will likely mean that the BoJ will stay on the sidelines in the coming months.
There is resistance at 146.91. Next, USD/JPY is testing resistance at 147.61
146.51 and 145.81 are the next support levels
