USDJPYUSDJPY is currently approaching a major breakout zone as it nears the apex of a symmetrical triangle pattern. The pair has broken above the key horizontal resistance area around 145.80–146.00, which previously acted as a strong supply zone. Price is now challenging the descending trendline resistance.
A confirmed breakout and retest of the triangle and resistance zone may open the door for a bullish continuation toward 147.50, and potentially 150.00+, as marked on the chart. However, if the breakout fails, we may see a pullback toward the 145.00–144.80 support region before any further upside.
This setup highlights a potential breakout-retest-continuation scenario. Traders should watch for price action confirmation near the trendline for further direction.
JPYUSD trade ideas

USDJPY: Ready for Wave 5?USDJPY is showing a strong bullish wave structure, with a clear path toward higher levels based on Elliott Wave Theory. After a successful breakout from a multi-year consolidation, price action appears to be completing a Wave (4) correction thereby setting the stage for a Wave (5) rally.
Based on the bullish structure and projected continuation:
1st Target = 157.78
2nd Target = 177.41
Final Target = 209.16 Full wave extension, top of macro channel
With support holding above ¥140.00 and a bullish bounce forming, this could mark the Wave C bottom of (4), setting the stage for the next major leg up.
Disclaimer:
This analysis is for informational and educational purposes only and does not constitute financial advice. Markets are dynamic and unpredictable.

USDJPY is about to sell down for long timeFrom the chart, you can see that usdjpy is about to sell for a long time.
Reason;
1, Third trendline touch
2, double top
3, small ascending channel

USDJPY ANalysis week 26Fundamental analysis
The Fed kept interest rates unchanged and forecast only a small cut in 2026-2027 due to concerns about high inflation. The number of officials opposing a rate cut this year increased. The Israel-Iran conflict escalated, the US may attack Iran but is waiting for Tehran's response, causing the Japanese Yen to appreciate thanks to its safe-haven role.
Japan and the US have not reached a trade deal, the risk of higher tariffs before the July 9 deadline. The US dollar is near a one-week high, supporting the USD/JPY pair, but investors remain cautious due to the lack of new economic data.
Technical analysis
USDJPY is rising quite strongly and reacting at the resistance zone of 146.200. There is a possibility of a price gap next week, so trading early will be quite risky. The trading range is expected to be clearer at the resistance and support zones. 146,800 and 147,700 are noted as the two important upper boundary zones. 145,400 and 144,400 will be important support zones with a very strong buyer force waiting.
Trading Signals

USD/JPY - Potential TargetDear Friends in Trading,
How I see it,
Key resistance breached.
Strong full body weekly close.
Can bull trend & support hold?
"LONG" Target:
1] 147.700
Keynote:
A 1D candle body close below 145.000 will invalidate this thesis.
I sincerely hope my point of view offers a valued insight.
Thank you for taking the time to study my analysis.


USD/JPY breakthrough & long position? (novice analysis) #techFrom what I've seen so far, USD/JPY has the momentum to try to break through 146.093 and is heading towards 146-147.
The price could make a pullback around the first key level before breaking through, if not, I would anticipate the price making a retracement after breaking through
Hi, I'm not good at trading, and I'm still learning. I explore trading alone myself and also use online free sources to improve. If somewhere mistakes please notify me
Thank you.

buy is coming on USDJPYThe USD/JPY pair recently experienced a bearish movement, which is largely influenced by heightened concerns surrounding the ongoing trade and tariff tensions between the U.S. and its global counterparts. This risk-off sentiment triggered a flight to safe-haven assets, weighing on the pair.
However, price action has now approached a key trendline support zone, which has held firmly in previous sessions. Technical indicators like RSI are also beginning to show signs of bullish divergence, suggesting a potential reversal. If this trendline continues to act as strong support, we may see a bullish bounce from the current level, aligning with the overall ascending trend structure but if the trade break these support zones, then the bearish movement might continues
for now we will be watching for confirmation signals such as bullish candlestick patterns or a break above near-term resistance levels to validate the upward movement.

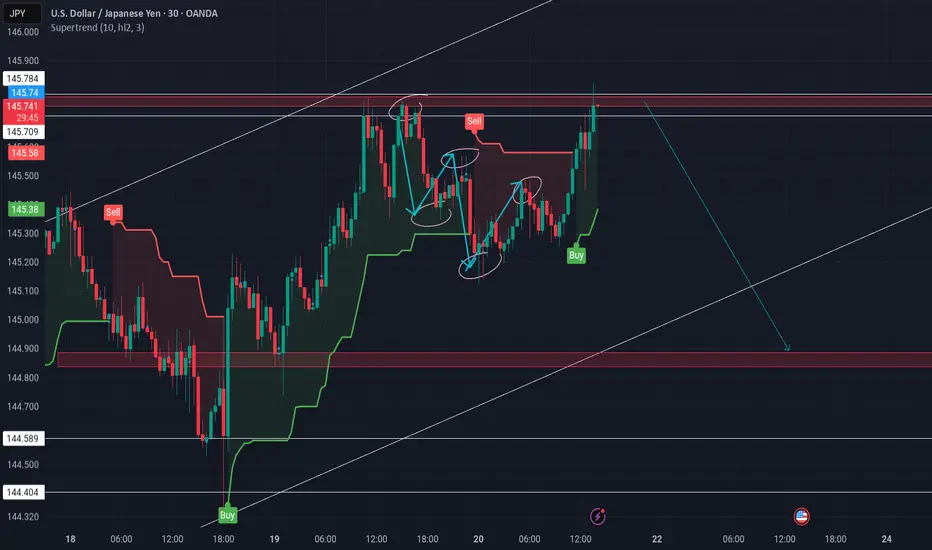
USD/JPY Short1. Intervention-fade (always live)
Sell Limit 146.00
Stop Loss 146.80
Take-Profit 1 144.50 – if hit, move stop to breakeven
Take-Profit 2 143.00
Good-till-cancelled: auto-cancel if not filled after 5 trading days
2. Break-and-retest (place this only after a daily candle closes below 145.00)
Sell Limit 145.20
Stop Loss 146.00
Take-Profit 1 144.00
Take-Profit 2 143.00
Good-till-cancelled: auto-cancel if not filled within 5 trading days of being placed
Rule: the moment one of these orders fills, cancel the other so you never have two USD/JPY shorts open at the same time.

Short term sell into buying zone.USDJPY is at a prime zone... Where everyone is glued and carried away with the bullish move, let me point you out to the market structure.

Lingrid | USDJPY Breakout Could Trigger Strong Bullish RallyFX:USDJPY is approaching a retest of the 144.20–144.30 support band after rebounding from a wedge breakdown and reclaiming structure within a broader ascending formation. Price remains under the downward trendline, but a successful bounce here could fuel another push toward 146. A higher low above 144.20 would confirm bullish intent.
📈 Key Levels
Buy zone: 144.20–144.40
Sell trigger: breakdown below 144.00
Target: 146.00
Buy trigger: breakout and hold above 145.00
💡 Risks
Rejection at the downward trendline limits upside potential
Failure to hold the 144.20 base could reverse the bullish structure
JPY strength from macro news could suppress breakout attempts
Traders, if you liked this idea or if you have your own opinion about it, write in the comments. I will be glad 👩💻

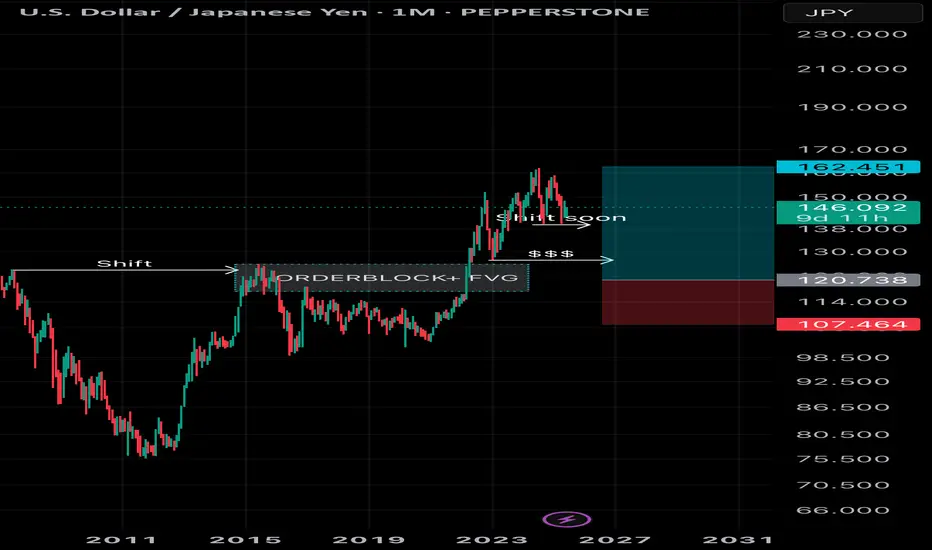
Mega long for the year 2027-2030Here is an idea for USDJPY pair. Im looking for a long term long position when price sweeps liquidity and react at the OrderBLock and FVG marked in my analysis. First of all, I expect a market shift in the near term, as i marked it(shift soon). Maybe a short position there wont be bad
*USDJPY| Weekly Breakdown - Bulls Took OverUJ was all bullish this week, no question about it. The chart made it clear—30M structure stayed intact, and market flow shifted heavily in favor of the buyers.
Liquidity was taken along the way, with higher lows stacking up clean, setting the stage for further continuation to the upside.
Not overcomplicating this one—bulls won the battle, and structure confirmed it. Now we look for smart ways to join that strength as price builds momentum into next week.
Stay with the flow, not against it.
Bless Trading!

UJ longUJ is making HH's / HL's and is heading towards the next weak high.
Upcoming weak has a lot of high impact news, so I would expect a deep mitigation first before the continuation towards new higher highs.

Analysis of Trades and Trading Tips for the Japanese YenThe price test at 144.27 occurred when the RSI indicator had already moved significantly above the zero line, but the strong U.S. labor market data offered a high probability of the dollar strengthening against the yen, which I decided to take advantage of. As a result, the pair rose toward the target level of 145.06.
The confident growth in U.S. non-farm employment recorded in May exceeded experts' expectations' causing noticeable fluctuations in currency, markets. The publications of data showing the creation of 139,7000 new jobs versus the forecasted 127,000 instantly strengthened the U.S. dollar, putting pressure on the Japanese yen. The yen's reaction to the news was immediate: the currency weakened significantly against the dollar. Investors perceived the data as a signal of the strength of the U.S. economy and the likely continuation of Federal Reserve's tight monetary policy. Furthermore, the stable unemployment rate in the U.S. recorded at 4.2%, also reinforced the market's optimistic sentiment.
Today's data shows that Japan's GDP for the first quarter was revised upward, which helped the yen recover slightly from Friday's losses against the U.S. dollar. However, despite the positive revision, Japan's economy still faces serious challenges. Weak domestic demand and an aging population continue to pressure growth, while geopolitical uncertainty poses additional obstacles. The Bank of Japan maintains a wait-and-see approach and has no plans to raise interest rates for now, which had previously provided good support to the the yen. Strong growth in bank lending also contributed to increased demand for the yen.


DOLLAR; ITS A WRAP.We are done with the week. If you've not been profitable no need for panic cause the market never stops running.We will still have plenty of opportunities to come, what's important is to remain calm and sane and prepared for a new week.
Always trust the process and have a lovely weekend.

Reason for SELL (USDJPY M30)1. [Strong Resistance Zone
Price reached a key resistance (red zone) that was rejected multiple times before.
USDJPY-bias long Bullish indications:
Major support respected
Inverted HS formation in 15 min time frame.
Inverted hammer candle in 4 hr
Bullish divergence in 1 hr
Trend line resistance broken .
Bearish indications:
Lower lows lower highs.
Trade plan bias long @ 140.815
SL:140.429
TP1:141.300
TP2:141.708

USDJPY Is Going Down! Short!
Please, check our technical outlook for USDJPY.
Time Frame: 12h
Current Trend: Bearish
Sentiment: Overbought (based on 7-period RSI)
Forecast: Bearish
The market is approaching a key horizontal level 145.574.
Considering the today's price action, probabilities will be high to see a movement to 144.101.
P.S
Please, note that an oversold/overbought condition can last for a long time, and therefore being oversold/overbought doesn't mean a price rally will come soon, or at all.
Disclosure: I am part of Trade Nation's Influencer program and receive a monthly fee for using their TradingView charts in my analysis.
Like and subscribe and comment my ideas if you enjoy them!

Yen Edges Higher as Inflation SurgesThe Japanese yen traded stronger near 145 per dollar, rebounding as Japan’s core inflation rose for the third straight month to 3.7%, its highest since January 2023. The data strengthens expectations that the Bank of Japan may continue policy tightening.
Earlier in the week, the BOJ held rates at 0.5% but highlighted how rising wages are being passed on to consumers, keeping inflation elevated. Governor Kazuo Ueda emphasized a data-driven path forward, keeping the door open for more hikes if needed.
The key resistance is at $145.30, while the major support is located at $142.50.
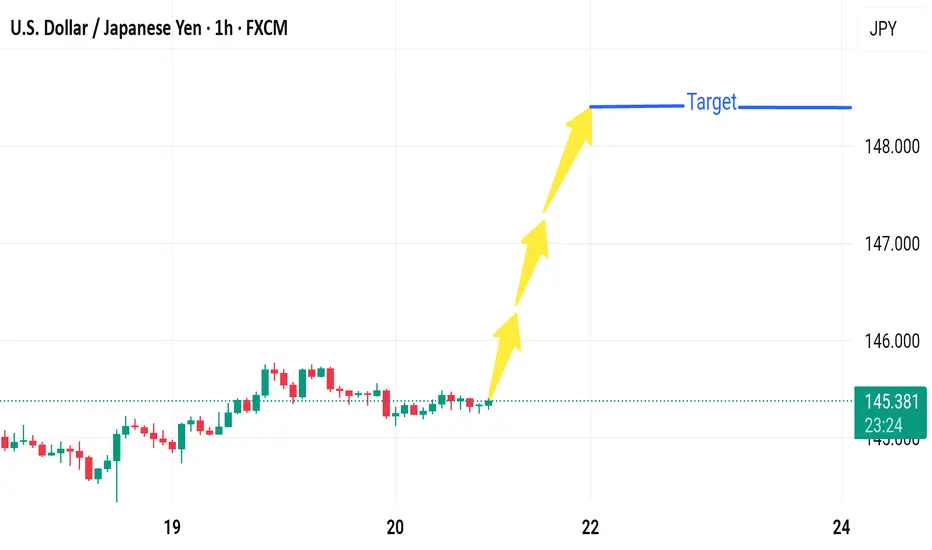
USDJPYUSD (DXY-based futures):
➤ +1,402 → modest net-long position (buying bias)
JPY (Japanese Yen futures):
➤ +144,595 → extremely net-long, near record levels
What This Means:
USD +1,402 = Mild bullish sentiment — large traders are slightly buying USD, but not aggressively.
JPY +144,595 = Very strong bullish sentiment — hedge funds and institutions are heavily buying JPY, suggesting they expect it to strengthen.
This gives a bearish bias for USD/JPY:
If JPY buying continues, USD/JPY may decline.
Bias: Short USD/JPY

Market next move 🔻 Disruptive Analysis – Bearish Scenario
1. Resistance Rejection:
Price has stalled around 145.40, showing hesitation.
The target area (~148.000) hasn't been tested yet, and prior attempts to break higher may face heavy resistance from institutional sell orders or prior supply zones.
2. Range-Bound Structure:
Current price action shows consolidation — multiple small-bodied candles.
Lack of volume or momentum may indicate accumulation or distribution — not necessarily a bullish breakout setup.
3. Potential Bearish Triggers:
If price breaks below 145.00, a short-term bearish move could occur toward:
144.30 – recent swing low support.
143.80 – demand zone based on prior accumulation.
4. Macro Disruptors:
Surprise BoJ intervention or hawkish policy tone could strengthen the Yen.
A dovish Fed statement or poor U.S. economic data could drag USD down sharply.
---
📉 Alternate Scenario Chart Sketch (Hypothetical):
148.000 ──────── (Target denied - strong resistance)
↑
Rejection
↓
145.000 ──────── (Breaks support)
↓
144.300 ──────── (First bearish target)
↓
143.800 ──────── (Deeper retracement zone)