Fundamental Market Analysis for May 30, 2025 USDJPYThe Japanese yen (JPY) attracted strong follow-through buying for the second consecutive day on Friday and continued to recover from a two-week low reached the previous day against the US dollar. Global risk sentiment deteriorated after a federal appeals court on Thursday suspended a recent ruling blocking US President Donald Trump's radical tariffs. This is evident from the general weakening of sentiment in the stock markets and is contributing to a recovery in demand for traditional safe-haven assets, including the JPY.
Meanwhile, optimistic macroeconomic data from Japan released today, including strong consumer inflation figures in Tokyo, confirm the need for further interest rate hikes by the Bank of Japan (JPY) and provide additional support for the JPY. On the other hand, the US dollar (USD) is consolidating after a sharp reversal yesterday amid concerns about the deterioration of the US financial situation and bets that the Federal Reserve (Fed) will stick to its easing policy. This further contributes to the continued decline of the USD/JPY pair.
Trading recommendation: SELL 143.800, SL 144.200, TP 142.900
JPYUSD trade ideas

USDJPY SELL IDEA!!Price has been reacting around the 148.000 level forming a head and shoulder bearish pattern. a break below the neckline insight a sell opportunity.
fundamentally, Bank of Japan intend to move forward with additional interest rate hikes, and market participant are anticipating a 25 basis point increase in July. it's safe to short USDJPY as further decline is anticipated.

Could the price bounce from here?USD/JPY is falling towards the pivot and could bounce to the 1st resistance, which acts as a pullback resistance.
Pivot: 143.25
1st Support: 141.80
1st Resistance: 145.97
Risk Warning:
Trading Forex and CFDs carries a high level of risk to your capital and you should only trade with money you can afford to lose. Trading Forex and CFDs may not be suitable for all investors, so please ensure that you fully understand the risks involved and seek independent advice if necessary.
Disclaimer:
The above opinions given constitute general market commentary, and do not constitute the opinion or advice of IC Markets or any form of personal or investment advice.
Any opinions, news, research, analyses, prices, other information, or links to third-party sites contained on this website are provided on an "as-is" basis, are intended only to be informative, is not an advice nor a recommendation, nor research, or a record of our trading prices, or an offer of, or solicitation for a transaction in any financial instrument and thus should not be treated as such. The information provided does not involve any specific investment objectives, financial situation and needs of any specific person who may receive it. Please be aware, that past performance is not a reliable indicator of future performance and/or results. Past Performance or Forward-looking scenarios based upon the reasonable beliefs of the third-party provider are not a guarantee of future performance. Actual results may differ materially from those anticipated in forward-looking or past performance statements. IC Markets makes no representation or warranty and assumes no liability as to the accuracy or completeness of the information provided, nor any loss arising from any investment based on a recommendation, forecast or any information supplied by any third-party.

USDJPY SHORTUSDPY is expected to sell to complete the gartley pattern.
Look out for the quasimodo pattern on the 4hr or 8hr time frame to short

USDJPY H1 I Bullish Reversal Based on the H1 chart analysis, the price is falling our buy entry level at 143.27, a pullback support.
Our take profit is set at 144.85, a pullback resistance that aligns with the 50% Fibonacci retracement.
The stop loss is placed at 142.12, a swing low support.
High Risk Investment Warning
Trading Forex/CFDs on margin carries a high level of risk and may not be suitable for all investors. Leverage can work against you.
Stratos Markets Limited (tradu.com ):
CFDs are complex instruments and come with a high risk of losing money rapidly due to leverage. 63% of retail investor accounts lose money when trading CFDs with this provider. You should consider whether you understand how CFDs work and whether you can afford to take the high risk of losing your money.
Stratos Europe Ltd (tradu.com ):
CFDs are complex instruments and come with a high risk of losing money rapidly due to leverage. 63% of retail investor accounts lose money when trading CFDs with this provider. You should consider whether you understand how CFDs work and whether you can afford to take the high risk of losing your money.
Stratos Global LLC (tradu.com ):
Losses can exceed deposits.
Please be advised that the information presented on TradingView is provided to Tradu (‘Company’, ‘we’) by a third-party provider (‘TFA Global Pte Ltd’). Please be reminded that you are solely responsible for the trading decisions on your account. There is a very high degree of risk involved in trading. Any information and/or content is intended entirely for research, educational and informational purposes only and does not constitute investment or consultation advice or investment strategy. The information is not tailored to the investment needs of any specific person and therefore does not involve a consideration of any of the investment objectives, financial situation or needs of any viewer that may receive it. Kindly also note that past performance is not a reliable indicator of future results. Actual results may differ materially from those anticipated in forward-looking or past performance statements. We assume no liability as to the accuracy or completeness of any of the information and/or content provided herein and the Company cannot be held responsible for any omission, mistake nor for any loss or damage including without limitation to any loss of profit which may arise from reliance on any information supplied by TFA Global Pte Ltd.
The speaker(s) is neither an employee, agent nor representative of Tradu and is therefore acting independently. The opinions given are their own, constitute general market commentary, and do not constitute the opinion or advice of Tradu or any form of personal or investment advice. Tradu neither endorses nor guarantees offerings of third-party speakers, nor is Tradu responsible for the content, veracity or opinions of third-party speakers, presenters or participants.

USDJPY -Cup and Handle pattern Sell Short Cup and Handle Pattern Trend Continuation . entry can be taken on the break of neckline with projected TPs and Stoploss as mentioned.

USDJPY Stock Chart Fibonacci Analysis 052925Trading Idea
1) Find a FIBO slingshot
2) Check FIBO 61.80% level
3) Entry Point > 144.4/61.80%
Chart time frame:D
A) 15 min(1W-3M)
B) 1 hr(3M-6M)
C) 4 hr(6M-1year)
D) 1 day(1-3years)
Stock progress: A
A) Keep rising over 61.80% resistance
B) 61.80% resistance
C) 61.80% support
D) Hit the bottom
E) Hit the top
Stocks rise as they rise from support and fall from resistance. Our goal is to find a low support point and enter. It can be referred to as buying at the pullback point. The pullback point can be found with a Fibonacci extension of 61.80%. This is a step to find entry level. 1) Find a triangle (Fibonacci Speed Fan Line) that connects the high (resistance) and low (support) points of the stock in progress, where it is continuously expressed as a Slingshot, 2) and create a Fibonacci extension level for the first rising wave from the start point of slingshot pattern.
When the current price goes over 61.80% level , that can be a good entry point, especially if the SMA 100 and 200 curves are gathered together at 61.80%, it is a very good entry point.
As a great help, tradingview provides these Fibonacci speed fan lines and extension levels with ease. So if you use the Fibonacci fan line, the extension level, and the SMA 100/200 curve well, you can find an entry point for the stock market. At least you have to enter at this low point to avoid trading failure, and if you are skilled at entering this low point, with fibonacci6180 technique, your reading skill to chart will be greatly improved.
If you want to do day trading, please set the time frame to 5 minutes or 15 minutes, and you will see many of the low point of rising stocks.
If want to prefer long term range trading, you can set the time frame to 1 hr or 1 day.

USD/JPY PIVOT AREA INTRADAYThe USD/JPY pair strongly reversed all the previous sessions gains and now is at our pivot area shown with a possible continuation of the bearish pressure .
The break of our pivot could target 142.79 and 141.79 as next possible targets.
However if the price holds above then 145.12 and 146.11 will be what the bulls aim for.

USD/JPY Reverses from ResistanceUSD/JPY is poised to snap a three-day winning streak with price reversing today at the 61.8% retracement of the monthly range. A decline of more than 1.5% from the highs puts the immediate focus on the monthly range lows with a break needed to mark resumption of the broader downtrend.
Monthly open support rests at 143.06 and is backed by the May opening-range lows (ORL) at 142.35. A break below this threshold exposes the yearly low day close (LDC) at 141.56 and key support at the December lows / 61.8% retracement of the 2023 advance at 140.25/49- look for a larger reaction there IF reached.
Initial resistance stands at 146.15 and is backed by the 78.6% retracement at 147.25. A topside breach / close above the upper parallel (blue) is needed to invalidate the yearly downtrend with subsequent objectives eyed at 148.39/65 and the 200-day moving average / March high-day close (HDC) around 149.46/50.
Bottom line: USD/JPY exhausted into technical resistance this month with today’s reversal threatening resumption of the broader downtrend. From a trading standpoint, rallies should be limited to 147.25 IF price is heading lower on this stretch with a close below the monthly range needed to fuel the next leg of the decline.
-MB

USDJPY TECHNICAL ANALYSIS.This chart shows a technical analysis of USD/JPY (U.S. Dollar / Japanese Yen) on a 1-hour timeframe, published on May 27, 2025. Here's the breakdown:
Current Price: 143.975, with a notable upward movement (+0.79%).
Descending Wedge Pattern: The red trendlines show a falling wedge—a bullish reversal pattern.
Breakout: Price has broken above the wedge and is now rallying.
Support Zone: Highlighted rectangle (around 142.000–143.000), acting as a demand zone where price consolidated before breaking out.
Bullish Setup:
Entry Trigger: Breakout from the wedge + strong bullish candles.
Target: 145.119, marked with a target icon, just above the recent highs.
Projected Path: Zigzag upward trajectory drawn with green arrows suggests expected bullish continuation.
Summary:
This chart supports a long position idea based on a wedge breakout and strong momentum. The trader anticipates the price to rise toward 145.119. Risk management (SL level) isn’t explicitly marked but would typically sit below the support zone (~142.000).
Would you like help setting up trade parameters (entry, SL, TP) or automating alerts for a setup like this?

USDJPY Bullish Pullback Setup – Targeting 145.800
USDJPY has broken out of the previous downtrend structure and is now showing a potential bullish continuation pattern.
- The recent impulse move from the demand zone (highlighted in blue) confirms buying interest around 143.600.
- The current pullback could offer a buy opportunity, especially if the price retests the 143.600 support zone or forms a higher low.
- As long as the price holds above this key support, we expect the pair to continue upward toward the next major resistance at 145.800.
USDJPY is forming a clean bullish correction after an impulsive move up. If support at 143.600 holds, the next bullish leg could extend to 145.800. Watch for bullish confirmation near the pullback zone.

USDJPY Faces An Intraday Corrective RecoveryUSDJPY Faces An Intraday Corrective Recovery after a bearish impulse, which can later send the price lower from technical and Elliott wave pespective.
USDJPY is sharply bouncing after reaching May lows within the wedge pattern for wave »v« of an impulse, so it can be now trading in a higher degree abc correction, which can recover the price back to 145 – 146 resistance area before bears return.
Basic bearish Elliott wave pattern shows that a five-wave impulsive decline indicates for more weakness after a corrective three-wave pause.

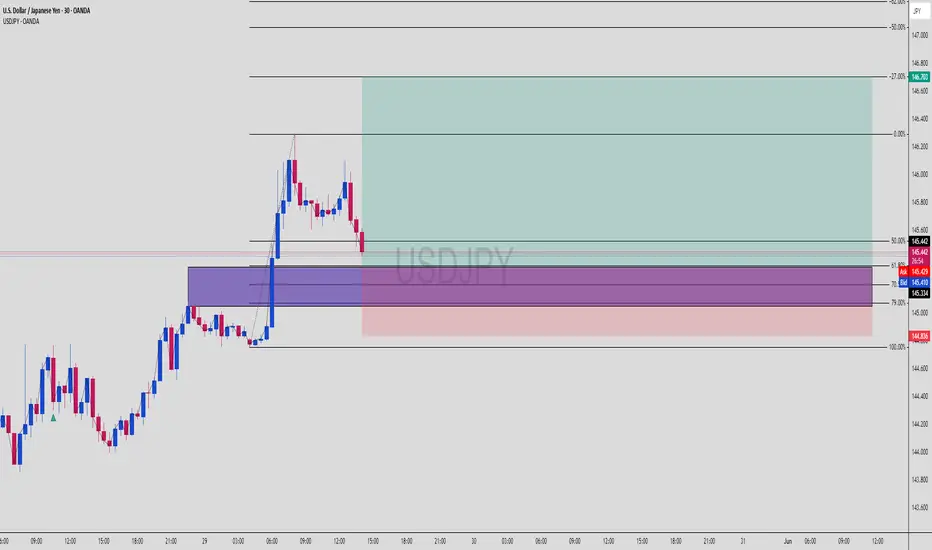
USDJPY SMC Play | Order Block + Fibo 61.8 = Precision EntryUSDJPY | Confluence Entry in Motion 🚀
A beautifully aligned setup using Smart Money Concepts, with a clear entry mapped out at the OB + Fib 61.8% retracement zone. Price just tapped into the purple zone — now it’s all eyes on bullish momentum confirmation.
📊 1. Market Overview
USDJPY has been trending bullish, with a strong impulsive move followed by a retracement — price is now sitting at a key decision zone.
The zone is a refined bullish Order Block (purple) aligning perfectly with:
✅ 61.8% Fibonacci retracement
✅ 70.5% golden zone
✅ Strong imbalance below
We’re seeing a beautiful reaction candle off this area as price hunts liquidity.
🧠 2. Why This Trade Makes Sense (SMC Breakdown)
Here’s the logic:
Price broke structure to the upside
Pullback into OB + discounted pricing
Clean liquidity sweep just beneath the short-term low
Room for continuation toward higher timeframe POI (top green zone)
This is a textbook SMC + Fibonacci sniper setup.
🎯 3. Entry Zone (Purple Box)
📍 OB Zone: 145.200 – 145.334
🧮 Fib Levels:
— 50%: 145.595
— 61.8%: 145.334
— 70.5%: ~145.200
— 100% (SL): 144.836
Your entry's beautifully layered with confluences = 🔥 Risk/Reward.
🚀 4. Target Zones
🟢 TP1: 146.000
🟢 TP2: 146.703
(TOP of the Fibonacci extension, completing the full bullish leg)
⚖️ 5. Risk-Reward Setup
✅ SL: 144.836
✅ Entry: around 145.334
✅ TP: 146.703
👉 RRR: Over 1:4 — institutional grade 🔥
🛡️ 6. Trade Management Tips
✅ Wait for bullish engulfing or LTF break of structure for confirmation
🕰️ Drop to M15 for precise sniper confirmation entry
🔄 If it taps again with more imbalance left = re-entry possible
📌 Save this if you love high confluence entries
🔥 Drop “SMC Sniper” in the comments if you're watching this pair
👀 Follow for daily setups just like this — clean, confident, and calculated
CHECK USDJPY SIGNAL READ CAPTAIN(usdjpy) buy zone
(trade satup)
entry point (145.000) to (144.900) 📊
first target (145.200)📊
2nd target (145.500) 📊
last target (145.800) 📊
stop loss (144.500)❌

USD/JPY 1H Analysis – Channel Breakout and Buy SignalOverview:**
The USD/JPY chart shows a **bullish breakout from a descending channel**, supported by technical indicators like the Ichimoku Cloud and a strong demand zone. This setup suggests a potential bullish reversal and upward momentum.
*Key Technical Points:**
* **Descending Channel Breakout:**
Price action has broken out of a falling channel, indicating a shift in market sentiment from bearish to bullish.
* **Strong Support Zone:**
Around 143.28 – 143.73, the price found significant support, which aligns with a previous demand zone. This area held firm, helping trigger the breakout.
* **Ichimoku Cloud:**
Price is emerging above the Ichimoku Cloud, signaling a potential start of an uptrend. If the price maintains above the cloud, bullish momentum may strengthen.
* **Resistance Levels:**
* **First Resistance:** Near 146.00 – a critical area to watch for short-term profit-taking.
* **Second Resistance:** Around 148.00 – a more extended target if bullish continuation holds.
---
### **Trading Idea:**
**BUY USD/JPY** on successful retest of the breakout or sustained move above the Ichimoku Cloud.
* **Entry:** 144.30–144.40 zone
* **Target 1:** 146.00
* **Target 2:** 148.00
* **Stop Loss:** Below 143.20 (under the support zone)
---
Conclusion:**
The chart presents a classic **bullish channel breakout** supported by the Ichimoku indicator and price action at a strong support zone. As long as the price holds above the breakout level and Ichimoku Cloud, the upside targets at 146 and 148 remain valid.
Let me know if you want this formatted as a trade plan or journal entry.
To ensure you do not miss the upcoming analysis, be sure to follow me!
Please leave a remark and a like!

USDJPY Shooting Star + Elliott Wave Spells TroubleUSDJPY bounced higher from a horizontal support shelf created from August - September 2024.
The bounce is a second wave. The bearish shooting star candle on the daily chart spells reversal for USDJPY. The bearish wave count using Elliott Wave Theory as our guide as suggests deep cuts may be on the horizon for USDJPY.
We are considering the next decline to be a third wave at multiple degrees of trend. Additionally, the trend lower would break the support shelf and eventually make it to 122 and possibly lower levels.

CHECK USDJPY SIGNAL READ CAPTAINusdjpy signal technical analysis satup 👇🏼
(usdjpy )sell zone
( TRADE SATUP)
ENTRY POINT (145.100) to (145.000) 📊
FIRST TP (144.600)
2ND TARGET (144.050) 📊
LAST TARGET (143.550) 📊
STOP LOOS (145.600)❌
FALLOW RISK MANAGMENT

USDJPY Will Go Lower From Resistance! Sell!
Take a look at our analysis for USDJPY.
Time Frame: 12h
Current Trend: Bearish
Sentiment: Overbought (based on 7-period RSI)
Forecast: Bearish
The market is on a crucial zone of supply 145.162.
The above-mentioned technicals clearly indicate the dominance of sellers on the market. I recommend shorting the instrument, aiming at 142.359 level.
P.S
Please, note that an oversold/overbought condition can last for a long time, and therefore being oversold/overbought doesn't mean a price rally will come soon, or at all.
Disclosure: I am part of Trade Nation's Influencer program and receive a monthly fee for using their TradingView charts in my analysis.
Like and subscribe and comment my ideas if you enjoy them!

Yen Stabilizes as Risk Sentiment ImprovesThe Japanese Yen edged up from a two-week low on Thursday but lacked strong momentum, as risk appetite improved after a U.S. court blocked Trump’s “Liberation Day” tariffs, reducing demand for safe havens. Concerns over Japan’s rising debt continue to pressure the Yen. Meanwhile, USD/JPY rose for a fourth day, supported by hawkish FOMC minutes, though markets still expect a Fed rate cut. Expectations of a more hawkish Bank of Japan helped limit the Yen’s losses.
The key resistance is at $147.10 meanwhile the major support is located at $145.00.

USD/JPY Long-Term Bullish Swing Idea
Sentiment-based swing
Price has reached a key support zone, previously acting as a major turning point. The market has shown clear signs of bullish rejection at this level, suggesting a potential trend reversal. This setup provides a strong basis for a long trade.

USDJPY – Rejected at 146.00, downside risk growsUSDJPY reacted strongly at the 146.00 resistance area – a level where price was previously rejected. After a sharp rally, the pair has turned lower and is now heading toward the 144.00 support zone, which aligns with the EMA 34–89 on the H3 chart.
The chart shows a small double top pattern forming around the recent highs. If USDJPY continues to struggle below 146.00 and breaks through the 144.00 support, a short-term downtrend may be confirmed, with the next target around 142.50.
On the news side: The Japanese Yen is gaining some ground again after the BOJ signaled readiness to adjust its easing policy if inflation consistently exceeds its target. Meanwhile, the USD is under pressure as expectations grow that the Fed may keep interest rates steady in the upcoming meeting, due to cooler consumer data.
Suggested strategy: Consider selling if bearish signals appear around the 145.80–146.00 area, with a short-term target at 144.00.

USDJPY H4 | Bullish Bounce Off Based on the H4 chart analysis, the price is falling our buy entry level at 144.87, a pullback support that aligns with the 38.2% Fibonacci retracement.
Our take profit is set at 146.55, a pullback resistance.
The stop loss is placed at 143.86, a pullback support that aligns close to the 61.8% Fibonacci retracement.
High Risk Investment Warning
Trading Forex/CFDs on margin carries a high level of risk and may not be suitable for all investors. Leverage can work against you.
Stratos Markets Limited (tradu.com ):
CFDs are complex instruments and come with a high risk of losing money rapidly due to leverage. 63% of retail investor accounts lose money when trading CFDs with this provider. You should consider whether you understand how CFDs work and whether you can afford to take the high risk of losing your money.
Stratos Europe Ltd (tradu.com ):
CFDs are complex instruments and come with a high risk of losing money rapidly due to leverage. 63% of retail investor accounts lose money when trading CFDs with this provider. You should consider whether you understand how CFDs work and whether you can afford to take the high risk of losing your money.
Stratos Global LLC (tradu.com ):
Losses can exceed deposits.
Please be advised that the information presented on TradingView is provided to Tradu (‘Company’, ‘we’) by a third-party provider (‘TFA Global Pte Ltd’). Please be reminded that you are solely responsible for the trading decisions on your account. There is a very high degree of risk involved in trading. Any information and/or content is intended entirely for research, educational and informational purposes only and does not constitute investment or consultation advice or investment strategy. The information is not tailored to the investment needs of any specific person and therefore does not involve a consideration of any of the investment objectives, financial situation or needs of any viewer that may receive it. Kindly also note that past performance is not a reliable indicator of future results. Actual results may differ materially from those anticipated in forward-looking or past performance statements. We assume no liability as to the accuracy or completeness of any of the information and/or content provided herein and the Company cannot be held responsible for any omission, mistake nor for any loss or damage including without limitation to any loss of profit which may arise from reliance on any information supplied by TFA Global Pte Ltd.
The speaker(s) is neither an employee, agent nor representative of Tradu and is therefore acting independently. The opinions given are their own, constitute general market commentary, and do not constitute the opinion or advice of Tradu or any form of personal or investment advice. Tradu neither endorses nor guarantees offerings of third-party speakers, nor is Tradu responsible for the content, veracity or opinions of third-party speakers, presenters or participants.

USDJPY Showing potential growthHi there,
The USDJPY appears to have reached a support area and formed a demand zone. It is worth noting that the demand zone is not fully formed yet, as there is no clear higher low above it.
However, the support area suggests that an upward movement might hold despite the bearish pressure seen on the weekly time frame. There is a resistance level at 143.158, and if the price rises above this resistance, the upward momentum could continue.
The levels 143.667 and 144.508 are potential target areas, with a bias toward 145.109.
Happy trading,
K.
Not trading advice
