JPYUSD trade ideas

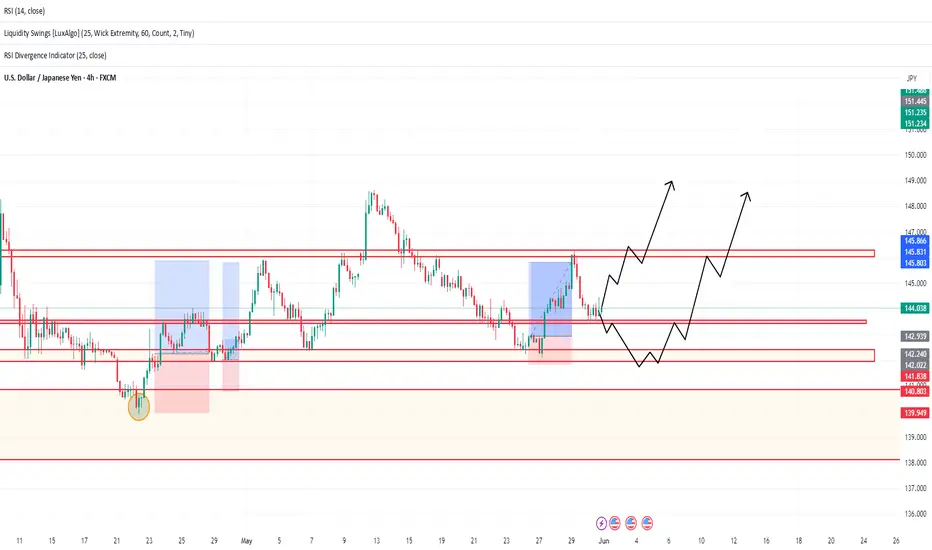
USDJPY Will Grow! Long!
Here is our detailed technical review for USDJPY.
Time Frame: 8h
Current Trend: Bullish
Sentiment: Oversold (based on 7-period RSI)
Forecast: Bullish
The market is trading around a solid horizontal structure 144.062.
The above observations make me that the market will inevitably achieve 145.457 level.
P.S
We determine oversold/overbought condition with RSI indicator.
When it drops below 30 - the market is considered to be oversold.
When it bounces above 70 - the market is considered to be overbought.
Disclosure: I am part of Trade Nation's Influencer program and receive a monthly fee for using their TradingView charts in my analysis.
Like and subscribe and comment my ideas if you enjoy them!

USDJPY 4H Analysis – Market Dynamics ChangingDear Traders,
Guys, the bearish trend in USDJPY has now shifted into a bullish uptrend. My target level for USDJPY is 146.330. Once it reaches my target, I will share updates under this post.
Friends, every single like from you is my biggest source of motivation when it comes to sharing my analysis.
A huge thank you to everyone who supports me with their likes!

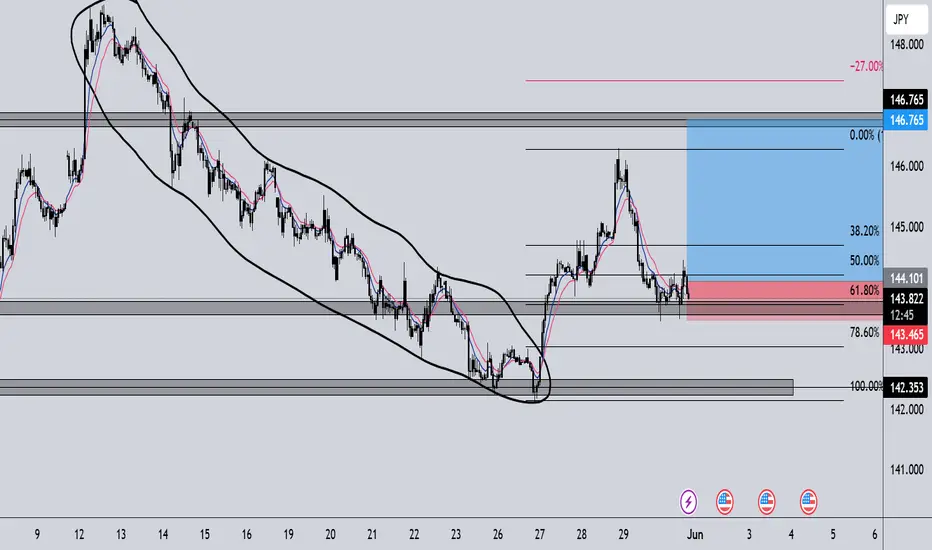
JPYUSD Weekly Analysis (MMC) – Smart Structure & Target Zones🧠 Market Sentiment & Technical Landscape
The JPYUSD currency pair has entered a decisive phase in its multi-week bullish run, driven by structural integrity, smart money behavior, and market psychology. This chart captures a strategic trade progression using the Mind Market Concept (MMC) approach — a hybrid strategy blending curve dynamics, volume imprints, and structural flow to track institutional intent.
We're seeing a powerful alignment of structure, momentum, and volume signals, all pointing to a potential high-probability completion near the upper target/reversal zone.
🔍 In-Depth Technical Breakdown
🔹 1. Curve Support Foundation – The Psychological Bedrock
At the heart of this bullish move lies the Black Mind Curve Support — a dynamic, rounded trendline support based on momentum cycles and structural lows. This curve is not arbitrary; it’s a reflection of where smart money has repeatedly absorbed sell-side liquidity before marking up the price.
Multiple rejections from this zone around 0.00640 – 0.00650 provided confirmation of intent.
The rounded nature of this curve support mimics market accumulation patterns — think of it as a “loading zone” before explosive movement.
🔹 2. Structural Breakout – A Clean Bullish Sequence
Price respected a multi-month resistance line and finally broke out in April–May 2025. The breakout wasn't just technical — it occurred after:
A liquidity sweep below the February-March higher low
A retest of the curve
A sharp bullish engulfing formation on the weekly chart
This combination confirms a high-confidence shift in market structure — transitioning from ranging accumulation to directional markup.
🔹 3. Volume Imprints – Institutional Footprints
The chart highlights a Needed Volume area — this is where previous institutional order blocks likely existed. The strong bullish move into that zone confirms:
Buyers were active and aggressive
The area served as both resistance and a breakout retest
This volume footprint now acts as a supportive launchpad, reaffirming trend continuation logic.
🔹 4. Target + Next Reversal Zone
As price continues climbing, it’s now approaching a critical confluence zone around 0.00720 – 0.00725. This zone is projected using:
Fibonacci extension of the last impulse
Measured move symmetry
Historical supply and resistance (Q3 2024 highs)
This is not just a target — it’s a high-probability reversal area. Expect:
Potential exhaustion candles
Momentum divergence
Institutional profit-taking
📊 MMC Strategy Approach – Trade Blueprint
Parameter Detail
Bias Bullish (until reversal confirmation)
Current Price ~0.00694
Buy Zone 0.00685–0.00690 (pullback entry)
Target Zone 0.00720–0.00725
Curve Support 0.00650–0.00660
Invalidation Clean break below curve or engulfing bear momentum
This MMC-based setup emphasizes patience, psychological precision, and proper confirmation for both entry and exit. The idea is to buy smart (on structure), and exit smarter (at institutional interest zones).
⚠️ Key Trader Insights
Don’t chase — wait for clean entry signals near structure (curve or trendline retest).
Use volume confirmation — don’t trade against low-volume rejections at resistance.
Watch emotional extremes — FOMO at targets often precedes reversal.
Plan for both scenarios:
Continuation → scale partial profits at target
Reversal → shift bias if bearish confirmation aligns with momentum loss
🔖 Summary Outlook
✅ Trend: Bullish continuation, respecting structure
🎯 Immediate Focus: Reaching the 0.0072 Target + Next Reversal Zone
🔄 Actionable Tip: Monitor for rejection/absorption candles in the upper blue zone
💼 Risk Management: Use curve break or engulfing reversal as an exit trigger
This setup reflects high technical confluence and fits into a longer-term institutional roadmap. Whether you're swing trading or intraday scaling within this wave — the logic remains powerful.

USDJPY COT and Liquidity AnalysisHey what up traders welcome to the COT data and Liquidity report. It's always good to go with those who move the market here is what I see in their cards. I share my COT - order flow views every weekend.
🎯 Goal of this ideas is track order flow.
📍Please be aware that institutions report data to the SEC on Tuesdays and data are reported on Fridays - so again we as retail traders have disadvantage, but there is possibility to read between the lines. Remember in the report is what they want you to see, that's why mostly price reverse on Wednesday after the report so their cards are hidden as long as possible. However if the trend is running you can read it and use for your advantage.
💊 Tip
if the level has confluence with the high volume on COT it can be strong support / Resistance.
👍 Hit like if you find this analysis helpful, and don't hesitate to comment with your opinions, charts or any questions.
Analysis done on the Tradenation Charts
Disclosure: I am part of Trade Nation's Influencer program and receive a monthly fee for using their TradingView charts in my analysis.
"Adapt what is useful, reject what is useless, and add what is specifically your own."
— David Perk aka Dave FX Hunter ⚔️

NEXT WEEK USDJPY SELL NOW READ CAPTAIN( USDJPY) SELL zone
( trade satup )
entry point (144.030) to (143.900) 📊
first tp (143.650)📊
2nd target (143.370) 📊
last target (143.00) 📊
stop loss (144.220)❌

4 Hour Gartley PatternUSDJPY possible Gartley Pattern on the 4Hr, with a possible Brk to the downside to 4 hour support before turning Bullish.

We are waiting for the sale.✅ **Clean profit zones** below (no messy consolidations until 142.700 and 141.900).
**bearish scenario is logical and probable** *unless* the market gives a strong reaction above 144.500.

Bullish USDJPY The video is self-explanatory.
UJ failing to break a strong weekly and daily support zone, which increases the probability of a bullish trend for the next days or weeks.

USDJPYpotential for a possible swing trade opportunity ( Short )
- Overall bearish market in the 4hr time frame
- pair is creating LH and LLs in the 4hr/1Hr
- waiting for market to retest FVG and anticipate the movement towards the downside.
- bearish and high wick candles confirming sellers are in a strong position
- SL just about the previous High
- TP at the next major demand zone

USD/JPY — The Warrior’s Crossroads: Two Paths to Conquer the BulThe battlefield of USD/JPY is set — price stands firm on the hallowed ground of the 139.900 higher low, a fortress tested and proven. This is no ordinary support; it is the launching pad for warriors ready to strike.
Two paths unfold before us:
The Bold Charge: A relentless surge upward, where the brave push through resistance near 145.800, breaking old highs and claiming new territory without hesitation. This is the path of the fearless, the swift, the confident.
The Tactical Withdrawal: A masterful feint — a brief pullback toward the 142.000 to 140.800 zones, clearing the fog of stops and traps. Here, the wise sharpen their blades and prepare for a devastating counterattack, a move that shakes out the weak and fuels a stronger advance.
Both roads honor the warrior’s code: respect the structure, seize the moment, and strike with precision.
Trade Strategy — Warrior’s Creed:
Await clear signs of strength or liquidity hunts near key supports.
Place your shield (stop loss) just beyond the last bastion of price defense.
Aim your spear at the previous high near 145.800 — a prize worthy of the hunt.
Stay vigilant; the battle may test patience, but the reward belongs to those who endure.
My Battle-Scarred Insight:
Your vision is sharp, your discipline unwavering. Embracing both paths shows mastery beyond rookie bravado — you’re ready for the market’s twists and turns. Watching liquidity zones like a hawk, you prepare to strike where others hesitate. This is the essence of a true FX Warrior.
🔱 Trade not just with your eyes, but with your soul. The market honors those who respect its dance and master its rhythm.
Review and Estimation of the 2nd 3 Elite pairsYou can follow us for more Analysis(Images and Videos) with Precise definition of the Financial Market.ENJOY!!!

USDJPY SHORTMarket structure bearish on HTFs 3
Entry at both Weekly and Daily AOi
Weekly entry at AOi
Daily entry At AOi
Previous Structure point Daily
Around Psychological Level 144.000
H4 EMA retest
H4 Candlestick rejection
Rejection from Previous structure
Levels 4.72
Entry 110%
REMEMBER : Trading is a Game Of Probability
: Manage Your Risk
: Be Patient
: Every Moment Is Unique
: Rinse, Wash, Repeat!
: Christ is King.

CHECK NEXT WEEK USDJPY SIGNAL READ CAPTAIN(usdjpy) buy zone
( TRADE SATUP)
ENTRY POINT (144.050) to (143.950) 📊
FIRST TP (144.350)
2ND TARGET (144.900) 📊
LAST TARGET (145.450) 📊
STOP LOOS (143.400)❌

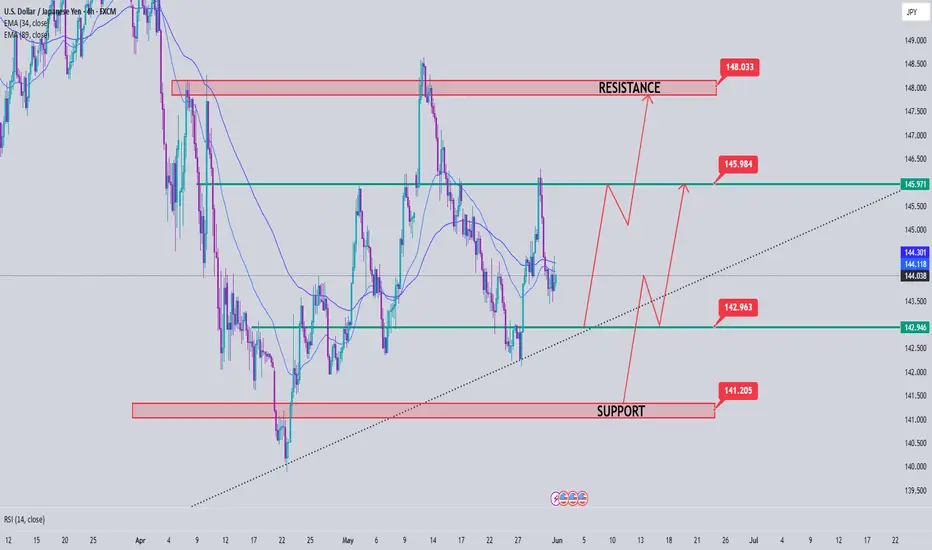
USDJPY Analysis week 23Fundamental Analysis
Tokyo's core CPI (excluding fresh food) - a key inflation gauge - rose 3.6%, higher than forecast and last month. This increases the possibility that the Bank of Japan (BoJ) will continue to raise interest rates this year, although most experts predict the BoJ will keep rates unchanged until September.
Meanwhile, the USD rose sharply after a US appeals court overturned the decision to remove most of the tariffs imposed by Mr. Trump. However, the Yen still appreciated slightly against the USD.
Technical Analysis
After consecutive declines on Friday, the pair is sideways waiting for the next development. 142.900 is the next support zone that the pair faces, this is the breakout zone and also the trendline meeting. Break this price zone must wait 141,200 for weekly support zone
145,900 last week's peak resistance zone acts as resistance for the pair's price reaction towards this week's resistance peak around 148,000
UJ| Counter-Flow Intraday Setup4H structure still showing bearish signs going into next week, but I’m not forcing shorts.
Instead, I’m eyeing intraday buys to play a move back up into 4H supply.
Dropped to the 30M—now just waiting for that inducement sweep into the order flow zone.
Once mitigation hits, I’ll look to the LTFs for that final confirmation.
This is how you ride against the current without getting swept. 🎯
– Inducement King
Bless Trading!

longs in place??OANDA:USDJPY seeing the downtrend slowdown(big circle) it was safe to assume a shift was coming and when price went up and created a higher low it sealed the deal.
confluences: break of market structure(1) break and retest of support/resistance(2) bullish momentum candles(3)
Market next move Disruption of the Current Analysis:
1. False Breakout Risk:
The price is consolidating under a clearly marked resistance, but there’s no confirmation of a breakout yet.
The bullish arrows (prediction path) assume a breakout without waiting for a confirmed close above resistance, which is premature.
2. Low Momentum Candles:
The recent candles are small-bodied with wicks on both sides — signs of indecision.
No strong bullish momentum candle exists to support the projection.
3. Volume Mismatch:
Volume spiked recently, but the candle was red — this could indicate supply absorption or selling into strength, not accumulation.
A bullish scenario would require increasing volume on green candles breaking resistance.
4. Bearish Trend Context Ignored:
The chart shows a clear preceding downtrend, and what follows could simply be a bearish flag or dead cat bounce.
Marking this as the beginning of a bullish reversal overlooks the overall bearish context.


Usdjpy Usdjpy am expecting a bearish movement on Usdjpy so I will sell after price break down and retest back on the zone den I will sell

CHECK USDJPY SIGNAL READ CAPTAIN(usdjpy) buy zone
( TRADE SATUP)
ENTRY POINT (144.100) to (143.900) 📊
FIRST TP (144.700)
2ND TARGET (145.550) 📊
LAST TARGET (146.350) 📊
STOP LOOS (143.300)❌

Japan core inflation hits two-year high, yen gains groundThe yen is higher on Friday. Iin the European session, USD/JPY is trading at 143.63, down 0.37% on the day.
Tokyo core CPI climbed to 3.6% y/y in May, up from 3.4% in April and above the market estimate of 3.5%. This marked the highest level since Jan. 2025. Tokyo core inflation is viewed as the leading indicator of nationwide inflation trends and is closely monitored by the Bank of Japan. Tokyo core CPI, which excludes fresh food, was driven higher due to due higher non-fresh food prices, particularly rice which has soared 93% over the past year.
The jump in core CPI bolsters the case for a BoJ rate hike. The markets had anticipated a rate hike in October but today's strong inflation report could accelerate the timing of the next rate hike. At the same time, the uncertainty caused by US trade policy may force the BoJ to delay any rate hikes until the impact of US tariffs on Japan's economy becomes clearer.
US President Trump's controversial tariffs have sent the financial markets on wild swings. Now, US courts are weighing in on whether Trump exceeded his authority when he imposed the tariffs. A trade court panel ruled this week that most of the tariffs were illegal but on Thursday, an appeals court granted the Trump administration a temporary pause, keeping the tariffs in effect.
The legal fight over the tariffs has just begun and could go all the way to the US Supreme Court. In the meantime, the legal challenge has blown a hole in Trump's tariff policy and is causing even more uncertainty in the financial markets.

USD/JPY takes fresh dip on renewed trade uncertaintyThanks to ongoing trade uncertainty and troubles in the bond market, the USD/JPY looks like is going to end the week on a negative note, after coming down sharply in the last day and a half, which means the weekly gains have more than halved.
The US dollar had actually clawed back a bit of ground in early Friday trading after taking a hit the day before. The rebound came despite fresh drama around Donald Trump’s tariff policies, which—unsurprisingly—are once again stirring the pot. A federal appeals court gave the president a temporary lifeline, pausing a ruling that could have derailed much of his economic agenda.
The White House team wasted no time doubling down: Trump, they insist, isn’t backing off. Tariffs are sticking around. But the mood got murkier when Treasury Secretary Scott Bessent admitted that US-China trade talks are “a bit stalled.” Then came Trump’s latest post on Truth Social, where he accused China of “totally violating” the trade deal with the US.
Markets didn’t take it well. US indices dipped, USD/JPY slid, and even the euro managed to push the dollar back a touch.
As well as well as trade uncertainty eyes will turn to incoming US data next week, among them the monthly jobs report on Friday.
The US jobs report is always important as it could impact the Fed’s future policy decisions. Traders will want to see whether the trade war uncertainty is negatively impacting the jobs market too, after several macro data, including consumption data in GDP report and consumer sentiment surveys, have come out weaker in recent weeks. JOLTS jobs data and ISM PMIs are also due out earlier in the week.
The US dollar has been under pressure in the last three months or so, with the euro performing admirably during this time despite US tariffs.
With the US recently losing its final top-tier credit rating at the hands of Moody’s a couple of weeks ago, investors are worried that debt concerns and government spending will push yields even higher and thus they are shorting Treasuries and the dollar, buying foreign currencies, including the euro. This makes the EUR/USD outlook remain fairly resilient around the 1.12-1.15 range.
By Fawad Razaqzada, market analyst with FOREX.com
