USD/JPY H1 | Bearish downtrend to extend deeper?USD/JPY is rising towards a pullback resistance and could potentially reverse off this level to drop lower.
Sell entry is at 144.10 which is a pullback resistance that aligns with the 23.6% Fibonacci retracement.
Stop loss is at 144.80 which is a level that sits above the 61.8% Fibonacci retracement and an overlap resistance.
Take profit is at 143.37 which is a pullback support.
High Risk Investment Warning
Trading Forex/CFDs on margin carries a high level of risk and may not be suitable for all investors. Leverage can work against you.
Stratos Markets Limited (tradu.com ):
CFDs are complex instruments and come with a high risk of losing money rapidly due to leverage. 63% of retail investor accounts lose money when trading CFDs with this provider. You should consider whether you understand how CFDs work and whether you can afford to take the high risk of losing your money.
Stratos Europe Ltd (tradu.com ):
CFDs are complex instruments and come with a high risk of losing money rapidly due to leverage. 63% of retail investor accounts lose money when trading CFDs with this provider. You should consider whether you understand how CFDs work and whether you can afford to take the high risk of losing your money.
Stratos Global LLC (tradu.com ):
Losses can exceed deposits.
Please be advised that the information presented on TradingView is provided to Tradu (‘Company’, ‘we’) by a third-party provider (‘TFA Global Pte Ltd’). Please be reminded that you are solely responsible for the trading decisions on your account. There is a very high degree of risk involved in trading. Any information and/or content is intended entirely for research, educational and informational purposes only and does not constitute investment or consultation advice or investment strategy. The information is not tailored to the investment needs of any specific person and therefore does not involve a consideration of any of the investment objectives, financial situation or needs of any viewer that may receive it. Kindly also note that past performance is not a reliable indicator of future results. Actual results may differ materially from those anticipated in forward-looking or past performance statements. We assume no liability as to the accuracy or completeness of any of the information and/or content provided herein and the Company cannot be held responsible for any omission, mistake nor for any loss or damage including without limitation to any loss of profit which may arise from reliance on any information supplied by TFA Global Pte Ltd.
The speaker(s) is neither an employee, agent nor representative of Tradu and is therefore acting independently. The opinions given are their own, constitute general market commentary, and do not constitute the opinion or advice of Tradu or any form of personal or investment advice. Tradu neither endorses nor guarantees offerings of third-party speakers, nor is Tradu responsible for the content, veracity or opinions of third-party speakers, presenters or participants.
JPYUSD trade ideas

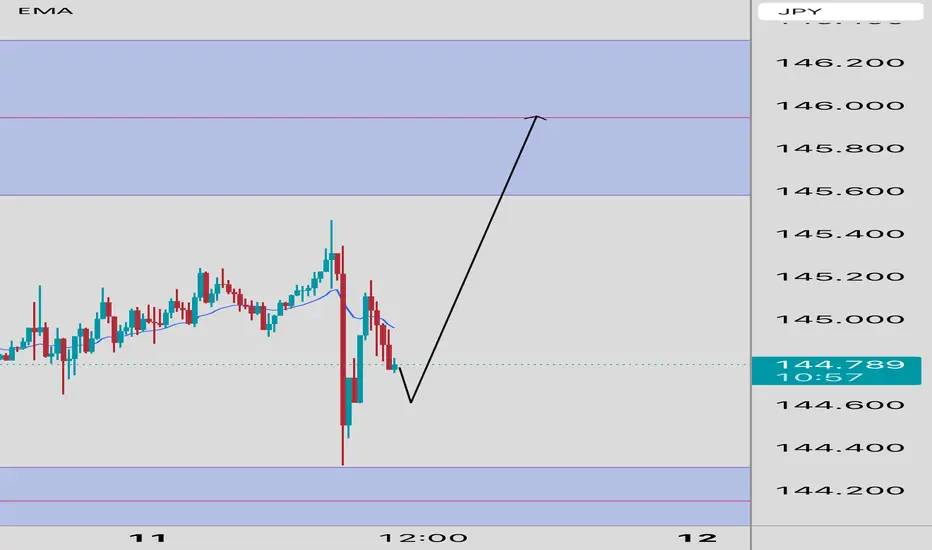
BUY USDJPYUSDJPY should continue the journey up from this demand area. We saw price quickly escalate beginning of this month, yesterday, we sent out a sell setup you can refer to, it has hit tp and now it is time to move up again. The double bottom is confirms the possible bullish continuation.
Bullish Hourly double bottom CoChCOCH just whispered — that uply move isn’t just flexin’. We flipped the tone, and now it’s dancing its way up, snatching those inefficiencies clean. No cap, it's heading to hourly supplies like it owes them money. Just sit back and let it fill up that imbalance buffet. Only real ones see it before the chart admits it. I set also a pendin order as i enter 0.5% and anoter 0.5% below to reinforce.

UJ Finally Showing Bearish Momentum After 2 Weeks of Patience
After nearly two weeks of waiting and watching price consolidate around key levels, bearish movement is finally emerging.
Structure suggests that this downtrend could continue into the end of the week. Staying disciplined pays off — now let’s see if price continues respecting the setup.

usd/jpytrade 1 continue the trade on the bearish and wait for new levels to be hit as u can see its already in the green from our last trade so we really just conituing the move

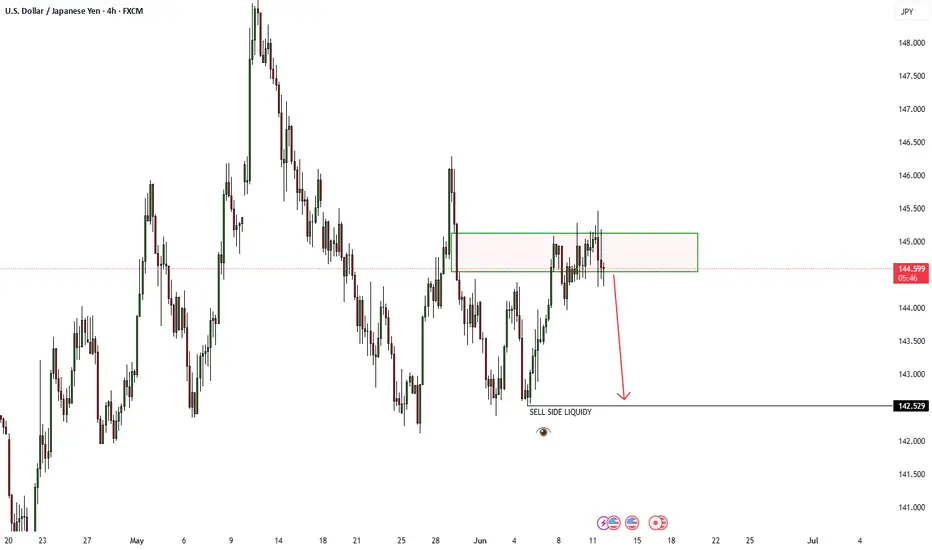
USDJPY 11/06/2025 - Sell side liquidity on 4HRUSDJPY 11/06/2025 - Sell side liquidity on 4HR
Price stuck in bearish 4HR FVG, potential downtrend towards sell side liquidity marked.
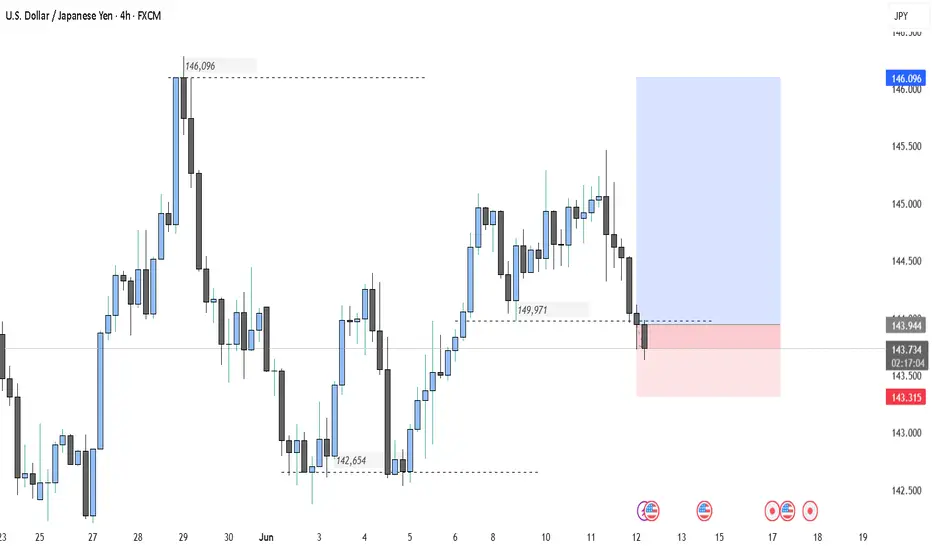
Potential bearish drop?USD/JPY has reacted off the resistance level which is a pullback resistance and could drop from this level to our take profit.
Entry: 144.74
Why we like it:
There is a pullback resistance level.
Stop loss: 145.46
Why we like it:
There is a pullback resistance level.
Take profit: 143.94
Why we like it:
There is an overlap support level that lines up with the 50% Fibonacci retracement.
Enjoying your TradingView experience? Review us!
Please be advised that the information presented on TradingView is provided to Vantage (‘Vantage Global Limited’, ‘we’) by a third-party provider (‘Everest Fortune Group’). Please be reminded that you are solely responsible for the trading decisions on your account. There is a very high degree of risk involved in trading. Any information and/or content is intended entirely for research, educational and informational purposes only and does not constitute investment or consultation advice or investment strategy. The information is not tailored to the investment needs of any specific person and therefore does not involve a consideration of any of the investment objectives, financial situation or needs of any viewer that may receive it. Kindly also note that past performance is not a reliable indicator of future results. Actual results may differ materially from those anticipated in forward-looking or past performance statements. We assume no liability as to the accuracy or completeness of any of the information and/or content provided herein and the Company cannot be held responsible for any omission, mistake nor for any loss or damage including without limitation to any loss of profit which may arise from reliance on any information supplied by Everest Fortune Group.

USD/JPY – Short-term bullish structure within a larger downtrendThe USD/JPY pair has been in a well-established downtrend on the daily timeframe, showing consistent weakness over recent weeks.
Daily timeframe
The pair recently bounced from a significant and well-respected support zone around the $140.00 level. This area has historically provided a strong base for price, and once again, it appears to be holding as reliable support. Although the overall daily trend remains bearish, this bounce introduces the potential for a short-term retracement or consolidation phase.
Clear Rising Trendline on the 4H Chart
Zooming into the 4-hour timeframe, the price action shows a notable shift in momentum. A clear rising trendline has formed, acting as a dynamic support level and guiding the pair higher in the short term. As long as this trendline remains intact and unbroken, the bullish bias on the 4H remains valid. This upward move suggests a corrective phase within the broader daily downtrend, supported by increasing demand at higher lows.
Approaching Key Resistance — FVG and 0.786 Fibonacci Level
The pair is currently approaching a key resistance area near the $145.50 level. This zone aligns with the 4-hour Fair Value Gap (FVG) left by the previous strong downward move and coincides with the 0.786 Fibonacci retracement level, measured from the most recent swing high to swing low. A few days ago, price action briefly tested the lower boundary of this FVG but failed to fully fill the imbalance. Given the current momentum, another attempt to fill the entire FVG and test the 0.786 Fibonacci level is likely. This confluence of technical factors creates a strong resistance zone that could trigger significant price reactions, potentially resuming the broader downtrend.
Target Levels — Where to Look for Reversal or Profit-Taking
A sensible short-term target would be the previous lower high around the $144.00 level. This zone may serve as an initial resistance or take-profit area before price challenges the $145.50 resistance region. Additionally, if the pair breaks below the rising trendline on the 4H, this $144.00 zone could become a support level from which the pair might attempt another move higher.
Conclusion
To summarize, the USD/JPY pair remains in a broader daily downtrend but has shown signs of short-term strength after bouncing from the $140.00 support zone. On the 4-hour timeframe, bullish momentum is evident, supported by a rising trendline and upward movement toward a significant resistance area. Traders should closely watch the $145.50 zone, as it represents a confluence of the FVG and 0.786 Fibonacci retracement — both of which could act as a strong ceiling for price. Until the rising trendline breaks, the short-term outlook remains cautiously bullish, but the medium-term bias leans bearish if resistance holds and selling pressure resumes.
Disclosure: I am part of Trade Nation's Influencer program and receive a monthly fee for using their TradingView charts in my analysis.
Thanks for your support.
- Make sure to follow me so you don't miss out on the next analysis!
- Drop a like and leave a comment!


Bullish usdjpyAfter being rejected at the 144.3 it’s mostly like price will try and retest 146.00 to have a clear direction
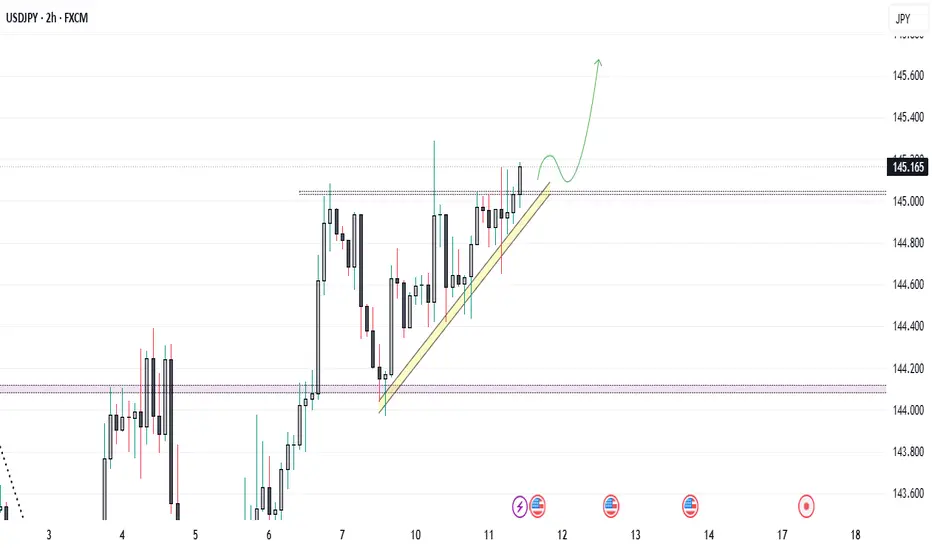
USD/JPY Gearing Up for Breakout ? Watch 145.20...USD/JPY Technical Setup – Bullish Continuation in Play?
USD/JPY is currently respecting a short-term ascending trendline, indicating sustained buying interest. The price consolidates just below a key resistance zone around 145.20, suggesting a potential breakout setup.
🔍 Key Technical Highlights:
* 📈 Trendline Support: Price has consistently respected this ascending trendline, forming higher lows—a strong bullish signal.
* 🔲 Resistance Zone: The 145.15–145.20 level has acted as a rejection zone previously. A breakout above this could invite momentum buying.
* 🕐 Consolidation Range: The market is coiling tightly just below resistance—watch for a volatility expansion.
* 🔮 Projection : If the price holds above the trendline and breaks 145.20 convincingly, we could see a bullish move towards 145.60+.
⚠️ Invalidation: A clean break below the trendline and 144.80 could shift the short-term bias back to neutral or bearish.
Sell attempt on USDJPY ahead of the news.We're going for a sell attempt ahead of the news on USDJPY.
Our idea is that we sell at market with a stop loss at 146.14.
That will give us a risk to reward of 1 to 1.7 (not that great). But we will calculate our position (1% risk) based on these levels.
After the news volatility has ended entirely we will then put our stop back to where it would normally be, above the high of the last 1hr green candle, after which our risk to reward will then turn into something around 1 to 5!

USDJPY Technical & Order Flow AnalysisOur analysis is based on a multi-timeframe top-down approach and fundamental analysis.
Based on our assessment, the price is expected to return to the monthly level.
DISCLAIMER: This analysis may change at any time without notice and is solely intended to assist traders in making independent investment decisions. Please note that this is a prediction, and I have no obligation to act on it, nor should you.
Please support our analysis with a boost or comment!

USDJPY Downside continuation below 145.85The USDJPY currency pair is displaying a bearish sentiment, consistent with the broader downward trend. Price action is currently in a sideways consolidation phase, suggesting indecision as the market pauses before a potential directional move.
Key Resistance Level: 145.85 — This level represents a prior intraday consolidation zone and serves as a key pivot for the next move.
Support Targets: If the pair rallies toward 145.85 and is rejected, expect renewed bearish momentum targeting:
143.00 (initial support)
142.25 (intermediate support)
141.40 (long-term support level)
On the other hand, a confirmed breakout and daily close above 145.85 would invalidate the bearish outlook and suggest growing bullish momentum. In that scenario, price could aim for:
146.85 (near-term resistance)
147.60 (extended upside target)
Conclusion:
USDJPY remains technically bearish within a consolidation pattern. A rejection from the 145.85 resistance zone would confirm a continuation toward lower support levels. However, a daily close above 145.85 would shift sentiment to bullish, potentially triggering a retest of higher resistance levels. Traders should closely monitor the price reaction around the 145.85 level to confirm direction.
This communication is for informational purposes only and should not be viewed as any form of recommendation as to a particular course of action or as investment advice. It is not intended as an offer or solicitation for the purchase or sale of any financial instrument or as an official confirmation of any transaction. Opinions, estimates and assumptions expressed herein are made as of the date of this communication and are subject to change without notice. This communication has been prepared based upon information, including market prices, data and other information, believed to be reliable; however, Trade Nation does not warrant its completeness or accuracy. All market prices and market data contained in or attached to this communication are indicative and subject to change without notice.

USDJPY | Bullish Continuation Above 144.93, Eyes on 146.33USDJPY |
The price is trading around 145.33, and has already broken and stabilized above the pivot line at 144.93, which indicates a potential bullish continuation.
As long as it holds above this pivot, the pair may continue to push higher toward the resistance zone at 146.33, and if broken, could extend to 147.82.
However, short-term retracement to test the pivot area again is possible before resuming the bullish trend.
Pivot: 144.93
Support: 144.50 – 144.26 – 143.84
Resistance: 146.33 – 147.82 – 149.92

USDJPY: Short Trade with Entry/SL/TP
USDJPY
- Classic bearish setup
- Our team expects bearish continuation
SUGGESTED TRADE:
Swing Trade
Short USDJPY
Entry Point - 145.34
Stop Loss - 146.15
Take Profit - 144.07
Our Risk - 1%
Start protection of your profits from lower levels
Disclosure: I am part of Trade Nation's Influencer program and receive a monthly fee for using their TradingView charts in my analysis.
❤️ Please, support our work with like & comment! ❤️


USDJPY - Shorts📉 How This Sell Setup Could Have Been Traded – USDJPY, 15min
This is a great example of how the ELFIEDT RSI + 3SD Reversion Strategy can help identify short-term exhaustion and provide a clean sell opportunity.
🔻 What Happened in This Example:
Double Sell Signal Fired
Two "DOWN" signals printed at the top of the move, indicating that price had pushed significantly beyond its upper volatility band, with RSI showing an overbought condition and volume confirming the move.
Price Exhaustion Candle
The second signal came after a strong wick rejection (long upper wick), suggesting buyers were losing control. This type of candle acts as a reversal clue — especially powerful when backed by the indicator.
Momentum Shift in RSI
Shortly after the signal, RSI began rolling over and crossed below its smoothing average, confirming that the upward momentum was fading.
Sharp Reversal
Price quickly sold off after the signal cluster, offering a clean short with minimal drawdown and solid follow-through.
✅ How You Could Have Traded It:
📌 Wait for the “DOWN” signal(s) to print, signaling a statistically overbought zone.
📉 Look for a reversal-style candle near the signal — like a bearish engulfing or long upper wick (as seen here).
🔎 Confirm that RSI is starting to turn down from an extended zone.
🛑 Place a stop just above the signal wick and aim for a reward that aligns with the next support or a 1:2+ target.
🔁 Bonus Tip – Multi-Timeframe Filter:
If the same signal zone shows up on a higher timeframe (like the 1H), this becomes a high-conviction sell setup. Look for alignment across 15min and 1H for best results.
This setup shows how the ELFIEDT strategy blends data-driven exhaustion signals with visual price action for clean intraday reversals.

Current USD/JPY Trend Analysis and Trading RecommendationsOn Wednesday, the USD/JPY attracted buyers for the second consecutive day, trading near 145.20 in the early European session, close to a two-week high. Japan's May CGPI rose 3.2% YoY, the slowest pace since September last year, potentially easing BOJ rate hike pressure and weakening the JPY. Additionally, optimism over a framework agreement in U.S.-China trade talks dented the JPY's safe-haven appeal. Technically, the price holds above the 200-period SMA on the 4-hour chart and breaches the 145.00 psychological level, with oscillators tilting bullish. A valid break above 145.30 (Tuesday's high) would confirm the bullish setup, targeting the 146.00 integer mark and 146.25-146.30 resistance zone.
USDJPY
buy@145.000-145.200
tp:145.600-146.000

USDJPY 1HThis chart illustrates a USD/JPY (U.S. Dollar / Japanese Yen) price action setup on the 1-hour timeframe with a potential bearish reversal pattern forming.
Key Observations:
1. Rising Wedge Pattern:
The price is moving within a narrowing range (highlighted by the two converging trendlines).
A series of higher highs and higher lows is visible, but momentum appears to be weakening.
2. Rejection at Resistance (Red Arrows):
Several attempts to break the upper resistance line failed.
Each red arrow indicates strong selling pressure at those peaks.
3. Support Zone (Green Arrows):
The lower trendline (acting as support) was tested multiple times and held—until now.
4. Breakdown Anticipated:
The orange path suggests a projected move downward if the wedge breaks.
The price has started to move below the wedge, signaling a possible breakdown.
5. Target TP (Take Profit):
Marked at around 143.600, based on the height of the wedge or past support zones.
This target aligns with prior swing lows, making it a reasonable objective.
---
Interpretation:
The chart anticipates a bearish reversal from the rising wedge pattern.
A short position might be considered on confirmation of the breakdown with stops above the last swing high (~145.200).
Traders are targeting a move to the 143.600 area.
Let me know if you want help analyzing this trade idea further or need other timeframes or indicators added.

Wednesday IdeaAll eyes seem to be on the US China talks so keep an eye on that.
Upcoming reports:
Today we have the core inflation year over year being produced. Estimated at 2.9 previously 2.8. This is an important indicator. This will give you an idea of purchasing power of a currency and potential direction of central bank policy.
The UDS/JPY currency pair is sensitive to inflation trends in both the US and Japan.
If we get a higher percentage, it typically results in a higher price for a list of reasons like bond yields risings, and anticipation of tighter monetary policy.
A lower rate indicates the Fed could pause or cut rates sooner this could result in reducation of appeal of USD denominated assets.
While these economic reports are important pay close attention to the US China talks which are going to have the most implications on price.
Targets:
Buy 145.321 (looking for a test of resistance around 145.988)
Sell 144.681 (look for retest around 144.725)
There's been a lot of consolidation around this area so be sure to lock in profits when you have them even a small gain is better than nothing.
I will be publishing my trading strategy that I've been coding for a while now it will be public so completely free. I hope it helps understand conditions of market for those who need help and offers opportunities to enter market at ideal times to reduce overtrading. It will be my first published strategy, and I am working on more.

Bullish continuation?USD/JPY has reacted off the pivot which aligns with the 38.2% Fibonacci retracement and could rise to the 1st resistance which is a pullback resistance.
Pivot: 144.27
1st Support: 142.64
1st Resistance: 146.15
Risk Warning:
Trading Forex and CFDs carries a high level of risk to your capital and you should only trade with money you can afford to lose. Trading Forex and CFDs may not be suitable for all investors, so please ensure that you fully understand the risks involved and seek independent advice if necessary.
Disclaimer:
The above opinions given constitute general market commentary, and do not constitute the opinion or advice of IC Markets or any form of personal or investment advice.
Any opinions, news, research, analyses, prices, other information, or links to third-party sites contained on this website are provided on an "as-is" basis, are intended only to be informative, is not an advice nor a recommendation, nor research, or a record of our trading prices, or an offer of, or solicitation for a transaction in any financial instrument and thus should not be treated as such. The information provided does not involve any specific investment objectives, financial situation and needs of any specific person who may receive it. Please be aware, that past performance is not a reliable indicator of future performance and/or results. Past Performance or Forward-looking scenarios based upon the reasonable beliefs of the third-party provider are not a guarantee of future performance. Actual results may differ materially from those anticipated in forward-looking or past performance statements. IC Markets makes no representation or warranty and assumes no liability as to the accuracy or completeness of the information provided, nor any loss arising from any investment based on a recommendation, forecast or any information supplied by any third-party.

