USDJPY TRADE SETUPH4 time frame base market is downtrend i hope this week continue to sell so let's see what happenned
JPYUSD trade ideas

USD/JPY BreakoutUSD/JPY has had a big week already and the pair has shown a decisive breakout through a massive spot of resistance on the chart.
Coming into the week the 148.00 zone had been problematic for bulls in the pair since early-Q2 trade. But with the combined force of FOMC and the Bank of Japan, bulls have finally been able to prod a breakout and leave that zone behind. And the move has continued to press, with a breach of the 150.00 psychological level and price is now approaching the Fibonacci level at 150.77.
Chasing is a challenge at this point but given that prior resistance there's now multiple spots to track for support potential on pullbacks. The 150.00 level is an obvious one, but there's also the 200-day moving average which currently plots around 149.55 and there's the prior high of 149.19. Even the Fibonacci level at 148.13 could be of interest for that in prolonged pullback scenarios, given how it had played as support on Wednesday ahead of the FOMC announcement. The key for that level would be prices holding a higher-low, illustrating a degree of bullish defense at that price. - js

USDJPY A Fall Expected! SELL!
My dear subscribers,
My technical analysis for USDJPY is below:
The price is coiling around a solid key level - 148.71
Bias - Bearish
Technical Indicators: Pivot Points Low anticipates a potential price reversal.
Super trend shows a clear sell, giving a perfect indicators' convergence.
Goal - 147.93
About Used Indicators:
By the very nature of the supertrend indicator, it offers firm support and resistance levels for traders to enter and exit trades. Additionally, it also provides signals for setting stop losses
Disclosure: I am part of Trade Nation's Influencer program and receive a monthly fee for using their TradingView charts in my analysis.
———————————
WISH YOU ALL LUCK

What we looking at heeeeeeeeeeere? My meaningful description is Im looking at this USDJPY pair and drawing magic lines, follow me for more meaningful insights.
TLDR possible long term down trend incoming, if confirmed, plentiful continuation shorts will be available to all.

USDJPY 30Min Engaged ( Buy & Sell Reversal Entry's Detected )————-
➕ Objective: Precision Volume Execution
Time Frame: 30-Minute Warfare
Entry Protocol: Only after volume-verified breakout
🩸 Bullish Reversal : 146.450
🩸 Bearish Reversal : 147.350
➗ Hanzo Protocol: Volume-Tiered Entry Authority
➕ Zone Activated: Dynamic market pressure detected.
The level isn’t just price — it’s a memory of where they moved size.
Volume is rising beneath the surface — not noise, but preparation.
🔥 Tactical Note:
We wait for the energy signature — when volume betrays intention.
The trap gets set. The weak follow. We execute.

USD-JPY Will Keep Growing! Buy!
Hello,Traders!
USD-JPY keep growing and
The pair made a bullish breakout
Of the key horizontal level
Of 149.181 and the pair is
Already retesting the new
Support and we will be
Expecting a further
Bullish move up
Sell!
Comment and subscribe to help us grow!
Check out other forecasts below too!
Disclosure: I am part of Trade Nation's Influencer program and receive a monthly fee for using their TradingView charts in my analysis.

USDJPY 60/15 Pullback LongOverall up trend. Yesterday session a 'b' market profile. Aways from POC. looking for up continuous. Now is in pullback, montior for long oppoturnity.
If break and stay below market shift, then no go.

USDJPY – Strap in For the Central Bank Rollercoaster The next 4 trading days could be crucially important for FX markets, with traders bracing for the outcomes of a variety of different events including several central bank meetings, economic data readings and trade deal/tariff negotiations. No currency pair within the majors is likely to feel the impact of these events more than USDJPY, given that both the Federal Reserve (Fed) and Band of Japan (BoJ) interest rate decisions take place within a 9-hour window late on Wednesday evening and early Thursday morning, UK time (Fed 1900 BST Wed, BoJ 0400 BST Thurs).
The first move in USDJPY at the start of this week has been higher. This was in response to the announcement of a trade deal between the EU/US, which sees tariffs of 15% on most EU goods imported into the US and has been taken as a success for President Trump and his trade team. (general USD positive). When coupled with the political uncertainty surrounding Japanese PM Ishiba, who is fighting to keep his job, (potential JPY negative) USDJPY has traded from opening levels at 147.51 on Monday up to a high of 148.71 earlier this morning in Asia.
Looking forward, both the Fed and BoJ are expected to keep interest rates unchanged. This could make what is said at the accompanying press conferences by Fed Chairman Powell (1930 BST Wed) and BoJ Governor Ueda (0730 BST Thurs) on the timing of their next respective interest rate moves potentially pivotal for the direction of USDJPY into the weekend.
Tier 1 US economic data may also be important, with the Fed’s preferred inflation gauge (PCE Index) due for release at 1330 BST on Thursday, and the next update on the current health of the US labour market due on Friday at 1330 BST in the form of Non-farm Payrolls. Sentiment may also be impacted on Friday by any headlines or social media posts from President Trump regarding trade deals and updates on whether he may extend or hold certain countries to his current deadline of August 1st.
Technical Update: Focus on Fibonacci Retracement Resistance at 149.40
On July 16th 2025, USDJPY traded to a price high of 149.19, nearing what might have been considered a resistance level by traders at 149.40. This level is equal to the 50% Fibonacci retracement of the price weakness seen from 158.88 on January 10th down to 139.88, the April 22nd low. Having been capped by this resistance level, a setback in price developed last week.
However, this phase of price weakness encountered buying support around the Bollinger mid-average, currently at 146.98, from which fresh attempts at price strength have emerged. As a result, it might be argued that this type of price action is more constructive in nature, especially as since the April 22nd low was posted a pattern of higher price lows and higher price highs has so far materialised, as the chart above shows.
That said, with potential for a sustained period of USDJPY volatility in the week ahead let’s consider what may be the important support and resistance levels that could influence the direction of prices moving forward.
Potential Resistance Levels:
Having previously capped price strength, the 149.40 retracement level may prove to be successful in doing so again, meaning closing breaks above 149.40 might now be required to suggest a further period of price strength.
As the chart above shows, if successful breaks above 149.40 do materialise, potential may then turn towards tests of the next resistance at 151.21, the March 28th session high, even 151.65, the higher 61.8% Fibonacci resistance level.
Potential Support Levels:
Having seen it offer support to recent price declines, traders may still be focusing on the 146.98 Bollinger mid-average as an important level that if broken on a closing basis, might lead to a further phase of price weakness.
Closing breaks under the 146.98 support while not a guarantee of further declines, could suggest potential to test 145.85, the July 24th session low and rally point, even towards 142.68, the July 1st low.
The material provided here has not been prepared accordance with legal requirements designed to promote the independence of investment research and as such is considered to be a marketing communication. Whilst it is not subject to any prohibition on dealing ahead of the dissemination of investment research, we will not seek to take any advantage before providing it to our clients.
Pepperstone doesn’t represent that the material provided here is accurate, current or complete, and therefore shouldn’t be relied upon as such. The information, whether from a third party or not, isn’t to be considered as a recommendation; or an offer to buy or sell; or the solicitation of an offer to buy or sell any security, financial product or instrument; or to participate in any particular trading strategy. It does not take into account readers’ financial situation or investment objectives. We advise any readers of this content to seek their own advice. Without the approval of Pepperstone, reproduction or redistribution of this information isn’t permitted.

Beginner MistakeI was expecting a push to the downside but i got stopped out big time. I am publishing this trade to look back at it when i am profitable.
USDJPY InsightHello to all our subscribers.
Please feel free to share your personal thoughts in the comments. Don’t forget to hit the boost and subscribe buttons!
Key Points
- Prime Minister Shigeru Ishiba reaffirmed during a party meeting held at the LDP headquarters that he has no intention of resigning, stating, "I will do my utmost to ensure there is no political vacuum for the nation and the people."
- Following the U.S.-EU trade agreement, concerns have arisen that it could negatively impact the EU economy, with negative sentiment spreading across Europe.
- On July 28, the third high-level meeting between the U.S. and China began in Stockholm, Sweden. The market widely expects the current “tariff truce” to be extended by another 90 days.
Major Economic Events This Week
+ July 29: U.S. Department of Labor – JOLTS
+ July 30: Germany Q2 GDP, U.S. July ADP Nonfarm Employment Change, U.S. Q2 GDP, Bank of Canada rate decision, FOMC meeting results
+ July 31: Bank of Japan rate decision, Germany July CPI, U.S. June PCE Price Index
+ August 1: Eurozone July CPI, U.S. July Nonfarm Payrolls, U.S. July Unemployment Rate
USDJPY Chart Analysis
After facing resistance near the 149 level, USD/JPY pulled back but found support around 146, and is now climbing again toward 149. In the long term, a rise toward 151 seems possible. Two potential scenarios are in play:
- The pair hits resistance again at 149, finds support at 146, and then moves up toward 151.
- The pair maintains its current upward momentum and continues climbing directly to 151.
We will determine our strategy based on the price action near the 149 level.

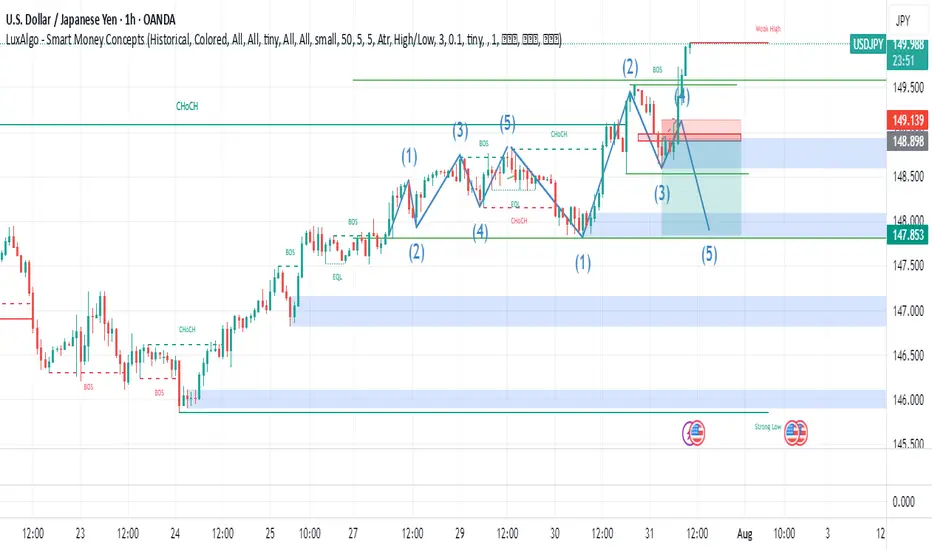
USDJPY - 30/7/25 - BoS to a bearish pull backI dont normally trade USDJPY but i see a setup based on my strategy. The price was climbing to take out a previous high on the 4H and Daily TF. But on the hourly there is a clear BoS which suggests that there may be a pull back even though the HTF bias is still bullish.
+ve:
1. there is a BoS on the 1 hour chart
2. Equal low liquidity just below which will draw price to this zone
3. Big imbalance below the equal low liquidity
-ve:
1. Fed news today may push the market against my trade idea

USD/JPY Chart Analysis (Educational Breakdown)📊USD/JPY Chart Analysis (Educational Breakdown)
🗓 Date: July 28, 2025
⏰ Timeframe: 2H (2-Hour Candles)
🧠 Concepts: Liquidity | Fair Value Gap | Order Block | Structure | Support/Resistance
⸻
1. Market Structure Overview
• The pair has been bullish, making higher highs and higher lows.
• Recently, price tapped into a resistance zone (~148.40–149.00) and sharply rejected, suggesting a potential short-term reversal.
• The price may now aim to sweep liquidity below support before a possible rebound.
⸻
2. Key Levels
🟥 Resistance Zone (148.50–149.00)
• Marked by a previous supply zone where sellers stepped in aggressively.
• Current Bearish Order Block sits just below this resistance, confirming institutional interest in selling this level.
🟫 Bearish Order Block
• Last bullish candle before sharp drop acts as a bearish order block (around 148.30–148.50).
• This is a high-probability sell-side reaction area — ideal for liquidity grabs and reversals.
🟦 Fair Value Gap (FVG)
• Between mid-17th–18th July, an imbalance was left after strong bullish momentum.
• Price returned to this zone, partially filled the gap, and then dropped again — confirming its importance.
🟥 Support Zone (145.80–146.30)
• Long-standing demand area where buyers previously stepped in.
• This area aligns closely with sell-side liquidity (SSL).
⸻
3. Liquidity Zones
🔵 Buy-Side Liquidity (BSL) – Above resistance (149.00+)
• Stop-loss clusters above previous swing highs.
• Liquidity for institutional sell positions.
🟣 Sell-Side Liquidity (SSL) – Below 146.00
• Positioned right under support.
• Ideal liquidity target for smart money to trigger stop hunts and fill positions before reversing.

Bearish reversal off swing high resistance?USD/JPY is rising towards the pivot, which acts as a swing high resistance and could reverse to the pullback support.
Pivot: 149.20
1st Support: 146.36
1st Resistance: 151.18
Risk Warning:
Trading Forex and CFDs carries a high level of risk to your capital and you should only trade with money you can afford to lose. Trading Forex and CFDs may not be suitable for all investors, so please ensure that you fully understand the risks involved and seek independent advice if necessary.
Disclaimer:
The above opinions given constitute general market commentary, and do not constitute the opinion or advice of IC Markets or any form of personal or investment advice.
Any opinions, news, research, analyses, prices, other information, or links to third-party sites contained on this website are provided on an "as-is" basis, are intended only to be informative, is not an advice nor a recommendation, nor research, or a record of our trading prices, or an offer of, or solicitation for a transaction in any financial instrument and thus should not be treated as such. The information provided does not involve any specific investment objectives, financial situation and needs of any specific person who may receive it. Please be aware, that past performance is not a reliable indicator of future performance and/or results. Past Performance or Forward-looking scenarios based upon the reasonable beliefs of the third-party provider are not a guarantee of future performance. Actual results may differ materially from those anticipated in forward-looking or past performance statements. IC Markets makes no representation or warranty and assumes no liability as to the accuracy or completeness of the information provided, nor any loss arising from any investment based on a recommendation, forecast or any information supplied by any third-party.

USD/JPY Bearish Setup - Breakout from Ascending ChannelUSD/JPY Bearish Setup – Breakout from Ascending Channel
Price action on USD/JPY has broken down from an ascending channel, signaling potential bearish momentum ahead. The breakdown suggests a possible continuation toward lower support levels.
1st Support Level: 144.800 – 144.200
2nd Support Level: 143.000 – 142.400
Watch for price consolidation or retests at the 1st support level. A clean break below this zone could open the path toward the 2nd support level.
Key Notes:
Bearish volume increase post-breakout
Ichimoku cloud starting to thin, showing weakening bullish momentum
Structure favors selling rallies below the channel
📉 Bias: Bearish
💡 Plan: Wait for confirmation on lower timeframes before entering short positions

USDJPY: Market of Sellers
It is essential that we apply multitimeframe technical analysis and there is no better example of why that is the case than the current USDJPY chart which, if analyzed properly, clearly points in the downward direction.
Disclosure: I am part of Trade Nation's Influencer program and receive a monthly fee for using their TradingView charts in my analysis.
❤️ Please, support our work with like & comment! ❤️

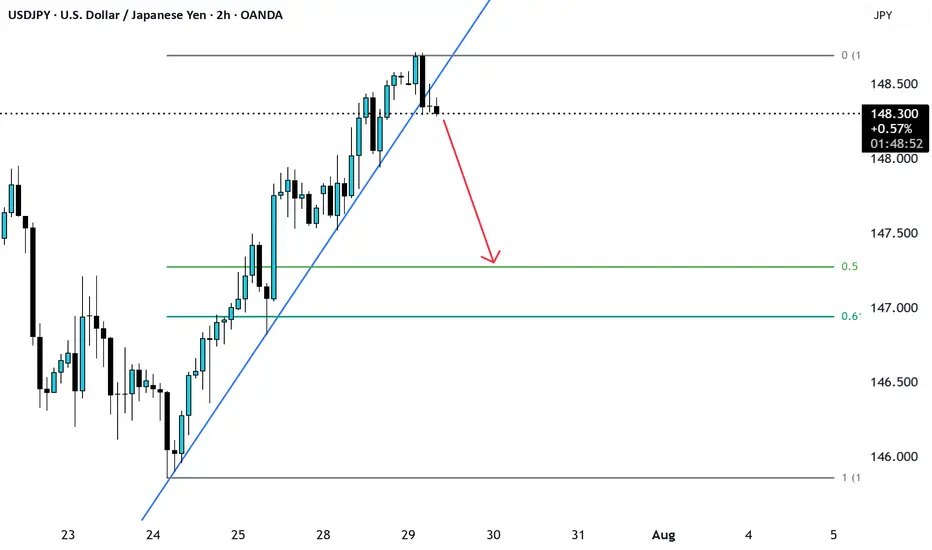
USDJPY broke the trendline support likely to go fib 0.5 levelUSDJPY was trading in uptrend and recently has broken the Support and is likely to have a correction till the fib 0.5 level.
USDJPY Cooking Something – Here's Where I’ll BiteTHE BATTLE OF MY BLUE LINES 📉
The big picture of USDJPY is BUY possible up to 149.35.
I see H1 send me love note to BUY (range) but 15m reject it by forming SELL range.
Conflict? No! This means there is temporary reversal (BEARISH).
Two top BLUE LINES (147.75/85) are where I can SELL my love story. I will first wait H4 to Kiss either of the line. Since 15m SELL range already formed, I ’ll jump in like a love-struck fool (AGGRESSIVE).
TP: Middle BLUE LINE (147.21) = Dating spot for Buyers.
Middle BLUE LINES (147.21, 147.00)
If H4 price come and KISS (touches and leave wick) in either of these, I’m rushing to 15m to catch that BUY breakout.
If H4 price come and CUDDLE (close by body),I’ll cozy up to SELL (after confirmation) and ride it all the way down to 146.42, the Bottom BLUE LINE. 📉
In Bottom BLUE LINE (146.42) = Buyers Chilling Zone
If H4 price come and KISS (touches and leave wick), I’m rushing down to 15m to catch that BUY breakout — love at first touch!
If H4 price come and CUDDLE (close by body), my trading heartbreak season will start!
WISH ME LUCK.!!!

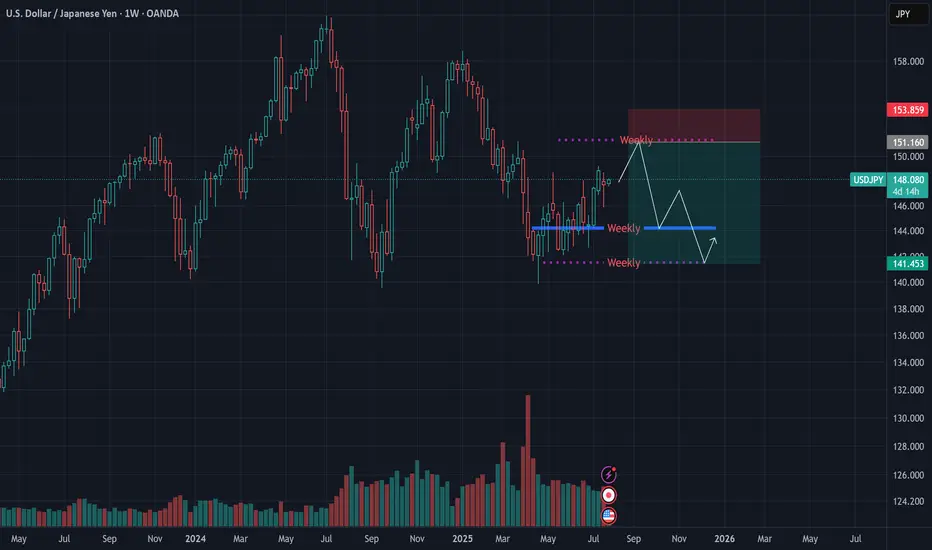
USDJPY Macro Analysis – July 27, 2025We’ve been tracking the yen for months and, since the beginning of the year, have signaled a potential appreciation in its value, largely based on the Bank of Japan’s policy stance.
📉 However, recent price action — particularly the return to prior levels — revealed a shift in Japan’s macroeconomic direction.
🇯🇵 Last week, we saw the first formal confirmations, with Japan making its largest-ever investment in the U.S.
This suggests a new approach to currency valuation, and we may now witness another phase of yen weakness.
🌀 That said, the market remains uncertain and indecisive, so it’s wise to hold off on major long-term entries until further confirmation.
🎯 A tactical entry around the 150 level could be reasonable in the meantime, as we wait for clearer signals.
USDJPY | H4 Bullish bounce offBased on the H4 chart analysis, the price is falling towards the buy entry, which is an overlap support that aligns with the 61.8% Fibonacci retracement and could bounce from this level and rise higher.
Buy entry is at 147.08, which is an overlap support that lines up with the 61.8% Fibonacci retracement.
Stop loss is at 145.82, which is a multi-swing low support.
Take profit is at 148.72, which is pullback resistance.
High Risk Investment Warning
Trading Forex/CFDs on margin carries a high level of risk and may not be suitable for all investors. Leverage can work against you.
Stratos Markets Limited (tradu.com ):
CFDs are complex instruments and come with a high risk of losing money rapidly due to leverage. 65% of retail investor accounts lose money when trading CFDs with this provider. You should consider whether you understand how CFDs work and whether you can afford to take the high risk of losing your money.
Stratos Europe Ltd (tradu.com):
CFDs are complex instruments and come with a high risk of losing money rapidly due to leverage. 66% of retail investor accounts lose money when trading CFDs with this provider. You should consider whether you understand how CFDs work and whether you can afford to take the high risk of losing your money.
Stratos Global LLC (tradu.com ):
Losses can exceed deposits.
Please be advised that the information presented on TradingView is provided to Tradu (‘Company’, ‘we’) by a third-party provider (‘TFA Global Pte Ltd’). Please be reminded that you are solely responsible for the trading decisions on your account. There is a very high degree of risk involved in trading. Any information and/or content is intended entirely for research, educational and informational purposes only and does not constitute investment or consultation advice or investment strategy. The information is not tailored to the investment needs of any specific person and therefore does not involve a consideration of any of the investment objectives, financial situation or needs of any viewer that may receive it. Kindly also note that past performance is not a reliable indicator of future results. Actual results may differ materially from those anticipated in forward-looking or past performance statements. We assume no liability as to the accuracy or completeness of any of the information and/or content provided herein and the Company cannot be held responsible for any omission, mistake nor for any loss or damage including without limitation to any loss of profit which may arise from reliance on any information supplied by TFA Global Pte Ltd.
The speaker(s) is neither an employee, agent nor representative of Tradu and is therefore acting independently. The opinions given are their own, constitute general market commentary, and do not constitute the opinion or advice of Tradu or any form of personal or investment advice. Tradu neither endorses nor guarantees offerings of third-party speakers, nor is Tradu responsible for the content, veracity or opinions of third-party speakers, presenters or participants.

USDJPY– DAILY FORECAST Q3 | W31 | D28 | Y25📊 USDJPY– DAILY FORECAST
Q3 | W31 | D28 | Y25
Daily Forecast 🔍📅
Here’s a short diagnosis of the current chart setup 🧠📈
Higher time frame order blocks have been identified — these are our patient points of interest 🎯🧭.
It’s crucial to wait for a confirmed break of structure 🧱✅ before forming a directional bias.
This keeps us disciplined and aligned with what price action is truly telling us.
📈 Risk Management Protocols
🔑 Core principles:
Max 1% risk per trade
Only execute at pre-identified levels
Use alerts, not emotion
Stick to your RR plan — minimum 1:2
🧠 You’re not paid for how many trades you take, you’re paid for how well you manage risk.
🧠 Weekly FRGNT Insight
"Trade what the market gives, not what your ego wants."
Stay mechanical. Stay focused. Let the probabilities work.
FX:USDJPY

USD/JPY Technical Analysis - 4h Chart (Jul 24, 2025)
Key Observations:
Price Action (4h Close):
Open (O): 146.545
High (H): 146.660
Low (L): 146.448
Close (C): 146.473
Change: -0.036 (-0.028%) → Slight bearish momentum.
50% - Order Block:
Indicates a key retracement level where institutional traders may have placed orders.
Current price near 146.473 suggests potential consolidation or reversal if this level holds.
Profit Levels (Potential Targets):
Bullish Scenario (if USD strengthens):
147.170 → Minor resistance
147.956 → Stronger resistance
148.637 & 150.140 → Major upside targets
Bearish Scenario (if JPY strengthens):
146.450 → Immediate support
145.780 → Next key support
Context:
August Seasonal Trend: JPY often sees volatility in August due to fiscal flows and BoJ policy expectations.
Trading View Indicator: Likely referencing a custom strategy (e.g., breakout/mean reversion).
Trading Bias:
Neutral to Slightly Bearish (price closed below open, testing mid-range levels).
Watch 146.450 (support) and 147.170 (resistance) for breakout confirmation.
Key Levels:
Resistance Support
147.170 146.450
147.956 145.780
148.637
Actionable Idea:
A break below 146.450 could target 145.780.
A rebound above 147.170 opens path to 147.956.

usdjpy
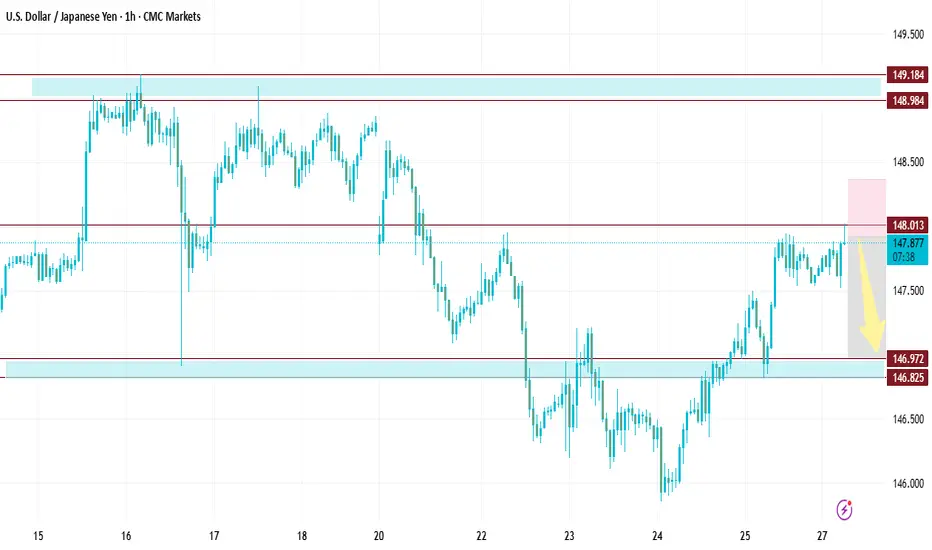
📌 Trade Idea: Sell USDJPY (U.S. Dollar / Japanese Yen)
Current Market Action: Based on recent technical analysis and price behavior, a selling opportunity in USDJPY has been identified.
Entry Zone: 147.90 – This is the ideal level where traders can initiate a sell position. It aligns with recent price rejection levels and shows early signs of bearish momentum.
Stop Loss (SL): 148.50 – A well-placed stop just above a key resistance zone ensures risk is controlled if price reverses against the trade idea.
Take Profit (TP) Levels:
🎯 TP1: 147.490 – This level offers a quick short-term target and serves as the first point for partial profit booking.
🎯 TP2: 147.190 – A mid-range target based on previous support zones, allowing for a stronger reward.
🎯 TP3: 147.000 – Final take-profit level, representing a significant move within the prevailing downtrend structure.
USDJPY Is Very Bearish! Sell!
Here is our detailed technical review for USDJPY.
Time Frame: 9h
Current Trend: Bearish
Sentiment: Overbought (based on 7-period RSI)
Forecast: Bearish
The market is on a crucial zone of supply 150.492.
The above-mentioned technicals clearly indicate the dominance of sellers on the market. I recommend shorting the instrument, aiming at 148.583 level.
P.S
We determine oversold/overbought condition with RSI indicator.
When it drops below 30 - the market is considered to be oversold.
When it bounces above 70 - the market is considered to be overbought.
Disclosure: I am part of Trade Nation's Influencer program and receive a monthly fee for using their TradingView charts in my analysis.
Like and subscribe and comment my ideas if you enjoy them!
