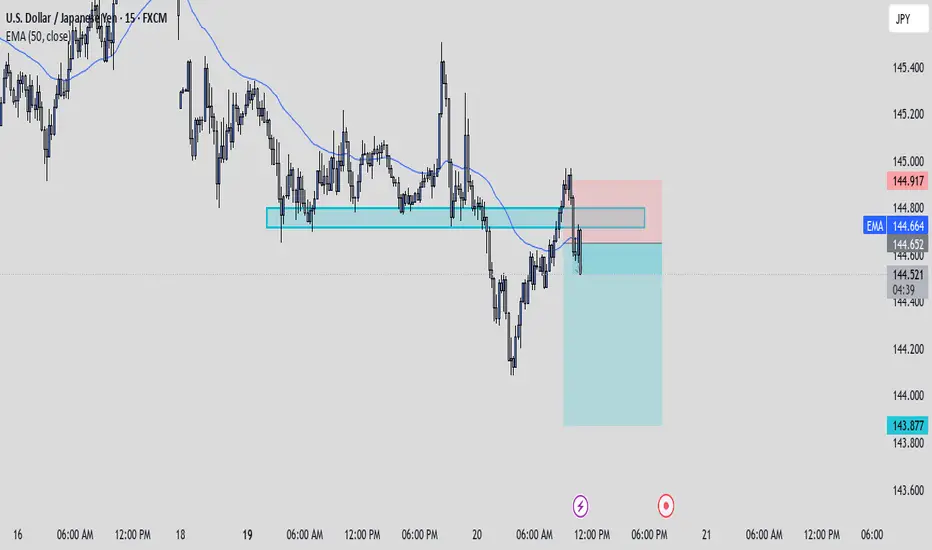
LONG USDJPYUSDJPY is creating the corrective move.
The price is droping to the strong demand zone.
The previous move was of spikes, indicating the strong bullish dominance.
We wait until it reaches the zone, and decide on what will be revealed by the price
JPYUSD trade ideas

UsdJpy Trade UpdateI published a short idea on UJ stating price being overall bearish on all time frames. I personally wanted to see price retest the level of support as resistance to confirm the bearish continuation. Price did just that and entries were taken with a 1:3rr target. Stops are just above structure. We'll see what happens.
USDJPY expectation 1H - UPDATEStill looking good for a bull, with the strongest confimation being the fib, its still in the reversal to bull movement. Have to wait for market to correct itself, while it plays around the 61% fib zone.

USDJPYDXY (US Dollar Index) and Bond Yield Relationship – May 2025
Current Market Situation
US Treasury Yields:
The 10-year Treasury yield is at 4.54% (May 21, 2025), and the 30-year yield is testing the 5% level amid a global bond sell-off.
DXY (US Dollar Index):
The DXY and the 10-year yield are moving in sync again after a period of divergence earlier in 2025.
Relationship Dynamics
Positive Correlation:
Historically, the DXY and US bond yields (especially the 10-year yield) tend to move together. When yields rise, the dollar often strengthens, as higher yields attract foreign capital seeking better returns.
In recent weeks, this positive correlation has resumed after a brief disconnect in April, when yields surged but the dollar weakened due to shifting investor sentiment and US tariff policy.
Periods of Divergence:
In early April 2025, there was a notable divergence: yields climbed while the dollar fell, reflecting a rare episode where investors were wary of US assets despite higher returns, possibly due to concerns about US fiscal health and global trade tensions.
During that period, both US bonds and the dollar declined together, signaling a potential shift away from US assets and raising questions about the dollar’s structural appeal as a reserve currency.
Recent Realignment:
After the Federal Reserve’s recent meeting and a major tariff agreement with China, the DXY and yields began rising together again, indicating renewed confidence in US assets and a return to more typical market behavior.
Key Factors Influencing the Relationship
Fed Policy:
Expectations for future rate cuts or hikes directly influence both yields and the dollar. Higher expected rates generally support both.
Global Risk Sentiment:
In risk-off scenarios, the dollar can strengthen even if yields fall, due to safe-haven demand.
Trade and Fiscal Policy:
Tariffs and concerns about US debt sustainability can disrupt the usual correlation, as seen in early 2025.
Summary Table
Factor Impact on DXY Impact on Yields Typical Correlation
Rising US Yields Strengthens DXY Yields rise Positive
Fed Rate Hike Expectations Strengthens DXY Yields rise Positive
US Fiscal Concerns Can weaken DXY Yields may rise Can diverge
Global Risk Aversion Strengthens DXY Yields may fall Can diverge
Trade Tensions/Tariffs Mixed Mixed May disrupt correlation
Conclusion
As of May 2025, the DXY and US bond yields have resumed a positive correlation, both rising in response to Fed policy signals and improved risk sentiment following a major tariff agreement. However, earlier in the year, this relationship broke down due to concerns about US fiscal stability and shifting global investment flows. The interplay between DXY and yields remains sensitive to Fed policy, fiscal outlook, and geopolitical developments.

USDJPY Continues in BULLISH TRENDReason for Trade:
No clear bearish indications observed. The chart displays a well-structured bullish trend with clearly drawn higher highs (HHs) and higher lows (HLs). Following the trend for a potential continuation setup.

USD JPY Pair Bearish TrendBearish trend in the USDJPY pair and taking my trade using falling wedge pattern after diavergence in the pattern.

USD/JPY Dips FurtherUSD/JPY Dips Further
USD/JPY declined below 144.50 and is currently consolidating losses.
Important Takeaways for USD/JPY Analysis Today
- USD/JPY is trading in a bearish zone below the 146.10 and 144.90 levels.
- There is a short-term bearish trend line forming with resistance at 144.25 on the hourly chart at FXOpen.
USD/JPY Technical Analysis
On the hourly chart of USD/JPY at FXOpen, the pair started a steady decline from well above the 146.00 zone. The US Dollar gained bearish momentum below the 145.00 support against the Japanese Yen.
The pair even settled below the 144.50 level and the 50-hour simple moving average. There was a spike below 144.00 and the pair traded as low as 143.72. It is now consolidating losses with a bearish angle. Immediate resistance on the USD/JPY chart is near the 23.6% Fib retracement level of the recent decline from the 146.10 swing high to the 143.42 low at 144.25.
There is also a short-term bearish trend line forming with resistance at 144.25. The first major resistance is near the 144.90 zone and the 50% Fib retracement level of the recent decline from the 146.10 swing high to the 143.42 low.
If there is a close above the 144.90 level and the hourly RSI moves above 50, the pair could rise toward 145.50. The next major resistance is near 146.10, above which the pair could test 147.50 in the coming days.
On the downside, the first major support is near 143.70. The next major support is near the 143.20 level. If there is a close below 143.20, the pair could decline steadily. In the stated case, the pair might drop toward the 142.00 support.
This article represents the opinion of the Companies operating under the FXOpen brand only. It is not to be construed as an offer, solicitation, or recommendation with respect to products and services provided by the Companies operating under the FXOpen brand, nor is it to be considered financial advice.

USDJPY TRADE PLAN – MAY 21 BIG BREAKOUT AHEAD?USDJPY TRADE PLAN – MAY 21 | FED HAWKISH BUT YEN STAYS WEAK – BIG BREAKOUT AHEAD?
USDJPY is entering a critical technical zone as the market weighs the Fed’s persistent hawkish stance against Japan’s passive approach to the Yen’s depreciation. After a strong rally, we are seeing a potential exhaustion with key levels in play.
🌍 MACRO CONTEXT:
FED remains hawkish: Officials continue to support higher-for-longer interest rates to tame inflation → USD remains firm.
Bank of Japan silence: No signs of FX intervention or rate policy shift, causing ongoing weakness in JPY.
Risk sentiment neutral: Risk-off flows are muted; USDJPY remains trapped in a wide range – awaiting macro catalysts.
📊 TECHNICAL OUTLOOK (H2 CHART):
Price is now correcting within a falling channel.
Price broke below the MA200 and rising trendline, now retesting a key support zone at 143.77.
The current range 141.99 – 144.71 is critical – a breakout from either end may dictate the next medium-term direction.
🎯 TRADE SETUPS FOR TODAY:
✅ SCENARIO A – SELL THE RALLY (PRIMARY BIAS):
If price rejects 144.71:
SELL ZONE: 144.70 – 144.71
SL: 145.10
TP: 143.77 → 143.30 → 142.50 → 141.99
→ Key resistance area – price may trigger strong seller interest.
✅ SCENARIO B – SELL ON BREAKDOWN:
If price breaks 143.77 and retests:
SELL ZONE: 143.60 – 143.70 (post-breakdown entry)
SL: 144.10
TP: 142.50 → 142.00 → 141.99
✅ SCENARIO C – SHORT-TERM BUY (LESS FAVORABLE):
If price reacts positively at 141.99 with bullish confirmation:
BUY ZONE: 141.90 – 141.99
SL: 141.50
TP: 142.50 → 143.00 → 143.77
→ Only take this setup if strong reversal signals appear.
🔑 KEY LEVELS TO WATCH:
Resistance: 144.71 – 145.00 – 148.44
Support: 143.77 – 143.30 – 141.99 – 141.20
📌 FINAL THOUGHTS:
USDJPY remains in a volatile consolidation zone, pressured by a hawkish Fed but lacking JPY strength. Watch for PMI data and Fed comments this week for directional cues. Until then, respect the current range and trade with discipline.
📣 Bias favors SELL from 144.71 unless buyers reclaim full control – trade the reaction, not the prediction!

JPYUSD | Head & Shoulders Breakdown Setup | Bearish move Build🔍 Technical Overview
A clear Head & Shoulders pattern has formed on the JPY/USD 8H chart — a well-known bearish reversal setup often signaling a shift from bullish momentum to bearish control. The pattern is confirmed with a left shoulder, higher head, and lower right shoulder, all aligned along a defined neckline acting as key horizontal support.
Currently, the price is retesting both the neckline and a descending trendline, which adds confluence to the bearish bias. If price fails to break back above this resistance zone, we can anticipate a further drop toward the projected target zone.
📌 Key Technical Levels
Head: ~0.007180
Neckline Support: ~0.006660
Retest Area (Confluence Zone): ~0.006940–0.006960
Bearish Target: ~0.006470 (measured from the head to the neckline and projected downward)
Trendline Resistance: Acting as dynamic resistance since the recent high
⚙️ Price Action Insights
Pattern Clarity: The structure of the H&S is clean and symmetrical — a classic sign of distribution and topping out after a bullish rally.
Retest in Play: Price is currently retesting the trendline resistance. Rejection from this area strengthens bearish continuation potential.
Momentum Shift: Bullish pressure is weakening. Lower highs on the right shoulder show buyer exhaustion.
🧠 Mindset & Strategy
This setup demonstrates how patience, pattern recognition, and confluence can align to offer a high-probability trading idea.
✅ Wait for Confirmation: A strong bearish candle off the retest zone or neckline breakdown gives a cleaner short entry.
✅ Risk Management First: Place stops just above the right shoulder or trendline (~0.007000 zone).
✅ Target Logically: The target is not random — it’s derived using the classic measured move technique, matching the head-to-neckline distance.
📋 Trade Idea (Not Financial Advice)
📍 Entry: On rejection at retest zone or confirmed neckline breakdown
🎯 Target: 0.006470
🛑 Stop Loss: Above 0.007000 (trendline/right shoulder area)
⚖️ Risk/Reward Ratio: Minimum 2:1 if entered post-retest confirmation
🧠 Trader’s Note (Minds Insight)
This is where discipline comes into play. Don’t chase the move. Let the pattern complete and confirm. Head and Shoulders formations are among the most reliable reversal patterns — but only after neckline breaks or strong rejections.
This setup teaches traders to trust the process, combine horizontal and diagonal resistance, and let the price action do the talking.

USDJPY COT and Liquidity AnalysisCOT Report Analysis:
Overall, we can still see red data for the USDJPY, but let's look at the shorts closely. You can see they are being reduced. Check the charts where I highlighted the reports and how I read them.
Hey, what up traders, another week, another COT data and Liquidity report. This is a big part of my FX Trading. I'm always trying to trade with the Big players, so knowing their positions is a good thing.
📍Please be aware that institutions report data to the SEC on Tuesdays and data are reported on Fridays - so again, we as retail traders have a disadvantage, but there is the possibility to read between the lines. Remember, in the report is what they want you to see; that's why prices mostly reverse on Wednesday after the report, so their cards are hidden as long as possible. However, if the trend is running, you can read it and use it to your advantage.
📍Tip: If the level has confluence with the high volume on COT, it can be strong support / Resistance.
Analysis done on the Tradenation Charts
Disclosure: I am part of Trade Nation's Influencer program and receive a monthly fee for using their TradingView charts in my analysis.
"Adapt what is useful, reject what is useless, and add what is specifically your own."
Have a great trading week, see in the next report.
— David Perk aka Dave FX Hunter ⚔️

Bearish Pressure on USDJPY Likely to Continue With Higher YieldsUSDJPY was rejected at the 38.2% retracement level. Rising yields may continue to exert downward pressure until the 140 support level is tested. The true direction for USDJPY will likely become clearer after that test.
Similar to USDJPY, EURJPY has also formed a bearish technical outlook. You can check our earlier post on EURJPY here:
Unless EURUSD rises sharply, the downward pressure on both USDJPY and EURJPY is likely to persist.

USDJPY Technical Breakdown & Macro ContextThe USDJPY pair is showing clear signs of bearish momentum, both technically and fundamentally.
🔍 Technical Overview (H1 Chart):
USDJPY has broken below an expanding channel, as well as the 200-period moving average on the 4-hour chart. This dual confirmation of trend weakness suggests a high-probability downside continuation, with selling pressure accelerating.
This breakdown often signals a reversal or correction phase after a period of broad price expansion — a classic exhaustion pattern now materializing as sellers regain control.
💴 Macro & Bond Market Insight – Japan:
Adding to the technical setup, Japan’s latest 20-year government bond auction just recorded the weakest investor demand since 2012. (Source – Bloomberg)
Despite this, Reuters reports that market participants still expect the Bank of Japan to continue its monetary tightening path, potentially pushing long-term JGB yields higher — and boosting demand for the yen in the process.
When tightening expectations rise in Japan while the U.S. grapples with fiscal risk and softening yields, the interest rate differential narrative shifts, weakening USDJPY.

USDJPY SHORT💥 TRADE IDEA - USD/JPY (SHORT)
🕰 15min + 1hr Confluence | NY Session Setup
📍 Entry: 144.114
🎯 TP: 143.586
🛑 SL: 144.237
📊 RR: ~1 : 4.3
🧱 Price reacted from 1hr supply zone + clean breakdown on 15min.
📉 Structure: Bearish trend continuation

The market will maintain its bearish guard.Risk Management Notes:
Risk only 1-2% of total capital on this trade
Signal valid for 3-5 trading days
Invalidation point: Price closing above 145.500 on 4H timeframe

USDJPY: Dear Traders,
Any Breaks over the current zone and over the red bearish trend line, is a sign of bullish moves till the next zone, 147.841.
On the other hand, any breaks below the zone and below the bullish green trend line is a sign of bearish moves till the 142.234.
Take care and have a good week.

USDJPY Technical Analysis.This chart shows the USD/JPY (U.S. Dollar / Japanese Yen) currency pair on the 1-hour timeframe, with the following analysis:
1. Current Price: 144.530
2. Trend Outlook: The analysis suggests a bearish scenario is likely.
3. Price Action:
The price has been consolidating below resistance.
The chart outlines a potential bearish rejection from the resistance zone.
4. Stop Loss (SL): Marked above the current price action, above the recent highs — a safety level in case price reverses and breaks upwards.
5. Target: The target is around 144.121, indicating a short position with a relatively small risk-to-reward range.
6. Scenarios:
Red path (bearish): Expected price to drop after failing to break above resistance.
Green path (invalidated scenario): If the price breaks above SL, the bearish setup becomes invalid.
This chart reflects a short trade setup, betting on a pullback or continuation of the downtrend. Let me know if you’d like help calculating position size, risk/reward ratio, or creating an alert system for this trade.
