USDJPY long at current market priceDaily candle USDJPY closed at strong bullish.
we observed healthy retracement during Asian session.
I'm expecting the price will bounce from here.
Calculate your own risk & reward.
Good Luck
JPYUSD trade ideas

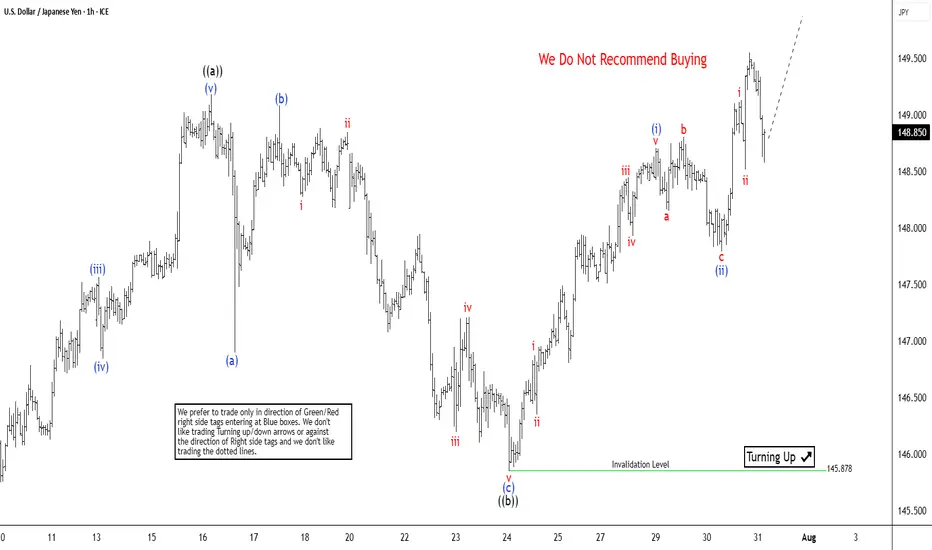
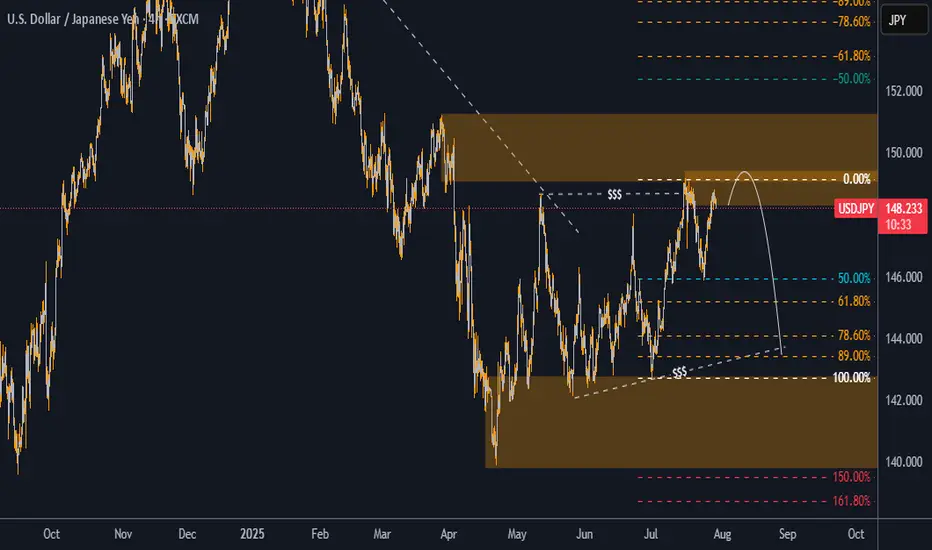
USDJPY Targets Completion of 7 Swing RallyThe USDJPY pair exhibits an incomplete bullish sequence originating from the April 22, 2025 low, signaling potential for further upside. We can project the extreme target area for this rally can be projected using using the 100% to 161.8% Fibonacci extension from the April 22 low. This places the target range between 150.88 and 156.33. The ongoing rally from the May 27, 2025 low is unfolding as a double three Elliott Wave structure. This structure has two zigzag corrective structure driving the upward momentum.
From the May 27 low, wave W concluded at 148.03. A corrective pullback in wave X then followed, which bottomed at 142.67. Currently, wave Y is in progress, with internal subdivision as a zigzag pattern. From the wave X low, wave ((a)) peaked at 149.18, followed by a corrective wave ((b)) that unfolded as a zigzag. Within this structure, wave (a) ended at 147.81 and wave (b) reached 149.08. Wave (c) completed at 145.87, finalizing wave ((b)) in the higher degree. The pair has since resumed its ascent in wave ((c)), developing as a five-wave impulse.
From wave ((b)), wave (i) concluded at 148.71, with a minor pullback in wave (ii) at 147.79. In the near term, as long as the pivot low at 145.87 holds, dips are expected to attract buyers in a 3, 7, or 11-swing corrective pattern, supporting further upside toward the Fibonacci extension targets.
USD/JPY BEARS ARE GAINING STRENGTH|SHORT
USD/JPY SIGNAL
Trade Direction: short
Entry Level: 147.871
Target Level: 145.815
Stop Loss: 149.230
RISK PROFILE
Risk level: medium
Suggested risk: 1%
Timeframe: 1D
Disclosure: I am part of Trade Nation's Influencer program and receive a monthly fee for using their TradingView charts in my analysis.
✅LIKE AND COMMENT MY IDEAS✅

USDJPY BULLISHUJ closed bullish last week so I’ll continue looking for buys this week. There was a daily double bottom & 50% Retracement on the daily timeframe. I would like for price to either break the H4 resistance, form a HL then look for buys. Or price could retrace and form a HL the I’ll look for buys towards daily resistance @149.190 then my next TP will be 151.00

BoJ keep interest rate unchanged, yen weakeningFollowing the July meeting, the BoJ maintained its interest rate at 0.5%, citing prevailing uncertainties from trade tariffs. Concurrently, the BoJ revised its inflation forecast upward to 2.7% YoY from 2.2%. The central bank's language on economic uncertainty has become less pessimistic, downgrading trade policy risks from "extremely high" to "high uncertainties remain," which signals a growing, albeit cautious, confidence in the economic outlook.
In the US, the June PCE surged to 2.6% YoY, surpassing the 2.5% prev. cons. The increase was attributed to tariff impacts, with Goods prices rising 0.4% MoM, the fastest pace since January, while Services prices held steady at 0.2% MoM.
The higher-than-expected US PCE data and the BoJ's decision to hold interest rates have continued to drive further appreciation of the USDJPY.
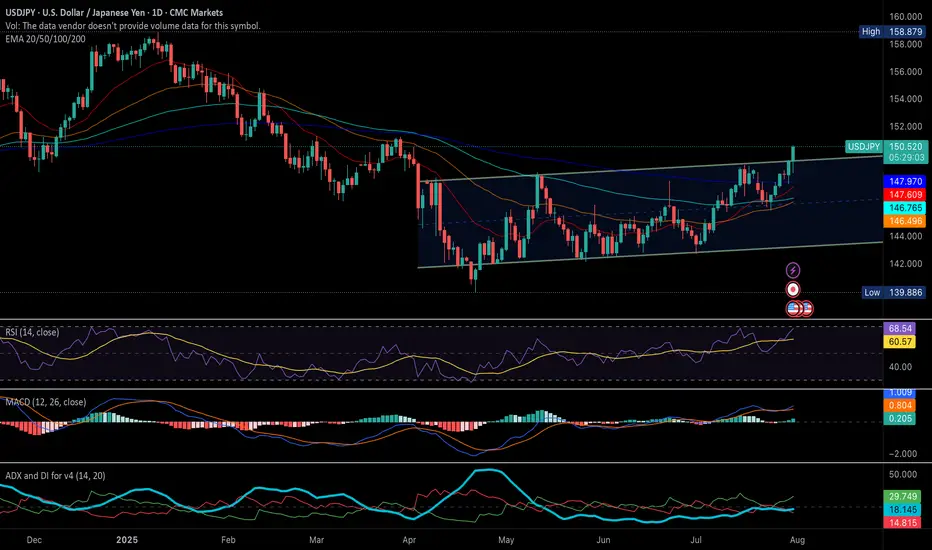
USD/JPY Technical Analysis
The USD/JPY pair is trading above its EMAs extensions, signaling a continuation of the bullish momentum. The price has successfully breached the ascending resistance trendline. However, the RSI is in overbought territory, suggesting that the current rally may be extended, and a potential pullback could be imminent.
The pair could continue to test the resistance level at 151.367. Should it fail to break this level, a rebound could see the USD/JPY pair test the support at 149.65.
By Van Ha Trinh - Financial Market Strategist at Exness
USDJPYMaintaining Long Bias On UJ. Targetted price prediction are the orange and blue arrow for both TP1 and TP2
Trade safe and manage you risk wisely

Bearish - but first up then downBearish - but first up then down Bearish - We’re currently seeing a deceptive move: price is pushing upward into a supply zone or imbalance, likely to lure late buyers. The bigger picture remains bearish — structure is still respecting lower highs.
Play:
Expect a short-term move up to mitigate imbalances or tap supply (liquidity grab), followed by a strong rejection and continuation down in line with higher timeframe bearish structure.
Watching for a sharp CHoCH or bearish engulfing in key zones to reinforce the sell.
Let me know if you want this in a more coded style just for your trading group.


USDJPY shortSo far for the year of 2025, the USDJPY had a lower push off of the year open. Since March it has been in a 4 month consolidation, making a bear flag formation. Obviously the risk markets are bullish and a bullish Yen could mean risk off, however the Swiss Franc has been strong all year, and that has not affected the risk markets. So I am not looking for risk markets to be done, I am simply looking at this pair for trend continuation. And it is a beautiful trend thus far, with a perfect consolidation period. So I am looking for a short as long as price fails to get above Aprils high, as that is the range we are trading inside. Looking for a failure here at these prices, and looking for a year end target of 135. Bearish invalidation would be March's high. As that could mean a shallower correction phase, and it could be looking to retest year open at that point. As long as it is trading under April's highs, I think risk is to the downside.

USD/JPY Is Ready Move Will Be Fly USD/JPY 30-min chart shows a potential buy setup from the 146.18 support zone, targeting 148.10 with stop loss at 145.82. Price is expected to rise through resistance levels at 147.00 and 147.70.

USDJPY AnalysisThis analysis is based on the 4-hour timeframe, reversal trading, and trend formation. I' looking for buys in this market and I explained why in the video. I will post updates on this analysis soon!

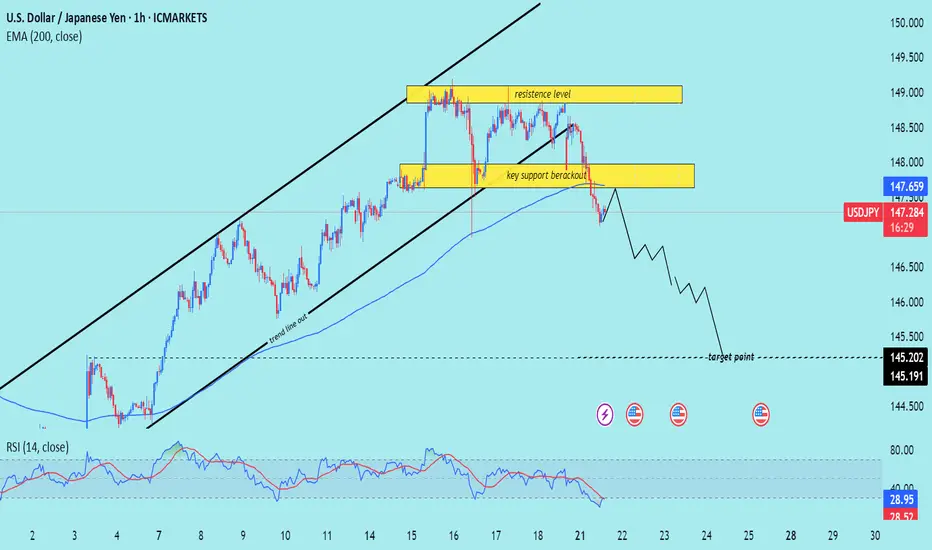
USD/JPY) bearish Trend Read The captionSMC Trading point update
Technical analysis of USD/JPY on the 1-hour timeframe, signaling a potential drop toward the 145.200 – 145.191 target zone. Here's the detailed breakdown:
---
Technical Analysis – USD/JPY (1H)
1. Rising Channel Breakdown
Price has broken below an ascending channel, confirming a trend line breakout and signaling a trend shift from bullish to bearish.
The trend line cut and rejection from the upper resistance zone support the bearish reversal.
2. Key Support Breakout
A crucial horizontal support zone around 147.80–148.00 was broken.
The break-and-retest of this area (yellow box) acts as a confirmation of bearish momentum continuation.
3. Bearish Momentum Below EMA
Price is trading below the 200 EMA (147.659) — a strong signal of downward bias on this timeframe.
The EMA has flipped from dynamic support to resistance.
4. RSI Oversold but Bearish
RSI is at 29.41, in oversold territory, which may hint at a short-term bounce.
However, the broader structure suggests more downside potential before a deeper retracement.
5. Target Projection
Projected target zone is between 145.200–145.191, aligning with previous structure lows and likely liquidity zone.
Mr SMC Trading point
Summary
Bias: Bearish
Current Price: 147.307
Key Resistance: 147.80–148.60 zone
Structure: Rising channel break + key support breakout
200 EMA: Above price (bearish signal)
RSI: 29.41 – oversold but momentum remains bearish
Target: 145.200–145.191
Please support boost 🚀 this analysis)

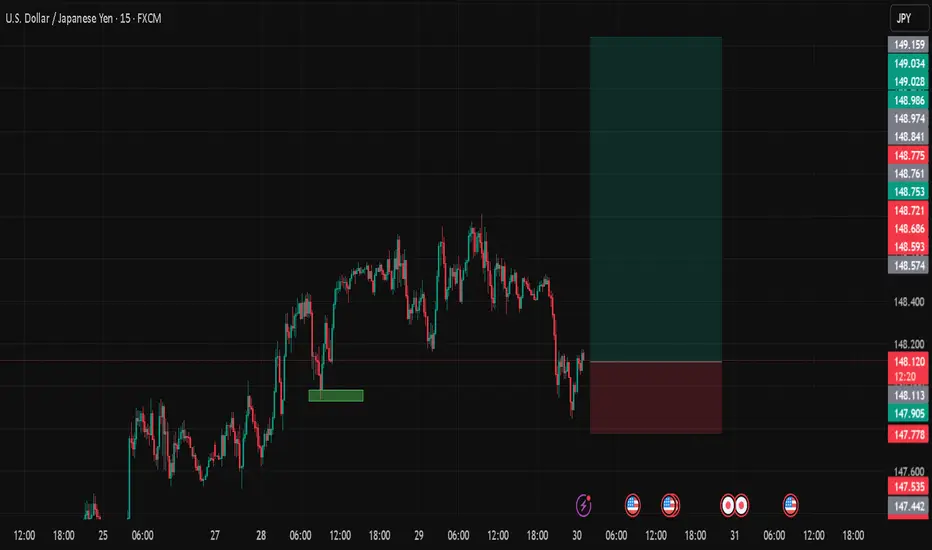
USDJPYDate:
July 30,2025
Session:
Asia and Sydney Session
Pair:
USDJPY
Bias:
Long
Liquid from Mondays New york open swept now price wants to follow trend
Entry: 148.108
Stop Loss: 147.778
Target: 149.640
RR: 4.57
USD/JPY Technical Analysis – Bearish Outlook from Key Supply ZonThe USD/JPY pair is currently presenting a strong bearish opportunity and price action structure. As of the latest 4H chart analysis, the price has reached a well-defined supply zone around the 148.80–149.70 area. This zone aligns with a previous institutional level where price showed significant reaction, marking it as a valid area of interest for sellers.
Liquidity Grab & Rejection
The market structure remains bearish overall. Recently, price took out a cluster of liquidity above the previous highs. This liquidity sweep suggests that smart money may have accumulated short positions, preparing for a move lower.
High-Probability Sell Zone
The price is currently reacting to a premium zone near the 0% Fibonacci retracement level, drawn from the recent swing high to swing low. This zone also coincides with a previous area of imbalance and supply, reinforcing the bearish setup.
Key Bearish Targets
First Target: 145.89 — this aligns with the 50% Fibonacci retracement level and a previous structural support.
Second Target: 142.56 — this deeper target sits near the 89% Fibonacci level, close to an old demand zone where price may look to rebalance.
Summary
With trend direction biased to the downside, the pair is showing strong signs of rejection from a key supply zone after sweeping liquidity. If momentum continues, we expect USD/JPY to drop toward 145.89 initially, with an extended move possibly reaching 142.56.
Traders should monitor price action closely for further confirmations and maintain proper risk management, especially with upcoming economic catalysts that may affect the JPY.
Trade Setup: USDJPY – Short Position Opportunity A technical seTrade Setup: USDJPY – Short Position Opportunity
A technical sell signal has emerged on the USDJPY pair, offering a short-term bearish trading opportunity based on current price action, resistance levels, and weakening bullish momentum.
USDJPY is trading near a key resistance zone around 148.200, where price has previously faced rejection, suggesting sellers are gaining control.
The entry at 148.193 allows for a high-probability short position just below the resistance, with minimal risk and solid potential reward.
The first target at 148.050 is a minor support level and a logical initial exit for short-term traders looking to secure fast gains.
The second target at 147.940 aligns with a recent price consolidation low and offers a more meaningful profit zone.
The final target at 147.880 touches a key demand zone and reflects the expected extent of the move if bearish pressure sustains.
The stop loss at 148.280 is wisely placed above the local resistance and recent swing high to minimize risk while allowing the trade some breathing room.
Write to Teefa Alizafar

USDJPY Asian session quick scalpingNFA...This is a personal trade I am willing to gamble a few bucks on. Ride with me if you want. gracias

USDJPY – DAILY FORECAST Q3 | W31 | D30 | Y25📊 USDJPY – DAILY FORECAST
Q3 | W31 | D30 | Y25
Daily Forecast 🔍📅
Here’s a short diagnosis of the current chart setup 🧠📈
Higher time frame order blocks have been identified — these are our patient points of interest 🎯🧭.
It’s crucial to wait for a confirmed break of structure 🧱✅ before forming a directional bias.
This keeps us disciplined and aligned with what price action is truly telling us.
📈 Risk Management Protocols
🔑 Core principles:
Max 1% risk per trade
Only execute at pre-identified levels
Use alerts, not emotion
Stick to your RR plan — minimum 1:2
🧠 You’re not paid for how many trades you take, you’re paid for how well you manage risk.
🧠 Weekly FRGNT Insight
"Trade what the market gives, not what your ego wants."
Stay mechanical. Stay focused. Let the probabilities work.
FX:USDJPY

USDJPY – Bearish Pressure Builds Near Channel TopUSDJPY is approaching strong resistance around 149.900, a level that has repeatedly triggered price rejections. The ABCD structure suggests the current bullish correction may be nearing completion. If price fails to break above this zone, selling pressure could emerge.
On the news front, Japan’s core inflation remains elevated, reinforcing expectations that the BOJ will maintain its current stance. Meanwhile, the U.S. dollar is losing momentum after a series of mixed economic data releases.
Strategy: Consider SELL opportunities if clear reversal signals appear near 149.900. A short-term target lies around the 148.200 support zone. A confirmed break below this level could signal the start of a deeper bearish move.

USDJPY LongDecided to do a long entry on UJ. Below is the prediction. Entry was during Asian session. Expecting TP of UJ at around 149ish or 151.250 max

USDJPY TRADE IDEA💴 USD/JPY Smart Money Outlook – July 28, 2025
🔍 Technical Breakdown:
• Market Structure:
• A strong Break of Structure (BOS) is already printed, confirming bullish intent.
• Price has created a clean internal range, likely to engineer liquidity before continuation.
• Key Zones Identified:
• Demand zone marked around 146.90 – 147.20. This is where institutional orders are anticipated.
• Price is currently near short-term highs (~148.38), where liquidity is likely being built.
• Expected Scenario:
• Anticipate a retracement back into the demand zone (gray box) for a low-risk buy entry.
• Bullish continuation is projected toward the 148.60+ region, breaking above current highs.
• Smart Money Flow Logic:
• BOS confirms bullish bias → Pullback to demand → Entry after liquidity sweep → Continuation toward new highs.
🧠 Smart Money Narrative:
1. Internal liquidity buildup just above BOS zone.
2. Price is likely to retest demand before institutional buyers re-enter.
3. Ideal entry after a sweep, with confirmation on lower timeframe.
4. Targeting external liquidity above 148.60 zone.

USDJPY FORECASTA new week is already in motion guys everything is looking good in the market , Today I'm looking into the USDJPY which is looking good however we need some development into the market. Let's see how the market will be moving!
