USDJPY; RETEST AND CONTINUATION HIGHERHello traders,
USDJPY has been in an uptrend for a while now and heavily corrected from the top of 148.000 down to a strong resistance of 145.000
we expect a continuation from here targeting our previous highs of 148.000
good luck
JPYUSD trade ideas

LONG ON USD/JPYLong on UJ
- Price is respecting a major demand zone after a break and retest
- DXY (Dollar) is bullish
- Yen Bearish

USDJPY Poised for a BreakoutUSDJPY Poised for a Breakout
On the 4-hour chart, USDJPY is not yet taking a clear direction. The price is showing the possibility of both movements.
With the current data we can see that USDJPY is forming a triangle pattern and only the breakdown up or down will show the direction of the price.
However, I think the chances are higher for the bullish movement considering that the geopolitical tension in the Middle East is also very high and the USD remains one of the strongest currencies.
Bullish target: 147.90
Bearish target: 140.90
⚠️ Note: If the pattern transforms more than this triangle, then we may be in a different situation and everything may be invalid. The analysis may change over time.
You may find more details in the chart!
Thank you and Good Luck!
❤️PS: Please support with a like or comment if you find this analysis useful for your trading day❤️
Disclosure: I am part of Trade Nation's Influencer program and receive a monthly fee for using their TradingView charts in my analysis.

USDJPYLooking at this chart after I just did the EURJPY analysis, now this one looks more bullish than bearish BUT that's only if there is a breakout from the supply zone which Im assuming will give us a consolidation first before it shoots straight up to complete Wave 5. At the completion of Wave 5, we can expect the drop again as a correction and retest, which should usher in more buyers to form a Cup and Holder pattern. I really see the JPY being stronger than USD futuristically and practically.

Analysis of Trades and Trading Tips for the Japanese YenThe price test at 144.27 occurred when the RSI indicator had already moved significantly above the zero line, but the strong U.S. labor market data offered a high probability of the dollar strengthening against the yen, which I decided to take advantage of. As a result, the pair rose toward the target level of 145.06.
The confident growth in U.S. non-farm employment recorded in May exceeded experts' expectations' causing noticeable fluctuations in currency, markets. The publications of data showing the creation of 139,7000 new jobs versus the forecasted 127,000 instantly strengthened the U.S. dollar, putting pressure on the Japanese yen. The yen's reaction to the news was immediate: the currency weakened significantly against the dollar. Investors perceived the data as a signal of the strength of the U.S. economy and the likely continuation of Federal Reserve's tight monetary policy. Furthermore, the stable unemployment rate in the U.S. recorded at 4.2%, also reinforced the market's optimistic sentiment.
Today's data shows that Japan's GDP for the first quarter was revised upward, which helped the yen recover slightly from Friday's losses against the U.S. dollar. However, despite the positive revision, Japan's economy still faces serious challenges. Weak domestic demand and an aging population continue to pressure growth, while geopolitical uncertainty poses additional obstacles. The Bank of Japan maintains a wait-and-see approach and has no plans to raise interest rates for now, which had previously provided good support to the the yen. Strong growth in bank lending also contributed to increased demand for the yen.

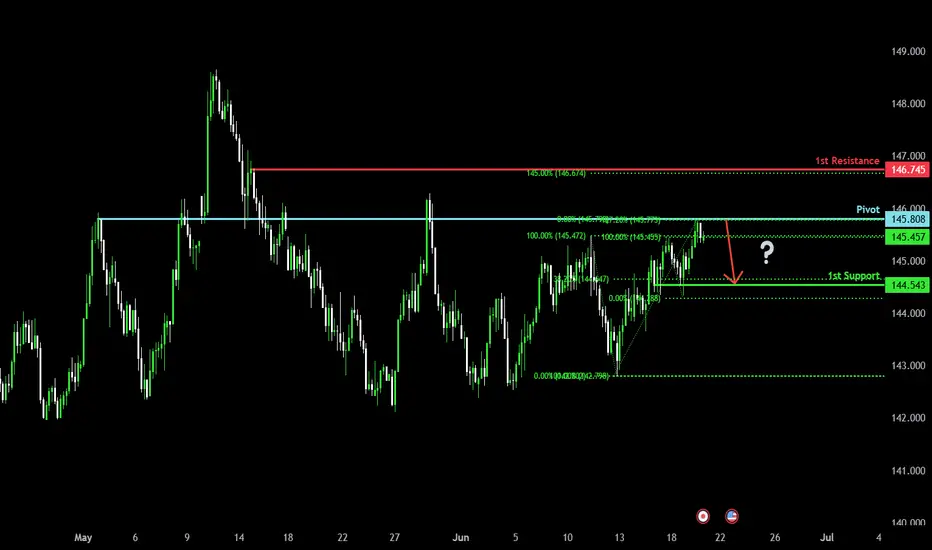
Bearish reversal?USD/JPY has reacted off the pivot and could drop to the 1st support which is a pullback support.
Pivot: 145.80
1st Support: 144.54
1st Resistance: 146.74
Risk Warning:
Trading Forex and CFDs carries a high level of risk to your capital and you should only trade with money you can afford to lose. Trading Forex and CFDs may not be suitable for all investors, so please ensure that you fully understand the risks involved and seek independent advice if necessary.
Disclaimer:
The above opinions given constitute general market commentary, and do not constitute the opinion or advice of IC Markets or any form of personal or investment advice.
Any opinions, news, research, analyses, prices, other information, or links to third-party sites contained on this website are provided on an "as-is" basis, are intended only to be informative, is not an advice nor a recommendation, nor research, or a record of our trading prices, or an offer of, or solicitation for a transaction in any financial instrument and thus should not be treated as such. The information provided does not involve any specific investment objectives, financial situation and needs of any specific person who may receive it. Please be aware, that past performance is not a reliable indicator of future performance and/or results. Past Performance or Forward-looking scenarios based upon the reasonable beliefs of the third-party provider are not a guarantee of future performance. Actual results may differ materially from those anticipated in forward-looking or past performance statements. IC Markets makes no representation or warranty and assumes no liability as to the accuracy or completeness of the information provided, nor any loss arising from any investment based on a recommendation, forecast or any information supplied by any third-party.
Major resistance ahead?USD/JPY is rising towards the resistance level, which is a pullback resistance that aligns with the 145% Fibonacci extension and the 61.8% Fibonacci projection. The price could reverse from this level towards our take profit.
Entry: 145.90
Why we like it:
There is a pullback resistance that lines up with the 145% Fibonacci extension and the 61.8% Fibonacci projection.
Stop loss: 146.78
Why we like it:
There is a pullback resistance level that aligns with the 145% Fibonacci extension.
Take profit: 144.62
Why we like it:
There is a pullback. support level.
Enjoying your TradingView experience? Review us!
Please be advised that the information presented on TradingView is provided to Vantage (‘Vantage Global Limited’, ‘we’) by a third-party provider (‘Everest Fortune Group’). Please be reminded that you are solely responsible for the trading decisions on your account. There is a very high degree of risk involved in trading. Any information and/or content is intended entirely for research, educational and informational purposes only and does not constitute investment or consultation advice or investment strategy. The information is not tailored to the investment needs of any specific person and therefore does not involve a consideration of any of the investment objectives, financial situation or needs of any viewer that may receive it. Kindly also note that past performance is not a reliable indicator of future results. Actual results may differ materially from those anticipated in forward-looking or past performance statements. We assume no liability as to the accuracy or completeness of any of the information and/or content provided herein and the Company cannot be held responsible for any omission, mistake nor for any loss or damage including without limitation to any loss of profit which may arise from reliance on any information supplied by Everest Fortune Group.

Trading Ideas USDJPY 4H [Disc On]Technical Analysis:
The presence of a Hidden Bullish Divergence on the 4-hour timeframe suggests a strong likelihood of bullish trend continuation. Additionally, the price has broken through a key support level on the 1-hour chart, with upside potential targeting the Fibonacci cluster at the psychological zone of 144.500–145.000 .
Conclusion:
A BUY opportunity is favored, with entry consideration around the 144.500–145.000 Fibonacci cluster zone. Suggested risk management includes a stop loss at 142.000 and a take profit target at 150.000.
技术分析:
在4小时周期中出现隐藏的看涨背离,表明上涨趋势有较大延续的可能性。同时,价格已突破1小时图中的关键支撑位,上行目标指向 144.500–145.000 的斐波那契密集区域(心理价位区间)。
结论:
当前倾向于寻找BUY机会,入场参考区域为斐波那契密集区144.500–145.000。建议设置止损位于142.000,目标价为150.000,以控制风险并优化利润空间。
OANDA:USDJPY

Bearish drop off 61.8% Fibonacci resistance?USD/JPY is rising towards the resistance level that lines up with the 61.8% Fibonacci retracement nds could reverse from this level to our take profit.
Entry: 145.06
Why we like it:
There is an overlap resistance level that lines up with the 61.8% Fibonacci retracement.
Stop loss: 145.45
Why we like it:
There is a pullback resistance level.
Take profit: 144.40
Why we like it:
There is an overlap support level.
Enjoying your TradingView experience? Review us!
Please be advised that the information presented on TradingView is provided to Vantage (‘Vantage Global Limited’, ‘we’) by a third-party provider (‘Everest Fortune Group’). Please be reminded that you are solely responsible for the trading decisions on your account. There is a very high degree of risk involved in trading. Any information and/or content is intended entirely for research, educational and informational purposes only and does not constitute investment or consultation advice or investment strategy. The information is not tailored to the investment needs of any specific person and therefore does not involve a consideration of any of the investment objectives, financial situation or needs of any viewer that may receive it. Kindly also note that past performance is not a reliable indicator of future results. Actual results may differ materially from those anticipated in forward-looking or past performance statements. We assume no liability as to the accuracy or completeness of any of the information and/or content provided herein and the Company cannot be held responsible for any omission, mistake nor for any loss or damage including without limitation to any loss of profit which may arise from reliance on any information supplied by Everest Fortune Group.

USD/JPY Breakout Fake Out - 148 RejectionBulls had an open door to make a run after this week's open but, so far, they've failed at the same 148.00 handle that snared buyers back in May.
The daily bar at this point is brewing up a gravestone doji but there's still a couple hours left until the close of trading for the day, and this could end up as a pin bar.
Behind the push is rate cut potential in the U.S. After Powell sounded cautious around tariffs last week, the potential for geopol risk and higher oil prices brought another inflationary factor to the fold.
But shortly after the U.S. open this morning Michelle Bowman said she was ready to cut rates in July, and that prodded a sell-off in the USD that has made a noticeable dent in USD/JPY.
Bulls aren't completely out of the equation yet, however, as supports exist at 145.92 and the 144.86-145.00 zone. If sellers sink through that, however, topside potential would dim.
But, notably, chasing breakouts in USD/JPY, in either direction, continues to be a challenging way of dealing with the pair. - js

USDJPY is about to sell down for long timeFrom the chart, you can see that usdjpy is about to sell for a long time.
Reason;
1, Third trendline touch
2, double top
3, small ascending channel

CHECK USDJPY SIGNAL READ CAPTAINusdjpy buy now ✅
entry point (147.000) (146.800)
TAKE PROFIT 1: (147.600)
TAKE PROFIT 2: (148.600)
LAST TARGET(149.600)
STOP LOSS (145.800)

USD/JPY 15M CHART PATTERNHere’s a breakdown and analysis of your USDJPY SELL trade setup on the 15-minute timeframe:
---
Trade Details:
Entry: 147.280 (Short)
Stop Loss (SL): 147.998 (≈71.8 pips risk)
Targets:
T1: 146.960 (≈32 pips)
T2: 146.600 (≈68 pips)
T3: 146.019 (≈126 pips)
---
Risk/Reward Ratios:
Target Reward (pips) R:R Ratio
T1 32 ~0.45:1
T2 68 ~0.95:1
T3 126 ~1.75:1
---
Quick Technical Evaluation (Assuming standard price behavior):
Entry near local high? If yes, solid idea to sell after rejection/candle confirmation.
SL Placement: 147.998 is quite wide—possibly above a recent high or resistance zone.
T1 is relatively close, offering a partial TP level but low reward/risk.
T2 provides near 1:1 R:R, which is more balanced.
T3 is aggressive and may require a strong bearish continuation or news catalyst.
---
Suggestions:
1. Adjust SL? – If the 147.998 level isn’t key resistance, consider tightening it closer to the swing high (e.g., 147.400–147.500) to improve R:R.
2. Scaling Out – Consider closing part of the position at T1 or T2, then letting the rest run to T3.
3. Monitor Price Action – On the 15m chart, look for bearish continuation (e.g., lower highs, bearish engulfing, MACD crossover, etc.).

USDJPY LONG Market structure bullish on HTFs DH
Entry at Daily AOi
Weekly Rejection At AOi
Daily Rejection at AOi
Previous Daily Structure point
Daily EMA Retest
Around Psychological Level 145.000
H4 EMA Retest
H4 Candlestick rejection
Rejection from Previous structure
Levels 3.67
Entry 95%
REMEMBER : Trading is a Game Of Probability
: Manage Your Risk
: Be Patient
: Every Moment Is Unique
: Rinse, Wash, Repeat!
: Christ is King.

DeGRAM | USDJPY retesting the resistance level📊 Technical Analysis
● Four consecutive higher-lows off 140.9 have carved a rising flag that presses the channel roof (144.8); flag depth projects to the April swing-top/ Fib cluster at 147.8 once 145 is cleared.
● Daily RSI holds above 50 and price is now trading back above the broken wedge-cap (142.9), confirming it as demand and tilting risk toward the 150.9 macro ceiling.
💡 Fundamental Analysis
● US 2-yr yields stay >4.70 % after solid ISM-services prices, while BoJ minutes show members preferring “patient” normalisation; the widening policy gap keeps yen funding pressure intact.
✨ Summary
Long 142.9-144.0; break of 145 targets 147.8, stretch 150.9. Bull view invalidated on a daily close below 140.9.
-------------------
Share your opinion in the comments and support the idea with like. Thanks for your support!

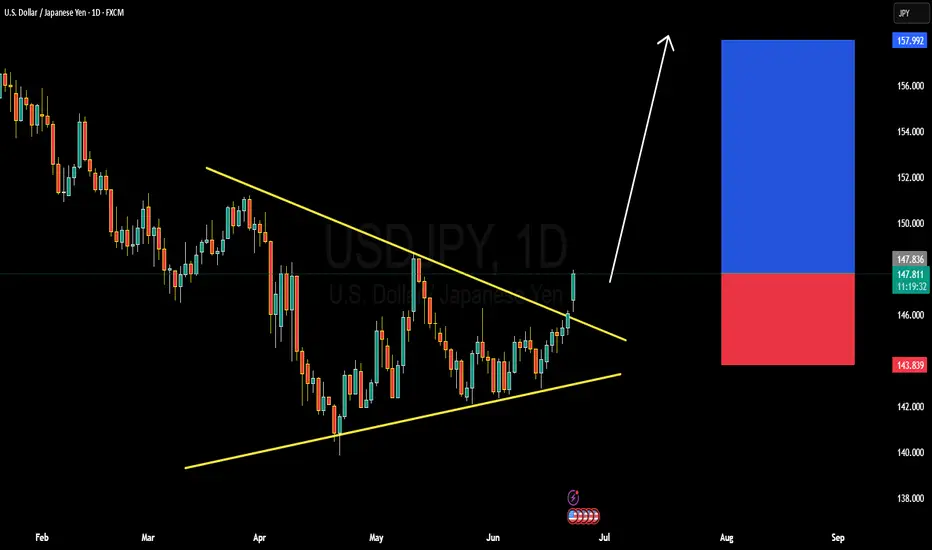
SDJPY BULLISH OR BEARISH DETAILED ANALYSISUSDJPY has successfully broken out of the symmetrical triangle structure that has been forming since early April, with today’s daily candle showing strong bullish momentum above the resistance zone around 147.500. The breakout is clean and backed by volume, which suggests that bulls are in full control. Price action is respecting the trendline structure and has now confirmed a fresh higher high, setting the stage for the next bullish leg. My immediate upside target for this move stands at 157.900.
Fundamentally, the divergence between the Federal Reserve and the Bank of Japan continues to widen. The Fed remains hawkish with inflation still sticky in the US and interest rate cuts being pushed further out. In contrast, the Bank of Japan remains ultra-dovish, with no major policy tightening in sight and continued yield curve control. This policy mismatch is keeping the Yen under consistent selling pressure. Additionally, Japan's core inflation slipped again this week, further reducing the probability of any BOJ rate hike this quarter.
The technical breakout aligns perfectly with the macro narrative. A strong bullish candle breaking structure on the daily suggests momentum will likely continue. With no strong resistance until the 157.900 area, this setup offers a high-conviction long opportunity. Traders should watch for minor pullbacks toward 147.000–146.800 as potential re-entry or add-on zones.
With rising US bond yields, weak Japanese fundamentals, and breakout confirmation on the chart, USDJPY is now well-positioned for a continuation rally. This is a trend-following setup with solid fundamentals and momentum confirmation—ideal conditions for a profitable move in the current forex environment.
U
Possible Sells on USDJPY Patiently waiting for price to get into my M15 Order Block then I'll enter a sell

USD/JPY 2-Hour Forex Chart2-hour performance of the U.S. Dollar (USD) against the Japanese Yen (JPY) from FOREX.com, showing a current exchange rate of 145.498 with a decrease of 0.661 (-0.45%). The chart highlights a recent sharp decline, with a shaded area indicating a potential support or resistance zone around 145.000 to 146.047. Key levels include 144.721 (support) and 146.047 (resistance), with the price movement tracked over the past two hours.

CHECK USDJPY SIGNAL READ CAPTAINusdjpy sell now ✅
entry point (145.400) (145.300)
TAKE PROFIT 1: (145.000)
TAKE PROFIT 2: (144.500)
LAST TARGET (144.100)
STOP LOSS (145.800)

USDJPY Short: 61.8% retracementHi, a simple reason to short: 61.8% retracement. Stop above 144.44.
Thank you.

USDJPYUSDJPY is currently approaching a major breakout zone as it nears the apex of a symmetrical triangle pattern. The pair has broken above the key horizontal resistance area around 145.80–146.00, which previously acted as a strong supply zone. Price is now challenging the descending trendline resistance.
A confirmed breakout and retest of the triangle and resistance zone may open the door for a bullish continuation toward 147.50, and potentially 150.00+, as marked on the chart. However, if the breakout fails, we may see a pullback toward the 145.00–144.80 support region before any further upside.
This setup highlights a potential breakout-retest-continuation scenario. Traders should watch for price action confirmation near the trendline for further direction.


USD/JPY breakthrough & long position? (novice analysis) #techFrom what I've seen so far, USD/JPY has the momentum to try to break through 146.093 and is heading towards 146-147.
The price could make a pullback around the first key level before breaking through, if not, I would anticipate the price making a retracement after breaking through
Hi, I'm not good at trading, and I'm still learning. I explore trading alone myself and also use online free sources to improve. If somewhere mistakes please notify me
Thank you.
